Abstract
Introduction
Benign prostatic hyperplasia (BPH) creates significant expenses for the Medicare program. We sought to determine trends in expenditures for BPH evaluative testing after urologist consultation, and place these trends in the context of overall Medicare expenditures.
Methods
Using a 5% national sample of Medicare beneficiaries from 2000 to 2007, we developed a cohort of men with claims for new visits to urologists for diagnoses consistent with symptomatic BPH (n=40,253). We assessed trends in initial expenditures (within 12 months of diagnosis; inflation and geography adjusted) by categories of evaluative tests derived from the 2003 AUA Guideline on the Management of BPH. Using governmental reports on Medicare expenditures, trends in BPH expenditures were compared to overall and imaging-specific Medicare expenditures. Comparisons were assessed by Z-tests and regression analysis for linear trends as appropriate.
Results
Between 2000 and 2007 inflation adjusted total Medicare expenditure per patient for the initial evaluation of BPH patients seen by urologists increased from $255.44 to $343.98 (p<0.0001). Increases in BPH related imaging (55%), were significantly less than increases in overall Medicare expenditures on imaging (104%; p<0.001). The 35% increase in per patient expenditures for BPH was significantly lower than the increase in overall Medicare expenditure per enrollee (45%; p=0.0.0015).
Conclusion
From 2000 to 2007, inflation adjusted expenditures on BPH related evaluations increased. This growth was slower than overall growth in Medicare expenditures, and increases in imaging expenditures related to BPH were restrained compared to the Medicare program as a whole.
Keywords: Prostatic Hyperplasia, Medicare, Health Expenditures
Introduction
As men age, benign prostatic hyperplasia (BPH) and associated lower urinary tract symptoms (LUTS) become increasingly significant medical problems. By age 60, the prevalence of BPH is greater than 50%, and by age 85 the prevalence of BPH approaches 90%.1 Consequently, BPH and associated LUTS represent a common, and costly, condition managed in outpatient urological practice. Total BPH related expenditures were estimated at $1.1 billion dollars in 2000.2
Escalating medical expenditures are a major concern in the United States, especially in the population affected by BPH. Given the age distribution of prevalent BPH, most men with BPH are covered by Medicare, a federally managed and sponsored program. Medicare covers approximately 95% of Americans older than 65 years of age.3 At current rates of expansion, federal analysis indicates that the Medicare program is not sustainable.4 As a result the Center for Medicare and Medicaid Services has examined a variety of measures to decrease the cost curve including emphasizing consensus guidelines for the diagnosis and treatment of disease and closer scrutiny of diagnostic imaging.
In BPH care, the American Urological Association has published one such guideline. This guideline separates initial evaluation tests into categories of recommended care, optional care, and not recommended care.1 We have previously found substantial variation among urologists in the use of these evaluative care tests for men with BPH.5, 6 With an increasing concern about Medicare expenditures, examination of changes in expenditures on BPH related work up is warranted. We evaluate urologists’ expenditures on evaluative care of men with BPH in the Medicare population, from the years 2000 to 2007, and compare these expenditures to trends in overall Medicare spending. We hypothesized that trends in BPH evaluative care expenditures mirrored trends in overall Medicare spending, increasing dramatically over the period of investigation.
Materials andMethods
Study population
From a 5% random sample of men insured by Medicare between 2000 and 2007, we selected men with International Classification of Disease Ninth Edition (ICD-9) diagnosis codes (Appendix 1) consistent with BPH on outpatient Medicare claims.3 The specialty of the physician billing for the service was determined from the Medicare records, and confirmed with data from the American Medical Association Master file. We then limited the cohort to men whose BPH diagnosis was recorded on an encounter with a urologist. Patients were excluded if they lacked continuous enrollment in Medicare parts A and B or if they were enrolled in a Medicare HMO for two years prior to the initial visit with the urologist to one year after the visit. The two year period was used to confirm that there were no prior visits to a urologist for a non-BPH diagnosis. To make our study cohort most applicable to the average patient presenting to a urologist with LUTS, we also excluded patients with diagnoses suggesting prior surgical BPH therapy, prostate cancer, or neurologic disease that could contribute to LUTS (Appendix 2).
Appendix #1.
Diagnosis Codes Used to Define Study Cohort
| ICD-9 Code | Name |
|---|---|
| 599.6 | Urinary obstruction, unspecified |
| 600.0 | Hypertrophy benign of the prostate |
| 600.9 | Unspecified hypertrophy of the prostate |
| 600.2 | Benign localized hyperplasia |
| 594.1 | Other calculus in bladder |
| 788.20 | Retention of urine, unspecified |
| 788.21 | Incomplete bladder emptying |
| 788.29 | Other specified retention of urine |
| 788.41 | Urinary frequency |
| 788.42 | Polyuria |
| 788.43 | Nocturia |
| 788.61 | Splitting of urinary stream |
| 788.62 | Slowing of urinary stream |
Appendix #2.
Exclusion Codes for Procedures and Diagnoses in the two Years before Index Urology Visit
| Procedure Name | HCPCS or ICD-9 Code |
|---|---|
| Laser coagulation of prostate | 52647 |
| Laser vaporization of prostate | 52648 |
| Transurethral destruction of prostate tissue; by microwave therapy | 53850 |
| Transurethral destruction of prostate tissue; by radiofrequency thermotherapy | 53852 |
| Transurethral destruction of prostate tissue; by water-induced thermotherapy | 53853 |
| Prostatectomy, perineal, subtotal | 55801 |
| Prostatectomy; suprapubic, subtotal | 55821 |
| Prostatectomy; retropubic, subtotal | 55831 |
| Transurethral incision of prostate | 52450 |
| Transurethral resection of bladder neck | 52500 |
| Transurethral balloon dilation of the prostatic urethra | 52510 |
| Transurethral electrosurgical resection of prostate | 52601 |
| Transurethral resection of prostate; first stage of two-stage resection | 52612 |
| Diagnosis Name | |
| Prostate Cancer | 185 |
| Parkinson’s Disease | 332 to 332.1 |
| Multiple Sclerosis | 340 |
| Hemiplegia/Hemiparalysis | 342 to 342.9 |
| Paralytic Syndromes | 344 to 344.9 |
| Cerebrovascular Disease | 430 to 438.9 |
Categorization of Care and Calculation of Expenditures
Care provided to patients during the first year after an initial visit with a urologist was categorized according to the 2003 AUA clinical guidelines for the management of BPH.1 In the 2003 guidelines, care was considered recommended, optional, or not recommended. Recommended care included urinalysis and serum prostate specific antigen. Optional care included cytology, measurement of post void residual, and urine flow rate. Not recommended care included prostate and kidney ultrasound, pressure flow studies, cystometrogram, upper urinary tract imaging, and endoscopy of the lower urinary tract. Serum creatinine was considered not recommended care in the 2003 guidelines but was recommended in the 1994 guidelines; therefore, it was placed in an independent category. We limited our analysis to evaluative care, so we did not include therapeutic procedures such as BPH surgery.
The number of tests/procedures per year in the study population was tabulated using Healthcare Common Procedure Coding System (HCPCS) and ICD-9 codes. The expenditure on each test/procedure was derived using the average national Medicare reimbursement (adjusted to 2007 dollars) for each test/procedure. Total expenditures for the study population were calculated and then multiplied by twenty as the study population represents 5% of the Medicare population. Per patient expenditures were calculated for each subcategory of care: recommended, optional, not recommended, and serum creatinine. Additionally, per patient expenditures for individual evaluative tests within the optional and not recommended care categories were calculated.
BPH Imaging Expenditures
BPH related imaging was defined as upper urinary tract imaging (including computed tomography, nuclear medicine studies, and intravenous pyelogram), renal ultrasound, transrectal ultrasound of prostate, and post void residual urine measurement. In office BPH imaging was defined as transrectal ultrasound of prostate, renal ultrasound, and post void residual. Each test was ascertained individually per patient, and then the tests were combined into the BPH related imaging and off BPH imaging groups.
Overall Medicare Expenditures and Overall Medicare Imaging Expenditures
Total Medicare per enrollee expenditure for 2000 and 2007 (common benefits) was collected from the Center for Medicare and Medicaid Services’ (CMS) National Health Expenditures (NHE) data.7 Common benefits include hospital, physician, clinical, and other professional services, as well as durable medical products. Total and physician office overall Medicare expenditures on imaging for 2000 and 2006 were calculated from the 2008 Government Accountability Office (GAO) report on Medicare Part B expenditures on imaging services.8
Statistical Analysis
Using linear regression analysis, the categories of evaluative care tests were assessed to determine which category had the most significant rate of growth. Within the categories of evaluative care tests, the individual procedures contributing to the rate of growth were assessed with linear regression analysis. Changes in expenditures on BPH imaging and Medicare imaging were compared using a two sample proportion Z-test. Changes in total per patient expenditures for BPH evaluation and Medicare per enrollee expenditures were compared using a two sample proportion Z-test. All statistical analysis was performed using SAS Version 9.2 (SAS Institute Inc., Cary, NC).
Results
Total expenditures for BPH evaluative care, extrapolated from the 5% cohort to the total Medicare population, within 12 months of an initial visit with a urologist increased from $23,679,521 in 2000 to $32,279,399 in 2007 (Figure 1; p = 0.002). Over this time period, the number of new BPH patients seen by urologists was relatively constant, with 92,700 patients in 2000 and 93,840 patients in 2007 (Figure 1). Total expenditures per patient for BPH evaluative tests increased from $255.44 in 2000 to $343.98 in 2007 (Figure 2; p < 0.0001). Although expenditures on recommended care per patient remained unchanged from 2000 to 2007 ($31.43 to $31.02; p = 0.20; Figure 2), expenditures increased for optional care ($36.93 to $60.92; p < 0.0001), not recommended care ($167.92 to $222.61; p =0.0004) and serum creatinine ($19.15 to $29.43; p = 0.001). Over the eight years of the study, “not recommended care” expenditures had the most significant rate of growth.
Figure 1. Total Expenditures on BPH Evaluative Care Tests and the Total Number of New Patients Seen by Urologists, 2000 to 2007.
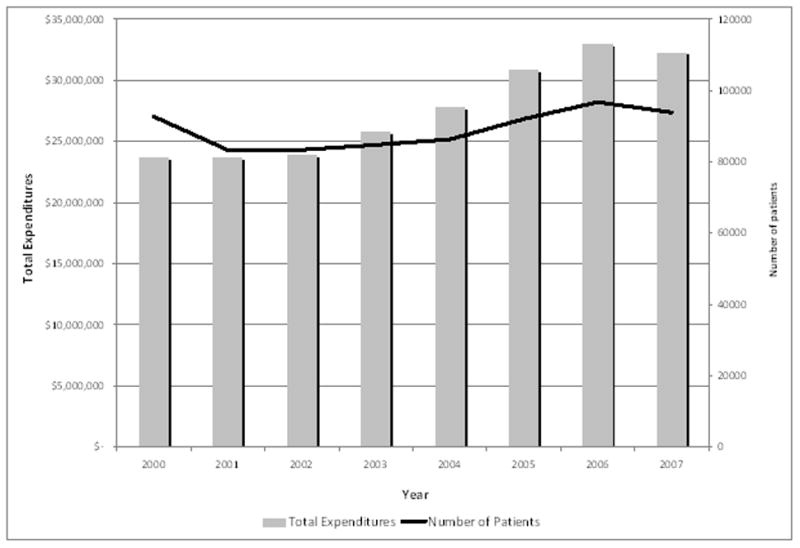
Expenditures on initial BPH care increased from $23,679,521 in 2000 to $32,279,399 in 2007 (p = 0.002). Urologists saw approximately 92,700 new BPH related patients in 2000 and 93,840 patients in 2007.
Figure 2. Changes in Expenditures by Category of Care Test, 2000 to 2007.
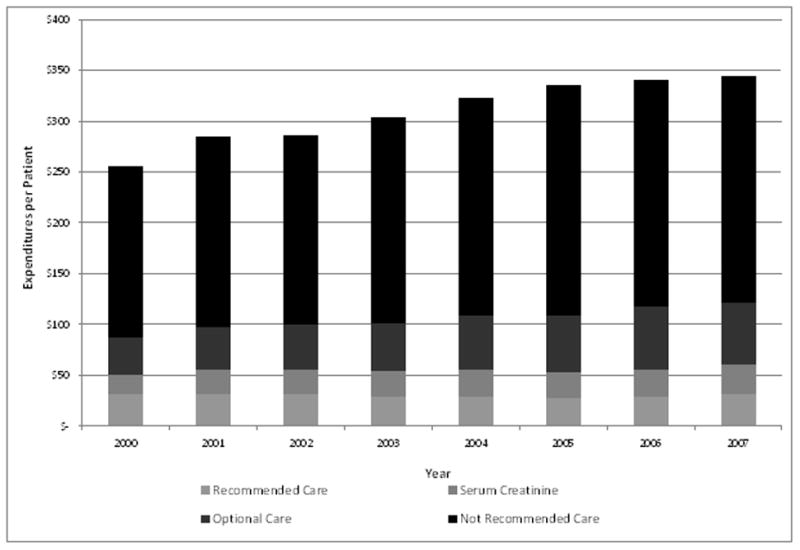
Per patient expenditures for BPH evaluative tests increased from $255.44 in 2000 to $343.98 in 2007 (Figure 2; p < 0.0001). Although expenditures on recommended care per patient remained unchanged from 2000 to 2007 ($31.43 to $31.02; p = 0.1997; Figure 2), expenditures increased for optional care ($36.93 to $60.92; p < 0.0001), not recommended care ($167.92 to $222.61; p =0.0004) and serum creatinine ($19.15 to $29.43; p = 0.0014).
In the optional care subcategory, per patient expenditures increased for cytology ($9.66 to $14.15; p < 0.001), uroflow ($14.70 to $22.71; p < 0.001), and post void residual ($12.57 to $24.06; p < 0.001) from 2000 to 2007 (Figure 3). Use of post void residual increased the most significantly from 2000 to 2007. In the not recommended subcategory, per patient expenditures remained unchanged for renal and prostatic ultrasound ($32.04 to $34.60; p = 0.09) and increased for CMG ($14.76 to $19.90; p = 0.006), pressure flow urodynamic studies ($3.28 to $7.98; p < 0.001), cystoscopy ($72.70 to $83.83; p = 0.02), and upper tract imaging ($41.90 to $78.21; p < 0.0001) from 2000 to 2007 (Figure 4). Upper tract imaging displayed the most significant rate of growth. When imaging was examined separately from other types of evaluative care (Figure 5), the increase in per patient expenditures was significant for post void residual (p<0.0001) and upper tract imaging (p<0.0001), with upper tract imaging displaying the more significant increase in use.
Figure 3. Changes in Expenditures within Optional Care, 2000 to 2007.
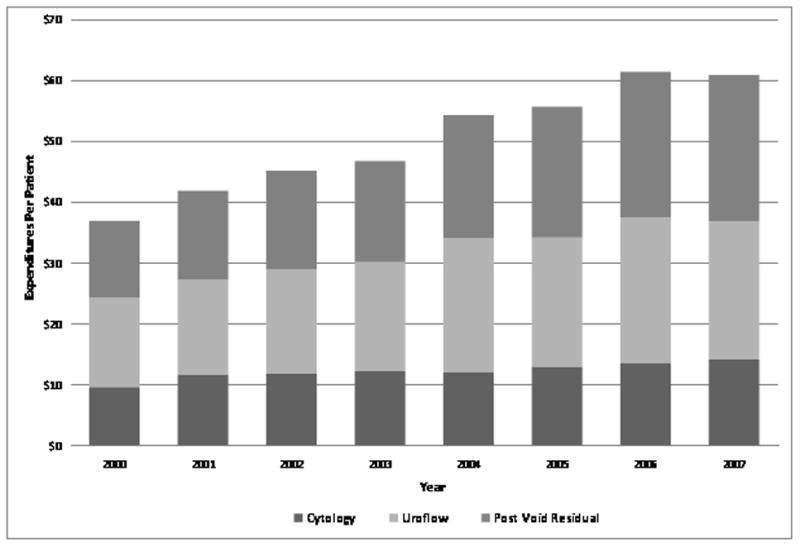
Expenditures increased significantly for all categories of care: cytology ($9.66 to $14.15; p < 0.001), uroflow ($14.70 to $22.71; p < 0.001), and post void residual ($12.57 to $24.06; p < 0.001).
Figure 4. Changes in Expenditures within Not Recommended Care, 2000 to 2007.
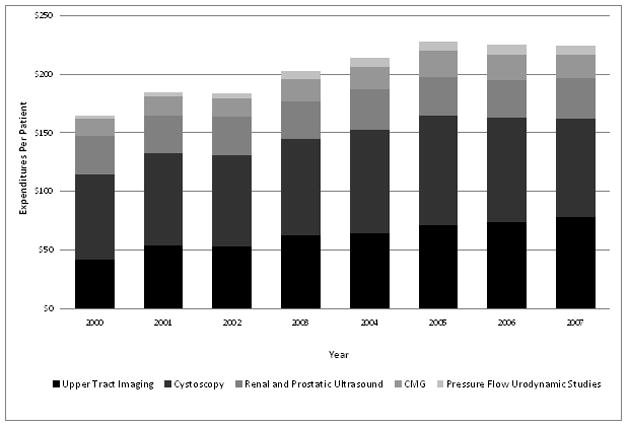
Expenditures increased for CMG ($14.76 to $19.90; p = 0.0063), pressure flow urodynamic studies ($3.28 to $7.98; p < 0.001), cystoscopy ($72.70 to $83.83; p = 0.023), and upper tract imaging ($41.90 to $78.21; p < 0.0001). Expenditures remained unchanged for renal and prostatic ultrasound ($32.04 to $34.60; p = 0.0883).
Figure 5. Changes in Imaging Related Expenditures, 2000 to 2007.
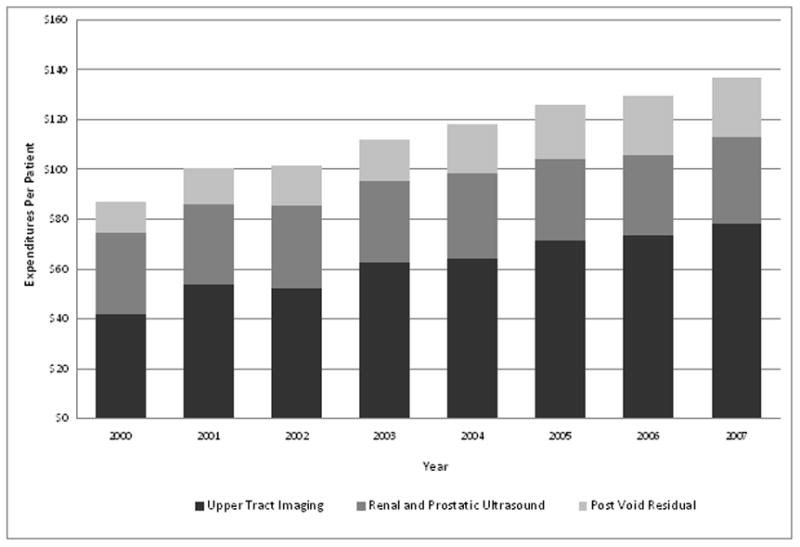
Expenditures increased significantly for post void residual (p<0.0001) and upper tract imaging (p<0.0001). Upper tract imaging had the most significant rate of growth.
Total expenditures on Medicare imaging increased from $6.89 billion in 2000 to $14.1 billion in 2006, an increase of 105%. Total expenditures on BPH related imaging increased from $8.1 million in 2000 to $12.5 million in 2006, an increase of 55%. The increase in total expenditures on Medicare imaging was significantly greater than the increase in total expenditures on BPH related imaging (p<0.0001). In office expenditures on Medicare imaging increased from $4 billion in 2000 to $9.3 billion in 2006, an increase of 126%. In office expenditures for BPH related imaging increased 82%, from $3 million in 2000 to $5.4 million in 2006. The increase for in office expenditures on Medicare imaging was significantly greater than the increase for in office BPH related imaging (p<0.0001).
The total Medicare per enrollee expenditure increased from $4,986 in 2000 to $7,204 in 2007, an increase of 45%. The total inflation adjusted expenditure per patient for initial BPH work up increased from $255.44 in 2000 to $343.98 in 2007, an increase of 35%. The increase in total Medicare per enrollee expenditure from 2000 to 2007 was significantly greater than the increase in total expenditure for initial BPH work up (p=0.002).
Discussion
Total expenditures per patient on initial evaluative care testing for BPH increased significantly from 2000 to 2007. With sub-categorization based on the 2003 AUA recommendations, expenditures for recommended care remained unchanged while expenditures on serum creatinine, optional care, and not-recommended care all increased significantly. Expenditure growth was driven by not-recommended care, with upper tract imaging contributing the greatest share of expenditure growth. Total imaging expenditures and in office imaging expenditures after visits to urologists for BPH have increased by 55% and 82%, respectively, from 2000 to 2006. This increase is significantly less than the total expenditures on Medicare imaging and in office expenditures on Medicare imaging during the same time period. Finally, expenditures on evaluative tests for BPH have experienced a slower rate of growth than outpatient Medicare expenditures as a whole.
BPH and associated LUTS are common conditions in the Medicare population. The prevalence of BPH is greater than 50% in men 60 years of age, and by 85 years of age the prevalence of BPH approaches 90%.9 BPH causes a considerable burden as men age, with moderate to severe LUTS (AUA symptom score of 7 or greater) estimated to occur in 33% in men in their sixth decade of life and 46% in men in their eighth decade of life.10 Overall, the population of men at risk for these symptoms continues to rise. According to Census statistics the number of males 65 years and older is expected to increase from 17,292,000 (11.3% of the U.S. male population) in 2010 to 24,323,000 (14.4% of the U.S. male population) in 2020.11
From these numbers, we would expect an increasing number of visits to physicians for BPH related symptoms and diagnoses. Indeed, according to the Urologic Diseases of America (UDA) Project’s study on BPH in 2005, from 1994 to 2000 the number of outpatient visits for BPH increased from 10,116/100,000 to 14,473/100,000.2 With an increasing population at risk for symptoms, and a history suggestive of increasing use of physician resources for these symptoms, we expected to see an increase in initial visits to urologists over time in the current study. However, we found the number of new visits to urologists among men with BPH to be stable during our study period. Since BPH and LUTS represent up to 22% of initial consultations with urologists,12 factors contributing to this stabilization, and its impact on expenditures for initial BPH evaluation, merit examination.
BPH care may be shifting into the primary care setting. Indeed, our study period, 2000 to 2007, coincided with several studies, including the Medical Therapy of Prostatic Symptoms (MTOPS) study, elucidating the effectiveness of medical therapy with 5-alpha reductase inhibitors and alpha-blockers for symptomatic BPH.13 Given the long time for clinical trial findings to make their way into practice,14, 15 findings of successful management of BPH symptoms with alpha blockers and 5-ARIs from the 1990s and early 2000s may only have been translated into clinical practice during our study period.16 Indeed, other authors have found primary care physicians are increasingly likely to prescribe medical therapy for BPH symptoms.17
As BPH patients are treated in the primary care setting, patients who present for evaluation by urologists may have increased need for evaluative care tests. These evaluations fall into the optional and not-recommended categories of the 2003 AUA best practice guidelines,1 and continue to be considered optional care in the 2010 AUA best practice guidelines and similar European Association of Urology guidelines.18, 19 While the total increase in BPH related evaluative care test expenditures was 35% from 2000 to 2007, use of optional care increased 65% over this period. Some patients may receive optional testing due to symptoms refractory to medical management. Others may receive optional care prior to initiation of anticholinergic therapy.20–22
Other increased expenditures in the work up for BPH patients might not be attributable to changes in patient complexity. Some changes, such as increasing use of serum creatinine measurements and upper tract imaging may reflect background changes in medical care. Serum creatinine measurements are a common part of many primary care physicians work up, and might not be reflective of BPH considerations. Overall use of CT scanning has exploded from the 1990s to present, with over 62 million CT scans obtained in the United States in 2006.23 With the increased use of imaging as the largest driving factor in expenditures among BPH patients, opportunities exist for further bending of the cost curve in BPH without compromising the quality of care provided to patients. This is particularly important in the setting of a recent report by the Government Accountability Office (GAO) describing the Medicare program as “unsustainable” in the long term.24
Potential limitations of the study need to be considered. We focused on an elderly cohort of patients treated by fee-for service Medicare, so our results may not be applicable to younger patients. Using administrative data, we could not determine the severity of patient’s symptoms. Thus, we are not able to assess if changing expenditures are a result of changes in the severity of patient’s symptoms, and our discussion of such possibilities remains speculative. Due to lack of availability of Medicare Part-D data for the period under study, we were not able to assess expenditures related to treatment of BPH. Finally our study is limited by uncertainty of how to classify serum creatinine measurements the initial workup of BPH. Serum creatinine had been recommended in the AUA guidelines prior to 2003, and may be part of routine checks by primary care physicians. Due to these considerations, we considered serum creatinine in an individual subcategory.
Conclusions
Despite an increasing patient population at risk for BPH, the number of initial BPH evaluations by urologists was stable from 2000 to 2007, suggesting increased treatment of BPH in primary care settings. During this time period, expenditures on BPH related evaluations increased. This growth was slower than overall growth in Medicare expenditures, and increases in imaging expenditures in men seeing urologists for BPH were restrained compared to the Medicare program as a whole.
Key Definitions for Abbreviations
- BPH
Benign Prostatic Hyperplasia
- AUA
American Urological Association
- LUTS
Lower Urinary Tract Symptoms
- ICD-9
International Classification of Disease Ninth Edition
- HCPCS
Healthcare Common Procedure Coding System
Footnotes
Publisher's Disclaimer: This is a PDF file of an unedited manuscript that has been accepted for publication. As a service to our customers we are providing this early version of the manuscript. The manuscript will undergo copyediting, typesetting, and review of the resulting proof before it is published in its final citable form. Please note that during the production process errors may be discovered which could affect the content, and all legal disclaimers that apply to the journal pertain.
References
- 1.Roehrborn C, McConnell J, Barry M. American Urological Association Guideline on the Management of Benign Prostatic Hyperplasia (BPH) American Urological Association; 2003. [Google Scholar]
- 2.Wei JT, Calhoun E, Jacobsen SJ. Urologic diseases in America project: benign prostatic hyperplasia. J Urol. 2005;173:1256. doi: 10.1097/01.ju.0000155709.37840.fe. [DOI] [PubMed] [Google Scholar]
- 3.Warren JL, Klabunde CN, Schrag D, et al. Overview of the SEER-Medicare data: content, research applications, and generalizability to the United States elderly population. Med Care. 2002;40:IV. doi: 10.1097/01.MLR.0000020942.47004.03. [DOI] [PubMed] [Google Scholar]
- 4.Geithner T, Solis H, Sebelius K, et al. D. o. H. a. H. Services, editor. ANNUAL REPORT OF THE BOARDS OF TRUSTEES OF THE FEDERAL HOSPITAL INSURANCE AND FEDERAL SUPPLEMENTARY MEDICAL INSURANCE TRUST FUNDS. Washington, DC: 2011. [Google Scholar]
- 5.Strope SA, Elliott SP, Smith A, et al. Urologist practice styles in the initial evaluation of elderly men with benign prostatic hyperplasia. Urology. 2011;77:535. doi: 10.1016/j.urology.2010.07.485. [DOI] [PMC free article] [PubMed] [Google Scholar]
- 6.Strope SA, Elliott SP, Saigal CS, et al. Urologist Compliance With AUA Best Practice Guidelines for Benign Prostatic Hyperplasia in Medicare Population. Urology. 2011;78:3. doi: 10.1016/j.urology.2010.12.087. [DOI] [PMC free article] [PubMed] [Google Scholar]
- 7.Services, U. S. D. o. H. a. H. R. C. f. M. a. M. Historical National Health Expenditure Data. 2010. [Google Scholar]
- 8.Office, U. S. G. A. Medicare Part B Imaging Services: Rapid Spending Growth and Shift and Shift to Physician Offices Indicate Need for CMS to Consider Additional Management Practices. 2006. [Google Scholar]
- 9.AUA guideline on management of benign prostatic hyperplasia (2003). Chapter 1: Diagnosis and treatment recommendations. J Urol. 2003;170:530. doi: 10.1097/01.ju.0000078083.38675.79. [DOI] [PubMed] [Google Scholar]
- 10.Jacobsen SJ, Jacobson DJ, Girman CJ, et al. Treatment for benign prostatic hyperplasia among community dwelling men: the Olmsted County study of urinary symptoms and health status. J Urol. 1999;162:1301. [PubMed] [Google Scholar]
- 11.Bureau, U. S. C. Projections of the Population and Components of Change for the United States: 2010 to 2050. 2010. [Google Scholar]
- 12.Nickel JC, Downey J, Benard F, et al. The Canadian Benign Prostatic Hyperplasia Audit Study (CanBas) Can Urol Assoc J. 2008;2:367. doi: 10.5489/cuaj.629. [DOI] [PMC free article] [PubMed] [Google Scholar]
- 13.McConnell JD, Roehrborn CG, Bautista OM, et al. The long-term effect of doxazosin, finasteride, and combination therapy on the clinical progression of benign prostatic hyperplasia. N Engl J Med. 2003;349:2387. doi: 10.1056/NEJMoa030656. [DOI] [PubMed] [Google Scholar]
- 14.McGlynn EA, Asch SM, Adams J, et al. The quality of health care delivered to adults in the United States. N Engl J Med. 2003;348:2635. doi: 10.1056/NEJMsa022615. [DOI] [PubMed] [Google Scholar]
- 15.Borden WB, Redberg RF, Mushlin AI, et al. Patterns and intensity of medical therapy in patients undergoing percutaneous coronary intervention. JAMA. 2011;305:1882. doi: 10.1001/jama.2011.601. [DOI] [PubMed] [Google Scholar]
- 16.Burnett AL, Wein AJ. Benign prostatic hyperplasia in primary care: what you need to know. J Urol. 2006;175:S19. doi: 10.1016/S0022-5347(05)00310-1. [DOI] [PubMed] [Google Scholar]
- 17.Hollingsworth JM, Hollenbeck BK, Daignault S, et al. Differences in initial benign prostatic hyperplasia management between primary care physicians and urologists. J Urol. 2009;182:2410. doi: 10.1016/j.juro.2009.07.029. [DOI] [PubMed] [Google Scholar]
- 18.Madersbacher S, Alivizatos G, Nordling J, et al. EAU 2004 guidelines on assessment, therapy and follow-up of men with lower urinary tract symptoms suggestive of benign prostatic obstruction (BPH guidelines) Eur Urol. 2004;46:547. doi: 10.1016/j.eururo.2004.07.016. [DOI] [PubMed] [Google Scholar]
- 19.McVary KT, Roehrborn CG, Avins AL, et al. Update on AUA guideline on the management of benign prostatic hyperplasia. J Urol. 2011;185:1793. doi: 10.1016/j.juro.2011.01.074. [DOI] [PubMed] [Google Scholar]
- 20.Kaplan SA, Walmsley K, Te AE. Tolterodine extended release attenuates lower urinary tract symptoms in men with benign prostatic hyperplasia. J Urol. 2005;174:2273. doi: 10.1097/01.ju.0000181823.33224.a0. [DOI] [PubMed] [Google Scholar]
- 21.Roehrborn CG, Kaplan SA, Kraus SR, et al. Effects of serum PSA on efficacy of tolterodine extended release with or without tamsulosin in men with LUTS, including OAB. Urology. 2008;72:1061. doi: 10.1016/j.urology.2008.06.067. [DOI] [PubMed] [Google Scholar]
- 22.Kaplan SA, Roehrborn CG, Rovner ES, et al. Tolterodine and tamsulosin for treatment of men with lower urinary tract symptoms and overactive bladder: a randomized controlled trial. JAMA. 2006;296:2319. doi: 10.1001/jama.296.19.2319. [DOI] [PubMed] [Google Scholar]
- 23.Brenner DJ, Hall EJ. Computed tomography--an increasing source of radiation exposure. N Engl J Med. 2007;357:2277. doi: 10.1056/NEJMra072149. [DOI] [PubMed] [Google Scholar]
- 24.King K. In: Medicare Program Remains at Risk Because of Continuing Management Challenges. Office GA, editor. Washington, DC: 2011. [Google Scholar]


