

Abstract
Background
Chronic kidney disease-mineral bone disorder (CKD-MBD) is a systemic syndrome characterized by imbalances in mineral homeostasis, renal osteodystrophy (ROD) and ectopic calcification. The mechanisms underlying this syndrome in individuals with chronic kidney disease (CKD) are not yet clear.
Methods
We examined the effect of normal phosphate (NP) or high phosphate (HP) feeding in the setting of CKD on bone pathology, serum biochemistry and vascular calcification in calcification-prone dilute brown non-agouti (DBA/2) mice.
Results
In both NP and HP-fed CKD mice, elevated serum parathyroid hormone and alkaline phosphatase (ALP) levels were observed, but serum phosphorus levels were equivalent compared with sham controls. CKD mice on NP diet showed trabecular alterations in the long bone consistent with high–turnover ROD, including increased trabecular number with abundant osteoblasts and osteoclasts. Despite trabecular bone and serum biochemical changes, CKD/NP mice did not develop vascular calcification. In contrast, CKD/HP mice developed arterial medial calcification (AMC), more severe trabecular bone alterations and cortical bone abnormalities that included decreased cortical thickness and density, and increased cortical porosity. Cortical bone porosity and trabecular number strongly correlated with the degree of aortic calcification.
Conclusions
HP feeding was required to induce the full spectrum of CKD-MBD symptoms in CKD mice.
Keywords: chronic kidney disease-mineral bone disorder, high-turnover renal osteodystrophy, phosphate, vascular calcification
Introduction
The term chronic kidney disease-mineral bone disorder (CKD-MBD) is a term coined by the Kidney Disease Improving Global Outcomes Foundation [1] to describe the complex syndrome of mineral dysmetabolism, renal osteodystrophy (ROD) and extra-skeletal calcification that is unique to CKD. Recognition of this phenomenon is important due to the association between disturbances in mineral and bone metabolism and the increased risk of cardiovascular calcification and mortality [2]. Indeed, cardiovascular disease remains the leading cause of death in the CKD population [3], likely related to the high prevalence of vascular calcification in these patients. Calcification in the intimal compartment of the blood vessel is associated with stenotic atherosclerotic disease, whereas calcification of the medial layer is associated with non-stenotic arteriosclerotic disease. The latter pathology is particularly common in CKD patients and is one of the earliest vascular changes observed in pediatric dialysis patients before any signs of atherosclerotic disease are manifested [4].
At one end of the ROD spectrum, high-turnover disease (osteitis fibrosa) is characterized by high rates of bone resorption (increased osteoclastic activity alongside poorly differentiated osteoblast precursors) in the setting of secondary hyperparathyroidism. There is net bone resorption, fibrosis of the marrow space and release of calcium/phosphate into the circulation [5]. In contrast, adynamic bone disease is characterized by quiescent osteoblasts and osteoclasts with low bone turnover, with the resultant inability of the bone to buffer excess circulating calcium/phosphate [6]. This abnormality appears to be related to 1.25-dihydroxyvitamin D deficiency since it occurs in individuals with relatively normal or low parathyroid hormone (PTH) levels [7]. The most prevalent form of ROD in CKD patients is high-turnover disease; the frequency of adynamic ROD increases in dialysis patients though the prevalence is highly variable, and a minority of patients show a combination of the two (mixed type) [8]. In all cases, ROD contributes to the increased prevalence of osteopenia and osteoporosis observed in dialysis patients [9], and potentially contributes to other complications observed in these individuals.
One major perpetrator of CKD-MBD is disordered phosphate homeostasis [10]. Normal serum phosphorus levels are maintained early in CKD, at the cost of higher fibroblast growth factor-23 (FGF23) and PTH levels [10, 11], which lead to increased bone resorption and prevent the skeleton from acting as a phosphate reservoir. Hyperphosphatemia emerges late in CKD stage 4 and can directly induce heterotopic mineralization of the vasculature [12]. Indeed, hyperphosphatemia has been associated with higher risk of cardiovascular events and mortality in CKD [13, 14], and although no study has directly shown that lowering serum phosphorus to a specific threshold prevents or ameliorates vascular calcification, some clinical trials found that the use of noncalcium-based versus calcium-based phosphate binders attenuated vascular calcification in dialysis patients [15–17]. Given the myriad of pathogenetic factors in ROD [10] and uremic vascular calcification [18], in vivo models are essential to confirm the mechanistic link between phosphate excess and these end-organ diseases.
We previously described a mouse model of robust arterial medial calcification (AMC) in the setting of CKD and high phosphate (HP) feeding [19, 20]. In this model, AMC develops in CKD mice fed an HP diet, but not in CKD mice fed a normal phosphate (NP) diet. In addition, AMC in CKD mice correlated with the degree of renal insufficiency and with serum FGF23 levels. Thus, both severity of CKD and phosphate burden were important determinants of AMC, similar to the findings in CKD patients [21, 22]. The goals of the present study were (i) to determine the role of HP feeding in severity of ROD and (ii) to examine the relationship between phosphate loading, ROD and vascular calcification. Our findings show that an HP diet can promote high-turnover bone disease, in addition to AMC, in CKD mice.
Methods
Animals and diets
Female dilute brown non-agouti (DBA/2) mice were purchased from Charles River Laboratories (Wilmington, MA) and Harlan Laboratories (Indianapolis, IN) and maintained in a specific pathogen-free environment in compliance with the NIH guide for the Care and Use of Laboratory Animals. HP and NP diets were purchased from Dyets Inc. (Bethlehem, PA). The HP diet contained 0.9% phosphate and the NP diet contained 0.5% phosphate; both the diets contained 0.6% calcium. The University of Washington Animal Care Committee approved the study protocol.
Surgical procedure
CKD was induced in 18-week-old mice following the two-step surgical procedure for partial renal ablation described by Gagnon and Gallimore [23]. Briefly, during surgery 1, the right kidney was exposed, decapsulated and partially electrocauterized. Following a two-week recovery period, left total nephrectomy was performed (surgery 2). Control mice underwent sham surgeries in which dorsal incisions were made and the kidneys were surfaced then reinserted into the abdominal cavity. At 72 h post-surgery 2, mice were put on either the NP or the HP diets. At termination (after 12 weeks on the diet), aortas were collected for calcium quantitation and histological analysis. Femurs were collected for micro- computed tomography (micro-CT) and histological analysis. There were no premature deaths during the study.
Study groups
(i) Sham/NP: sham-operated mice fed the NP diet, (ii) Sham/HP: sham-operated mice fed the HP diet, (iii) CKD/NP: CKD mice fed the NP diet and (iv) CKD/HP: CKD mice fed the HP diet.
Serum chemistries
Saphenous blood was collected 1 week prior to termination. Serum levels of blood urea nitrogen (BUN), phosphorus, calcium and alkaline phosphatase (ALP) were analyzed by standard autoanalyzer methods performed at Phoenix Central Laboratory (Everett, WA). Serum PTH levels were determined using mouse-intact PTH-ALPCO ELISA (ALPCO, Salem, NH).
Quantitative biochemical analysis of aortic calcium
Dissected thoracic and abdominal aortic tissues were frozen, lyophilized and decalcified with 0.6N HCl at 37°C for 24 h. The calcium content of the supernatant was determined colorimetrically with the o-cresolphthalein complexone reagent using the TECO calcium diagnostic kit (TECO Diagnostics, Anaheim, CA) as previously described [24]. Aortic calcium content was expressed as microgram calcium/milligram dry weight.
Histological analysis of aortic vessels and hearts
Abdominal aortas were fixed in methyl Carnoy's fixative (3:1 methanol:acetic acid) overnight, then stored in 70% ethanol. Tissues were embedded in paraffin using an automated tissue processor, and 5 µm sections were prepared. Alizarin Red (0.5%, pH 9.0; Sigma-Aldrich) staining was used to detect calcification. Archived heart tissue from a separate experiment were available for the Sham/NP and CKD/HP groups, and these were also processed for Alizarin Red staining.
Quantitative analysis of long bones using micro-CT
A minimum of four mice per group underwent micro-CT analysis. Dissected femurs were preserved in RNA Stabilization Reagent (RNAlater; Qiagen Inc., Valencia, CA) and wrapped in Parafilm during scanning to prevent drying. Femurs were scanned using a 1076 SkyScan microCT desktop scanner (SkyScan, Kontich, Belgium) and subsequently reconstructed and analyzed with the packaged NRecon and CTAn software. The X-ray source was operated at 50 kV/200 μA with a 0.5 mm Al filter. Images were acquired at a 9 µm resolution with a 1.2° rotational step. Scans were reconstructed with 20% beam hardening and ring correction factor of 6. From the reconstructed datasets, both a trabecular and cortical volume of interest (VOI) was defined for each femur. Morphometrics and densities were calculated for trabecular and cortical regions. The details of VOI and density measurements are available under the Supplementary Methods.
Histological analysis of femurs
Femurs were immersed in Bouin's fixative and kept overnight at room temperature. For demineralization, femurs were dissected from the surrounding tissues and kept in AFS solution (acetic acid, neutral buffered formalin and sodium chloride) for 3 weeks. Tissues were processed and embedded in paraffin. Six micron longitudinal sections of the femur were obtained and stained with hematoxylin and eosin (H&E) as previously described [25]. Images were captured on a Nikon Eclipse E400 microscope camera system.
Statistical analysis
Statistical analyses were performed using the Stat View statistical software (SAS Institute, Cary, NC). Group means and variances were determined using analysis of variance, and the values are presented as means ± SEM. Post-hoc, pair-wise comparisons of group means were performed using Fisher's protected least significant difference analysis, and simple linear regression was used to obtain correlation coefficients between two parameters. Significance for all tests was set at P< 0.05.
Results
Arterial medial calcification and serum parameters
Figure 1A shows that CKD mice fed the HP diet (CKD/HP) developed significant aortic calcification (19.45 ± 10.43 µg/mg dry weight), while CKD/NP-fed mice and sham controls did not (0.84 ± 0.2 µg/mg for the CKD/NP mice, 0.63 ± 0.13 µg/mg for the sham/NP mice). In the CKD/HP group, 2/4 mice showed a severe degree of calcification (individual values for abdominal aortic calcium content were as follows: 2.91, 3.05, 21.82 and 47.98 µg/mg). Calcification was restricted to the tunica media with no evidence of intimal atherosclerotic lesions (Figure 1B).
Fig. 1.
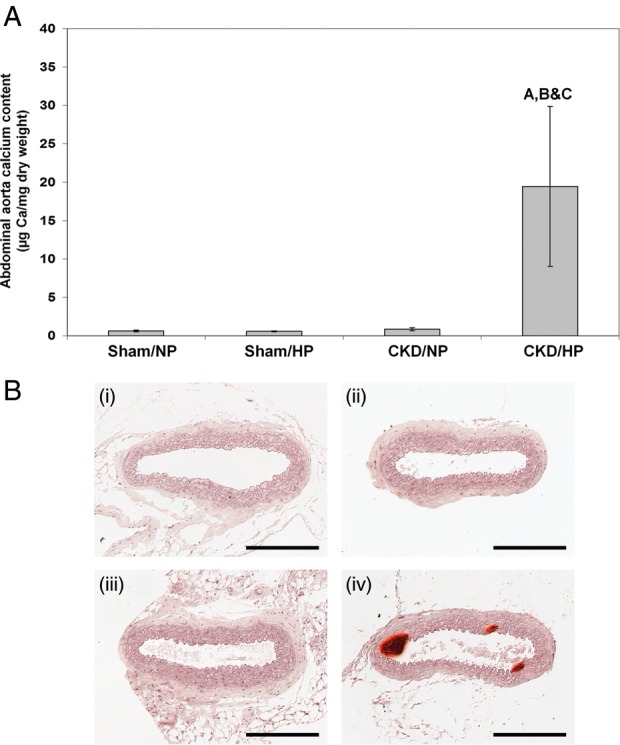
(A) Aortic calcium content in CKD mice and sham controls under normal and HP feeding conditions. Bars represent mean ± SEM. Letters above the graph denote significance (P< 0.01), A compared with the sham/NP group; B compared with the sham/HP group; C compared with the CKD/NP group. Sham/NP n= 5; sham/HP n= 6; CKD/NP n= 6; CKD/HP n= 4. (B) Representative micrographs of Alizarin Red-stained sections of the abdominal aorta from each group (scale bar = 200 μm). (i) Sham/NP, (ii) sham/HP, (iii) CKD/NP, (iv) CKD/HP. Mineralization of the tunica media was observed only in the CKD/HP group (iv).
Serum parameters are summarized in Table 1. There were no significant differences in serum phosphorus or calcium levels between the CKD/HP group and the CKD/NP group (Table 1). On the other hand, there was a significant increase in serum PTH levels in the CKD/HP group compared with the CKD/NP group, and the values in these groups were both significantly higher than in sham controls. Serum ALP, a marker of bone remodeling, was significantly elevated in both CKD/NP and CKD/HP mice compared with sham mice.
Table 1.
Serum parameters and body weights in CKD mice and sham controls under NP and HP feeding conditions
| Study groups | n | Body weight (g) | BUN (mg/dL) | Pi (mg/dL) | Ca (mg/dL) | PTH (pg/mL) | ALP (U/Liter) |
|---|---|---|---|---|---|---|---|
| Sham/NP | 5 | 26.2 ± 0.7 | 22.4 ± 1.0 | 9.1 ± 0.8 | 10.5 ± 0.2 | 59.9 ± 8.3 | 58.4 ± 6.5 |
| Sham/HP | 6 | 27.8 ± 1.0 | 21.3 ± 0.8 | 10.1 ± 0.6 | 10.7 ± 0.1 | 80.6 ± 15.2 | 50.0 ± 12.9 |
| CKD/NP | 6 | 23.1 ± 0.5a,b | 70.0 ± 4.2a,b | 10.2 ± 0.4 | 11.7 ± 0.2a,b | 283.8 ± 46.6a,b | 146.7 ± 37.7a,b |
| CKD/HP | 4 | 21.8 ± 0.8a,b | 49.0 ± 3.4a,b,c | 9.7 ± 0.4 | 10.5 ± 0.2c | 428.6 ± 39.5a,b,c | 141.0 ± 19.4a,b |
CKD, chronic kidney disease; NP, normal 0.5% phosphate diet; HP, high 0.9% phosphate diet; BUN, blood urea nitrogen; Pi, phosphorus; Ca, calcium; PTH, parathyroid hormone; ALP, alkaline phosphatase.
aThere is a statistically significant difference compared with the sham/NP group (P< 0.05).
bThere is a statistically significant difference compared with the sham/HP group (P< 0.05).
cThere is a statistically significant difference compared with the CKD/NP group (P< 0.05).
Myocardial calcification
The DBA/2 strain is genetically susceptible to age-related dystrophic cardiac calcinosis [26, 27] and can develop calcifications in both the epicardium and myocardium [28]. There is a lower tendency for intratubular calcific casts in the kidney, and pulmonary calcification has not been noted on this strain [28]. We found speckles of myocardial calcification in the hearts of sham/NP mice, while CKD/HP mice showed denser and larger areas of calcification on Alizarin Red staining (Supplementary Figure S1).
Micro-CT characterization of bone abnormalities in CKD mice
Representative longitudinal, cross-sectional and sagittal tomographic images of femurs from each experimental group are shown in Figure 2. Quantitative morphological parameters for trabecular and cortical bone derived from these reconstructions are shown in Figure 3. As shown in Figure 3A, an increase in trabecular number was found in both the CKD groups (1.88 ± 0.55 per mm for the CKD/HP group; 0.72 ± 0.11 per mm for the CKD/NP group) compared with the sham groups (0.31 ± 0.02 per mm for the sham/NP group; 0.12 ± 0.02 per mm for the sham/HP group). While the trabecular number was significantly higher in CKD/HP mice compared with CKD/NP mice, HP feeding alone did not alter trabecular number in sham mice. There was also an increase in trabecular mineral density for the CKD/NP (0.21 ± 0.05 g/cm3) and CKD/HP (0.21 ± 0.09 g/cm3) groups compared with sham controls (0.18 ± 0.00 g/cm3 for sham/NP and 0.16 ± 0.01 g/cm3 for sham/HP) as shown in Figure 3B. Trabecular separation was significantly decreased in the CKD samples when compared with sham controls (Figure 3C): CKD/HP values (0.31 ± 0.04 mm) were significantly lower than sham/NP (0.48 ± 0.04 mm) and sham/HP (0.58 ± 0.05 mm), while CKD/NP values (0.38 ± 0.02 mm) were only significantly lower than sham/HP. Trabecular thickness, however, was unaffected by CKD or type of phosphate diet, as no significant difference was seen between the four study groups (Figure 3D).
Fig. 2.

Representative femur micro-CT sections from each group. (A) Longitudinal sections of the femurs; (B) cross-sectional sections in the diaphysis of the femurs and (C) sagittal sections in the epiphysis of the femurs.
Fig. 3.

Femur morphometrics based on micro-CT analysis. (A) Trabecular number (per mm), (B) trabecular bone density (g/cm3), (C) trabecular separation (mm), (D) trabecular thickness (mm), (E) cortical porosity (%), and (F) cortical thickness (mm), (G) ortical bone density (g/cm3), (H) Cortical BV/TV, %. (I) Cortical cross-sectional area (mm2). Bars represent mean ± SEM. Letters above the graph denote significance (P< 0.05), A compared with the sham/NP group; B compared with the sham/HP group; C compared with the CKD/NP group. Sham/NP n= 5; sham/HP n= 5; CKD/NP n= 6; CKD/HP n= 4.
In contrast to trabecular bone where abnormalities were evident in both CKD/NP and CKD/HP groups, significant cortical bone abnormalities were observed only in the CKD/HP group. As shown in Figure 3E, there was a significant increase in cortical bone porosity in the CKD/HP group (0.36 ± 0.16%) compared with the CKD/NP group (0.14 ± 0.09%) or the sham controls (0.09 ± 0.00% for sham/NP and 0.10 ± 0.01% for sham/HP). Other significant changes in the cortical bone of CKD/HP femurs included a reduction in cortical thickness (Figure 3F) and density (Figure 3G). In terms of cortical thickness, this measurement was significantly reduced in CKD/HP femurs (0.22 ± 0.00 mm) compared with CKD/NP (0.25 ± 0.02 mm), sham/NP (0.27 ± 0.00 mm) and sham/HP (0.25 ± 0.02 mm). Cortical mineral density of CKD/HP femurs (1.11 ± 0.01 g/cm3) was also significantly decreased compared with sham/NP (1.21 ± 0.01 g/cm3) and sham/HP (1.19 ± 0.03 g/cm3), but was not significantly different from CKD/NP (1.16 ± 0.03 g/cm3) as shown in Figure 3G.
Cortical bone volume to tissue volume (BV/TV) ratios were significantly reduced in the CKD/HP femurs (56.78 ± 0.57%) compared with CKD/NP (64.88 ± 1.31%) and sham controls (sham/NP 68.50 ± 0.88% and sham/HP 64.24 ± 1.29%) as shown in Figure 3H. There was, however, no significant difference in the cortical bone area (Figure 3I).
Linear regression analysis of micro-CT measurements and aortic calcification
Measurements from all four experimental groups were used for regression analysis. There was a statistically significant positive correlation between cortical bone porosity and abdominal aorta calcium content (R= 0.83, P< 0.001). Similarly, there was a positive correlation between trabecular number and aortic calcium content (R= 0.85, P< 0.001). Cortical BV/TV (R= 0.49, P< 0.05) and trabecular separation (R= 0.52, P< 0.05) showed inverse correlations with aortic calcification.
Histologic characterization of bone abnormalities in CKD mice
Histological examination of long bones of mice in the CKD/HP group suggested changes consistent with high-turnover bone disease (osteitis fibrosa), as previously described in other rodent CKD models [5, 29–32]. As shown in Figure 4, bone marrow spaces in CKD/HP mice showed increased numbers of trabeculae, as well as peritrabecular/intertrabecular fibrosis, compared with sham/NP controls. There appeared to be more numerous osteoblasts and increased matrix deposition on trabecular surfaces, as well as greater numbers of osteoclast-like cells associated with scalloped trabecular surfaces compared with sham/NP. The marrow compartment was not obviously different between the sham/NP and sham/HP samples, while CKD/NP showed evidence of increased remodeling (e.g. increased trabecular osteoblasts) that was not as striking as in the CKD/HP group. However, bone labeling was not done in our study, and therefore we could not precisely quantify bone-turnover rates.
Fig. 4.

Representative micrographs of H&E stained sections of femurs from each group. (A–D) Longitudinal femur sections. (E–H) Diaphyseal cortical bone sections. Note the dramatic decrease in cortical bone width, altered lamellar organization and the presence of trabecular protrusions into the marrow cavity (blue arrows) in the CKD/HP group compared with the CKD/NP group. Also, note the dramatic increase in cortical porosity in the CKD/HP group (asterisk). (I–L) Trabecular bone and marrow sections. The CKD/NP group showed increased trabeculae and increased osteoblast numbers on trabecular surfaces, while the CKD/HP group exhibited more dramatic remodeling such as increased trabeculae, increased osteoblasts and mineralization on trabecular surfaces, and numerous osteoclasts associated with scalloped trabecular surfaces (black arrowheads). Note that bone labeling studies were not done, therefore we could not precisely quantify bone-turnover rates.
Discussion
We describe a mouse CKD model whereby dietary phosphate loading induced a spectrum of vascular and bone abnormalities. CKD mice on a HP diet manifested (i) robust AMC; (ii) increased trabecular bone remodeling with increased number of trabeculae, increased mineralization and fibrosis and (iii) increased cortical bone remodeling with increased porosity and decreased mineralization. In contrast, CKD mice on a NP diet showed abnormal trabecular bone remodeling but did not develop vascular calcification or cortical bone abnormalities. In sham controls, HP diet did not induce vascular or bone changes. Bone micro-CT measurements such as cortical porosity and trabecular number strongly correlated with the degree of aortic calcification.
This is the first report of a mouse CKD-MBD model that associates HP intake with AMC and high-turnover ROD. High-turnover ROD has also been described in NP-fed CKD mice on the C57BL/6 background [5] but this strain is resistant to vascular calcification even after HP feeding (Giachelli unpublished data and reference [33]), and thus cannot be used to study the whole spectrum of CKD-MBD. AMC and high-turnover ROD have also been reported in rat CKD-MBD models, such as the adenine model [31, 32, 34] and the Cy/+ model [30]. Of note, in an adenine rat CKD model, cortical but not trabecular bone loss significantly correlated with onset of aortic medial calcification [34], similar to our present findings. However, ours remains the only rodent CKD model whereby dietary phosphate loading can induce the full spectrum of ectopic calcification and ROD.
Aortic calcification occurred in the CKD/HP mice despite maintenance of ‘normal’ serum phosphorus levels, which belied whole-body phosphate excess due to continued dietary loading. We previously described changes in serum chemistry over time within this CKD model whereby hyperphosphatemia is manifested at weeks 1–5 following initiation of HP diet, and serum phosphorus levels normalize by week 7 [20]. There are several likely mechanisms underlying these ‘normal’ serum levels: (i) phosphate is incorporated into the skeleton as part of disordered bone remodeling, (ii) the vascular system and other soft tissues act as ‘sinks’ for excess phosphate, thereby perpetuating ectopic calcification and (iii) renal phosphate excretion is upregulated. Indeed, we have noted dramatically elevated FGF23 levels in CKD/HP mice that corresponded with increased urinary phosphate excretion, and the increased FGF23 levels also strongly correlated with aortic calcification [19]. FGF23 in this setting appears to serve as a marker for ongoing phosphate loading, as FGF23 has no effect on vascular smooth muscle cell calcification in vitro (Giachelli unpublished data). Elevated PTH level also induces phosphate excretion [35, 36] and stimulates secretion of FGF23 via increased production of 1,25-dihydroxyvitamin D3 [37]. Despite its phosphaturic actions, elevated PTH may contribute to extra-skeletal mineralization by accelerating bone resorption which blocks the normal buffering capacity of the bone. Elevated PTH is thought to increase osteoclastogenesis via upregulation of receptor activator of nuclear factor-kappa B ligand and decreased expression of osteoprotegerin (OPG) in osteoblasts [38]. PTH can also stimulate marrow fibrosis by fibroblast-like preosteoblast cells [5, 39]. Supporting the bone–vascular association is a study demonstrating decreased coronary and carotid artery calcification in dialysis patients after subtotal parathyroidectomy [40]. Also, in rat models of arterial calcification, agents that inhibit bone resorption such as OPG [41] and bisphosphonates [42, 43] have been shown to decrease vascular calcification. However, these studies have to be interpreted with caution since these drugs may have direct anti-calcification effects on the vessel wall [43, 44].
The influence of dietary phosphate on soft tissue calcification in healthy DBA/2 mice was previously described, whereby a 0.8% phosphate diet was noted to accelerate calcification of the heart, kidney and tongue [45]. It is important to note that both CKD and HP feeding are required for the development of vascular calcification, as demonstrated in the current study and prior reports [19, 20], suggesting a central role for the CKD milieu that extends beyond mouse strain susceptibility. Normal vasculature has built-in defense mechanisms consisting of locally made (osteopontin, matrix Gla protein and pyrophosphate) and circulating (fetuin-A) inhibitors of calcification [46]. These inhibitors are decreased or dysfunctional in CKD, and disordered calcium/phosphate metabolism further tips the balance in favor of calcification. Thus, this mouse CKD model is relevant for examining the direct link between dietary phosphate loading, AMC and ROD.
It is interesting to note that bone changes may be dissimilar among bones from different locations, within the same CKD-MBD model. We previously characterized mandibular and alveolar bone abnormalities in this CKD mouse model, whereby CKD mice showed the same trabecular and cortical bone pathology (increased trabecular thickness and mineralization, reduced cortical thickness) irrespective of dietary phosphate content [25]. Therefore, HP feeding was not required to induce cortical disease in the dentoalveolar complex. The increased susceptibility for mandibular bone pathology in CKD (when compared with long-bone disease) may be partly due to inherent differences between cells in the craniofacial versus axial and appendicular skeletal units [47, 48]. Mandibular bone in general, and alveolar bone in particular, has a higher turnover rate than some other skeletal sites [49, 50] and thus may respond more rapidly to metabolic changes affecting mineralized tissues.
Both cortical and trabecular bone integrity are important in terms of fracture risk in long bones. Biochemical testing and stress loading of human cadaveric femurs found equivalent contributions from cortical and trabecular bone to overall bone strength [51, 52]. Thus, our findings suggest that, in the setting of CKD and phosphate overload where both trabecular and cortical bone structures are compromised, a much greater fracture risk exists.
In summary, our data strongly support efforts to regulate dietary phosphate intake in the CKD population, and highlights the need for clinical trials to study the impact of dietary phosphate intervention on mineral bone disorder outcomes. In addition, femur quantitative CT measurements such as cortical bone porosity strongly correlated with the degree of aortic calcification, suggesting that long-bone CT may be a useful non-invasive tool for assessing vascular calcification risk in CKD.
Supplementary data
Supplementary data are available online at http://ndt.oxfordjournals.org.
Funding
This research was supported by NIH grants HL62329 and HL081785 to C.M.G. and NIH grant DE15109 to M.J.S.. W.L.L. received funding from T32 HL007828 and T32 DK007467. Studies were performed while B.L.F. and M.J.S. were affiliated with the University of Washington School of Dentistry, Department of Periodontics (Seattle, WA).
Supplementary Material
Acknowledgements
The authors would like to thank Dr Mohga El-Abbadi and Ms Krystle Quan for technical assistance, and Dr Timothy Cox for access to the Small Animal Tomographic Analysis Facility in the Department of Pediatrics, University of Washington School of Medicine, Seattle, WA.
Conflict of interest statement None declared.
References
- 1.Moe S, Drüeke T, Cunningham J, et al. Definition, evaluation, and classification of renal osteodystrophy: a position statement from kidney disease: improving klobal outcomes (KDIGO) Kidney Int. 2006;69:1945–1953. doi: 10.1038/sj.ki.5000414. [DOI] [PubMed] [Google Scholar]
- 2.Block G, Cunningham J. Morbidity and mortality associated with abnormalities in bone and mineral metabolism in CKD. In: Olgaard K, editor. Clinical Guide to the Basics of Bone and Mineral Metabolism in CKD. New York: National Kidney Foundation; 2006. pp. 77–92. [Google Scholar]
- 3.Tonelli M, Wiebe N, Culleton B, et al. Chronic kidney disease and mortality risk: a systematic review. J Am Soc Nephrol. 2006;17:2034–2047. doi: 10.1681/ASN.2005101085. [DOI] [PubMed] [Google Scholar]
- 4.Shroff R, McNair R, Figg N, et al. Dialysis accelerates medial vascular calcification in part by triggering smooth muscle cell apoptosis. Circulation. 2008;118:1748–1757. doi: 10.1161/CIRCULATIONAHA.108.783738. [DOI] [PubMed] [Google Scholar]
- 5.González EA, Lund RJ, Martin KJ, et al. Treatment of a murine model of high-turnover renal osteodystrophy by exogenous BMP-7. Kidney Int. 2002;61:1322–1331. doi: 10.1046/j.1523-1755.2002.00258.x. [DOI] [PubMed] [Google Scholar]
- 6.Lund RJ, Davies MR, Brown AJ, et al. Successful treatment of an adynamic bone disorder with bone morphogenetic protein-7 in a renal ablation model. J Am Soc Nephrol. 2004;15:359–369. doi: 10.1097/01.asn.0000109671.99498.08. [DOI] [PubMed] [Google Scholar]
- 7.Hendy GN, Hruska KA, Mathew S, et al. New insights into mineral and skeletal regulation by active forms of vitamin D. Kidney Int. 2006;69:218–223. doi: 10.1038/sj.ki.5000091. [DOI] [PubMed] [Google Scholar]
- 8.Raggi P, Kleerekoper M. Contribution of bone and mineral abnormalities to cardiovascular disease in patients with chronic kidney disease. Clin J Am Soc Nephrol. 2008;3:836–843. doi: 10.2215/CJN.02910707. [DOI] [PubMed] [Google Scholar]
- 9.Stehman-Breen C. Osteoporosis and chronic kidney disease. Semin Nephrol. 2004;24:78–81. doi: 10.1053/j.semnephrol.2003.08.013. [DOI] [PubMed] [Google Scholar]
- 10.Hruska KA, Choi ET, Memon I, et al. Cardiovascular risk in chronic kidney disease (CKD): the CKD-mineral bone disorder (CKD-MBD) Pediatr Nephrol. 2010;25:769–778. doi: 10.1007/s00467-009-1337-0. [DOI] [PMC free article] [PubMed] [Google Scholar]
- 11.Isakova T, Wahl P, Vargas GS, et al. Fibroblast growth factor 23 is elevated before parathyroid hormone and phosphate in chronic kidney disease. Kidney Int. 2011;79:1370–1378. doi: 10.1038/ki.2011.47. [DOI] [PMC free article] [PubMed] [Google Scholar]
- 12.Lau WL. Direct effects of phosphate on vascular cell function. In: Pai A, Giachelli CM, editors. Advances in Chronic Kidney Disease. 2011. [DOI] [PMC free article] [PubMed] [Google Scholar]
- 13.Block G, Hulbert-Shearon T, Levin N, et al. Association of serum phosphorus and calcium x phosphate product with mortality risk in chronic hemodialysis patients: a national study. Am J Kidney Dis. 1998;31:607–617. doi: 10.1053/ajkd.1998.v31.pm9531176. [DOI] [PubMed] [Google Scholar]
- 14.Young E, Albert J, Satayathum S, et al. Predictors and consequences of altered mineral metabolism: the dialysis outcomes and practice patterns study. Kidney Int. 2005;67:1179–1187. doi: 10.1111/j.1523-1755.2005.00185.x. [DOI] [PubMed] [Google Scholar]
- 15.Chertow G, Burke S, Raggi P. Sevelamer attenuates the progression of coronary and aortic calcification in hemodialysis patients. Kidney Int. 2002;62:245–252. doi: 10.1046/j.1523-1755.2002.00434.x. [DOI] [PubMed] [Google Scholar]
- 16.Block G, Raggi P, Bellasi A, et al. Mortality effect of coronary calcification and phosphate binder choice in incident hemodialysis patients. Kidney Int. 2007;71:438–441. doi: 10.1038/sj.ki.5002059. [DOI] [PubMed] [Google Scholar]
- 17.Russo D, Miranda I, Ruocco C, et al. The progression of coronary artery calcification in predialysis patients on calcium carbonate or sevelamer. Kidney Int. 2007;72:1255–1261. doi: 10.1038/sj.ki.5002518. [DOI] [PubMed] [Google Scholar]
- 18.Giachelli C. The emerging role of phosphate in vascular calcification. Kidney Int. 2009;75:890–897. doi: 10.1038/ki.2008.644. [DOI] [PMC free article] [PubMed] [Google Scholar]
- 19.El-Abbadi MM, Pai AS, Leaf EM, et al. Phosphate feeding induces arterial medial calcification in uremic mice: role of serum phosphorus, fibroblast growth factor-23, and osteopontin. Kidney Int. 2009;75:1297–1307. doi: 10.1038/ki.2009.83. [DOI] [PMC free article] [PubMed] [Google Scholar]
- 20.Pai A, Leaf EM, El-Abbadi M, et al. Elastin degradation and vascular smooth muscle cell phenotype change precede cell loss and arterial medial calcification in a uremic mouse model of chronic kidney disease. Am J Pathol. 2011;178:764–773. doi: 10.1016/j.ajpath.2010.10.006. [DOI] [PMC free article] [PubMed] [Google Scholar]
- 21.Toussaint ND, Lau KK, Strauss BJ, et al. Associations between vascular calcification, arterial stiffness and bone mineral density in chronic kidney disease. Nephrol Dial Transplant. 2008;23:586–593. doi: 10.1093/ndt/gfm660. [DOI] [PubMed] [Google Scholar]
- 22.Oh J, Wunsch R, Turzer M, et al. Advanced coronary and carotid arteriopathy in young adults with childhood-onset chronic renal failure. Circulation. 2002;106:100–105. doi: 10.1161/01.cir.0000020222.63035.c0. [DOI] [PubMed] [Google Scholar]
- 23.Gagnon R, Gallimore B. Characterization of a mouse model of chronic uremia. Urol Res. 1988;16:119–126. doi: 10.1007/BF00261969. [DOI] [PubMed] [Google Scholar]
- 24.Wada T, McKee M, Steitz S, et al. Calcification of vascular smooth muscle cell cultures: inhibition by osteopontin. Circ Res. 1999;84:166–178. doi: 10.1161/01.res.84.2.166. [DOI] [PubMed] [Google Scholar]
- 25.Lee MM, Chu EY, El-Abbadi MM, et al. Characterization of mandibular bone in a mouse model of chronic kidney disease. J Periodontol. 2010;81:300–309. doi: 10.1902/jop.2009.090379. [DOI] [PMC free article] [PubMed] [Google Scholar]
- 26.Ivandic BT, Qiao JH, Machleder D, et al. A locus on chromosome 7 determines myocardial cell necrosis and calcification (dystrophic cardiac calcinosis) in mice. Proc Natl Acad Sci USA. 1996;93:5483–5488. doi: 10.1073/pnas.93.11.5483. [DOI] [PMC free article] [PubMed] [Google Scholar]
- 27.Ivandic BT, Utz HF, Kaczmarek PM, et al. New dyscalc loci for myocardial cell necrosis and calcification (dystrophic cardiac calcinosis) in mice. Physiol Genomics. 2001;6:137–144. doi: 10.1152/physiolgenomics.2001.6.3.137. [DOI] [PubMed] [Google Scholar]
- 28.Eaton GJ, Custer RP, Johnson FN, et al. Dystrophic cardiac calcinosis in mice: genetic, hormonal, and dietary influences. Am J Pathol. 1978;90:173–186. [PMC free article] [PubMed] [Google Scholar]
- 29.Nikolov IG, Joki N, Nguyen-Khoa T, et al. Chronic kidney disease bone and mineral disorder (CKD-MBD) in apolipoprotein E-deficient mice with chronic renal failure. Bone. 2010;47:156–163. doi: 10.1016/j.bone.2010.04.600. [DOI] [PubMed] [Google Scholar]
- 30.Moe SM, Chen NX, Seifert MF, et al. A rat model of chronic kidney disease-mineral bone disorder. Kidney Int. 2009;75:176–184. doi: 10.1038/ki.2008.456. [DOI] [PMC free article] [PubMed] [Google Scholar]
- 31.Katsumata K, Kusano K, Hirata M, et al. Sevelamer hydrochloride prevents ectopic calcification and renal osteodystrophy in chronic renal failure rats. Kidney Int. 2003;64:441–450. doi: 10.1046/j.1523-1755.2003.00126.x. [DOI] [PubMed] [Google Scholar]
- 32.Damment S, Secker R, Shen V, et al. Long-term treatment with lanthanum carbonate reduces mineral and bone abnormalities in rats with chronic renal failure. Nephrol Dial Transplant. 2011;26:1803–1812. doi: 10.1093/ndt/gfq682. [DOI] [PMC free article] [PubMed] [Google Scholar]
- 33.Westenfeld R, Schäfer C, Smeets R, et al. Fetuin-A (AHSG) prevents extraosseous calcification induced by uraemia and phosphate challenge in mice. Nephrol Dial Transplant. 2007;22:1537–1546. doi: 10.1093/ndt/gfm094. [DOI] [PubMed] [Google Scholar]
- 34.De Schutter TM, Neven E, Persy VP, et al. Vascular calcification is associated with cortical bone loss in chronic renal failure rats with and without ovariectomy: the calcification paradox. Am J Nephrol. 2011;34:356–366. doi: 10.1159/000331056. [DOI] [PubMed] [Google Scholar]
- 35.Bacic D, Lehir M, Biber J, et al. The renal Na+/phosphate cotransporter NaPi-IIa is internalized via the receptor-mediated endocytic route in response to parathyroid hormone. Kidney Int. 2006;69:495–503. doi: 10.1038/sj.ki.5000148. [DOI] [PubMed] [Google Scholar]
- 36.Segawa H, Yamanaka S, Onitsuka A, et al. Parathyroid hormone-dependent endocytosis of renal type IIc Na–Pi cotransporter. Am J Physiol Renal Physiol. 2007;292:F395–F403. doi: 10.1152/ajprenal.00100.2006. [DOI] [PubMed] [Google Scholar]
- 37.Saji F, Shigematsu T, Sakaguchi T, et al. Fibroblast growth factor 23 production in bone is directly regulated by 1{alpha},25-dihydroxyvitamin D, but not PTH. Am J Physiol Renal Physiol. 2010;299:F1212–F1217. doi: 10.1152/ajprenal.00169.2010. [DOI] [PubMed] [Google Scholar]
- 38.Huang JC, Sakata T, Pfleger LL, et al. PTH differentially regulates expression of RANKL and OPG. J Bone Miner Res. 2004;19:235–244. doi: 10.1359/JBMR.0301226. [DOI] [PubMed] [Google Scholar]
- 39.Lotinun S, Sibonga JD, Turner RT. Evidence that the cells responsible for marrow fibrosis in a rat model for hyperparathyroidism are preosteoblasts. Endocrinology. 2005;146:4074–4081. doi: 10.1210/en.2005-0480. [DOI] [PubMed] [Google Scholar]
- 40.Bleyer AJ, Burkart J, Piazza M, et al. Changes in cardiovascular calcification after parathyroidectomy in patients with ESRD. Am J Kidney Dis. 2005;46:464–469. doi: 10.1053/j.ajkd.2005.04.035. [DOI] [PubMed] [Google Scholar]
- 41.Price PA, June HH, Buckley JR, et al. Osteoprotegerin inhibits artery calcification induced by warfarin and by vitamin D. Arterioscler Thromb Vasc Biol. 2001;21:1610–1616. doi: 10.1161/hq1001.097102. [DOI] [PubMed] [Google Scholar]
- 42.Price PA, Faus SA, Williamson MK. Bisphosphonates alendronate and ibandronate inhibit artery calcification at doses comparable to those that inhibit bone resorption. Arterioscler Thromb Vasc Biol. 2001;21:817–824. doi: 10.1161/01.atv.21.5.817. [DOI] [PubMed] [Google Scholar]
- 43.Lomashvili KA, Monier-Faugere MC, Wang X, et al. Effect of bisphosphonates on vascular calcification and bone metabolism in experimental renal failure. Kidney Int. 2009;75:617–625. doi: 10.1038/ki.2008.646. [DOI] [PMC free article] [PubMed] [Google Scholar]
- 44.Di Bartolo BA, Schoppet M, Mattar MZ, et al. Calcium and osteoprotegerin regulate IGF1R expression to inhibit vascular calcification. Cardiovasc Res. 2011;91:537–545. doi: 10.1093/cvr/cvr084. [DOI] [PubMed] [Google Scholar]
- 45.van den Broek FA, Beynen AC. The influence of dietary phosphorus and magnesium concentrations on the calcium content of heart and kidneys of DBA/2 and NMRI mice. Lab Anim. 1998;32:483–491. doi: 10.1258/002367798780599758. [DOI] [PubMed] [Google Scholar]
- 46.Moe S, Chen N. Mechanisms of vascular calcification in chronic kidney disease. J Am Soc Nephrol. 2008;19:213–216. doi: 10.1681/ASN.2007080854. [DOI] [PubMed] [Google Scholar]
- 47.Akintoye SO, Lam T, Shi S, et al. Skeletal site-specific characterization of orofacial and iliac crest human bone marrow stromal cells in same individuals. Bone. 2006;38:758–768. doi: 10.1016/j.bone.2005.10.027. [DOI] [PubMed] [Google Scholar]
- 48.Yamaza T, Ren G, Akiyama K, et al. Mouse mandible contains distinctive mesenchymal stem cells. J Dent Res. 2011;90:317–324. doi: 10.1177/0022034510387796. [DOI] [PMC free article] [PubMed] [Google Scholar]
- 49.Sodek J, McKee MD. Molecular and cellular biology of alveolar bone. Periodontol 2000. 2000;24:99–126. doi: 10.1034/j.1600-0757.2000.2240106.x. [DOI] [PubMed] [Google Scholar]
- 50.Allen MR, Kubek DJ, Burr DB. Cancer treatment dosing regimens of zoledronic acid result in near-complete suppression of mandible intracortical bone remodeling in beagle dogs. J Bone Miner Res. 2010;25:98–105. doi: 10.1359/jbmr.090713. [DOI] [PMC free article] [PubMed] [Google Scholar]
- 51.Manske SL, Liu-Ambrose T, Cooper DM, et al. Cortical and trabecular bone in the femoral neck both contribute to proximal femur failure load prediction. Osteoporos Int. 2009;20:445–453. doi: 10.1007/s00198-008-0675-2. [DOI] [PubMed] [Google Scholar]
- 52.Holzer G, von Skrbensky G, Holzer LA, et al. Hip fractures and the contribution of cortical versus trabecular bone to femoral neck strength. J Bone Miner Res. 2009;24:468–474. doi: 10.1359/jbmr.081108. [DOI] [PubMed] [Google Scholar]
Associated Data
This section collects any data citations, data availability statements, or supplementary materials included in this article.