Abstract
Functional magnetic resonance imaging signals, in addition to reflecting neuronal response, also contain physiological variances. These factors may introduce variability into blood oxygen level–dependent (BOLD) activation results, particularly in different population groups. In this study, we hypothesized that the amplitude as well as the spatial extent of BOLD activation could be improved after minimizing the variance caused by the neurovascular and anatomical factors. Subjects were scanned while they performed finger tapping and digit-symbol substitution tasks (DSSTs). Partial volume and neurovascular effects were estimated on a voxelwise basis using subjects' own gray matter volume (GMV), breath holding (BH), and amplitude of low-frequency fluctuation (ALFF). The results showed that all individual's GMV, BH, and ALFF could significantly predict motor and DSST activations in a voxelwise manner. Whole-brain analyses were conducted to regress out the anatomical and neurovascular information. Differential maps (obtained using t-test) indicated that the adjustment tended to suppress activation in regions that were near vessels such as midline cingulate gyrus, bilateral anterior insula, and posterior cerebellum. These results suggest that voxelwise adjustment using GMV and neurovascular parameters can minimize structural and physiological variances among individuals and be used for quantitative comparisons.
Keywords: BOLD, breath hold, calibration, cognition, fMRI, hypercapnic scaling, motor, resting-state
Introduction
Blood oxygen level–dependent (BOLD) contrast has been a widely used technique to investigate neural correlates of cognitive processes. BOLD signal differences between cognitive or sensory stimulation conditions reflect differences in deoxy- and oxyhemoglobin, mediated by changes in local cerebral metabolic rate of oxygen, cerebral blood flow, and cerebral blood volume that are induced by the neural activity that accompanies cognitive activity. Physiological factors such as spatial variation in vascular characteristics, neurovascular coupling, and the nature of underlying tissue types are known to influence BOLD contrasts (Bandettini and Wong 1997; Rostrup et al. 2000) and distort spatial distributions of BOLD activity biased for regions that are more sensitive to those physiological factors. Such distortion can have deleterious effects on the accuracy of BOLD measurement. Specifically, increased variability can reduce the sensitivity of BOLD measurement to neural activity especially under conditions of low statistical power. Minimizing the distortion caused by physiological factors can improve the sensitivity, validity, and reliability of BOLD measurement.
One source of physiological distortion comes from variation in neurovascular coupling in different brain regions (Wise et al. 2004). For example, higher BOLD signal has been observed in the occipital lobe, temporal lobe, and parietal lobe (Posse et al. 1997; Kastrup et al. 1999; Rostrup et al. 2000; Wise et al. 2004), and lower BOLD signal has been observed in the basal ganglia, striatum, and thalamus (Posse et al. 1997; Kastrup et al. 1999; Wise et al. 2004). Such differences might reflect bona-fide neural variation in different regions but the consistency of this variation across tasks and studies suggests the hypothesis that it actually reflects regional variation in the sensitivity of vasculature to neural activity. Regional variance in neurovascular coupling will not only smear the amplitude of BOLD activations but also distort the spatial distribution of activation maps (Bandettini and Wong 1997; Gati et al. 1997). Gati et al. (1997) showed that the percent signal changes in large vessels were about 10 times larger than that in tissue. Extremely high BOLD signal values generated by large vessels might make the activation clusters shift toward large vessels, away from their neuronal origins. One solution to physiological distortion effects on BOLD signal has been to acquire estimates of vascular activity in the absence of neural activity (Thomason et al. 2007). Scaling stimulation-induced BOLD signal by these estimates across the brain would then yield BOLD signal measurements free of distortion effects (Bandettini and Wong 1997; Cohen et al. 2004; Thomason et al. 2007; Lu et al. 2010).
One method for deriving estimates of vascular activity in the absence of neural activity capitalizes on the fact that, when excess carbon dioxide accumulates in the blood, a condition known as hypercapnia, vascular perturbations approximating those caused by neural activity occurs. One way to induce hypercapnia is by requiring subjects to suspend breathing (i.e. breath holding; BH; Biswal et al. 2007; Handwerker et al. 2007; Thomason et al. 2007). When subjects perform periodic breath holding during functional magnetic resonance imaging (fMRI) scanning, estimates of vasoreactivity may be obtained (similar estimates can be obtained by periodic ingestion of CO2; for example, Kastrup et al. 1998; but these methods are often regarded as unduly invasive by subjects). These estimates may then be included as scaling factors in subsequent analyses to obtain estimates of task-related neural activity with minimal influence from nonneural factors.
Recently, endogenous and task-free alternatives to hypercapnia-based methods, such as the resting-state fluctuation of amplitude (RSFA), have been successfully implemented to minimize vascular-related BOLD variability within regions and between individuals (Kannurpatti and Biswal 2008; Kannurpatti et al. 2011). Kannurpatti and Biswal (2008) first used standard deviation to estimate the RSFA and observed high correspondence between RSFA and hypercapnia activations including breath hold and 5% CO2 inhalation. Calibration of task-related activity estimate using RSFA can minimize intrasubject variance and increase measurement accuracy between young and old groups (Kannurpatti et al. 2011). In addition, Biswal et al. (2007) showed that only very low-frequency amplitude (0.01, 0.03, and 0.04 Hz) correlated with BH-related activity, whereas the high-frequency amplitude (0.3 Hz) did not, suggesting that fluctuations amplitude within low-frequency ranges are more appropriate to calibrate task-related activity estimates.
The previous studies generally scaled the activation maps for each voxel using hypercapnic or RSFA variables, either within a small number of activated voxels or across the whole brain, but did not take into account information from other voxels. However, the voxels in BH activation or RSFA images reflect values that are relative to the values of adjacent voxels, rather than absolute measures of hypercapnic or RSFA effects. Thus, it will make the calibration of a given voxel more accurate if the hypercapnic information from other voxels is taken into account.
Anatomic variability is another source of BOLD measurement distortion. Due to the relatively poor spatial resolution of the fMRI images, the BOLD signal in any given voxel can reflect the extent to which the contents of the voxel comprised gray matter (GM), white matter (WM), and cerebrospinal fluid (CSF). Partial volume effects can make it appear as if voxels with larger proportions of GM have greater baseline BOLD intensity and can proportionally enlarge activations in those voxels. Partial volume effects are also known to unduly influence between-group comparisons. For instance, structural or functional differences between two groups might appear different or equivalent depending on the orientation of the structures or regions in question, relative to the measurement axes and extent to which the structure or region crosses voxel boundaries (e.g., Davatzikos 2004). Corrections for partial volume effects on blood-flow images either from positron emission tomography (Meltzer et al. 1990) or perfusion fMRI (Taki et al. 2011) have been proposed, however, partial volume effects on BOLD measurement have not yet been investigated.
In the present study, we measured and minimized whole-brain intervoxel variability of BOLD task-related activity, GM volume, and neurovascular effects using a regression model. We hypothesized that minimizing the influence of time-series distortions caused by nonneural vascular and anatomical effects would increase the reliability of the task-induced signal changes, and thus reduce intersubject variability. To accomplish this objective, we scanned subjects while they performed a motor finger tapping task known to reliably activate motor areas, and a cognitive processing speed task that reliably activates task positive networks and deactivates default mode networks (e.g., Rypma et al. 2006; Motes et al. 2010). Neurovascular data were acquired from the BH task and resting-state fMRI, from which we computed the amplitude of low-frequency fluctuation (ALFF; Biswal et al. 2007, 2010). Anatomical information was obtained from high-resolution magnetization prepared rapid gradient echo (MPRAGE) images from individual subjects. We first showed linear relationships between task-related BOLD activity and GM volume (GMV), BH activation, and ALFF across the whole brain. Then, a whole-brain regression was used to adjust spatial distribution of the BOLD activation maps. The results supported our hypotheses regarding the deleterious influences of these variables on the accuracy of task-related BOLD estimation.
Materials and Methods
Subjects
Fourteen healthy young subjects with no history of head trauma and neurological diseases were (6 M; mean age = 24 years) recruited from flyers posted on the campuses of the University of Texas at Dallas (UTD) and the University of Texas Southwestern Medical Center (UTSW). All experimental procedures were approved by The UTD and UTSW Institutional Review Boards. Written informed consent was obtained from all subjects, and they were paid on an hourly basis during the study.
Tasks
Each subject performed a bilateral finger tapping motor, a digit-symbol substitution task (DSST), and a BH task. Resting-state fMRI scans were also obtained for all the subjects. The subjects were instructed verbally through a microphone and speaker system at the time of the onset of each of the separate tasks. Participants sequentially touched each finger of each hand to its respective thumb making one touch and release, as best they could. The motor paradigm consisted of an initial 10 s rest period followed by 4 repetitions of alternate epochs of 20 s of bilateral motor and 20 s of rest.
The DSST was adapted from the Wechsler Adult Intelligence Scale (Wechsler, 1981). It consisted of a code table that represents pairings of digits and nonsense symbols. The code table containing digit-symbol pairs and a single digit-symbol probe was projected simultaneously on a screen for 4 s viewed by subjects inside the MR-scanner (Rypma et al. 2006). If the probe pair matched one of those in the table, subjects pressed a right-thumb button; otherwise, they pressed a left-thumb button. There was a total of 52 trials in a single scanning run. On half the trials, the probe pair matched one of the digit-symbol pairs in the code table, and on the other half, the probe pair did not match one of the pairs in the code table. The stimuli stayed on the screen for 4 s followed by variable intertrial intervals of 0, 4, 8, or 12 s.
The BH experiment consisted of a 40-s rest period (normal breathing) followed by 3 repetitions of alternate epochs of 20 s of BH and 40 s of normal breathing. Subjects performed an end-inspirational BH inhaling a similar volume of air, which they would in a normal breathing cycle (Kannurpatti et al. 2002; Biswal et al. 2007). Subjects were trained on the BH technique a few minutes prior to the actual scanning session and consciously avoided the inhalation of larger than the normal volume of air prior to BH. During the resting-state MR-scan, subjects remained relaxed with their eyes closed.
MRI Data Acquisition
MRI on 14 subjects was performed on a Siemens Allegra 3T scanner equipped with a fixed asymmetric head gradient coil and a shielded end-cap quadrature transmit/receive birdcage radio-frequency coil. Subjects were positioned in a supine position on the gantry with head in a midline location in the coil. Foam padding and a pillow were used to minimize head motion. High-resolution anatomical images using an MPRAGE sequence 1 mm isovoxel; sagittal; time echo (TE) = 3.7 ms; and flip angle =12°. Gradient echo echo-planar imaging (EPI) images were subsequently obtained during rest, Motor, DSST, and the BH task. Thirty-two slices were obtained in the axial plane covering the entire brain. Imaging parameters were: field of view of 220 mm, 64 × 64 matrix, time repetition/TE = 2000/30 ms and slice thickness of 4 mm. A flip angle of 80° was used to minimize flow weighting. During each Motor, BH, and rest scans, 90, 110, and 120 EPI images were obtained, respectively. The DSST task was scanned in three separate sessions, with 150 images for each session. Imaging parameters were kept the same for all 6 runs.
Imaging Data Analysis
GM Volume
The high-resolution structure images were segmented using a unified segmentation algorithm from the new segment function in SPM8 (Ashburner and Friston 2005). This algorithm segments the whole-brain structure image into GM, WM, CSF, and 3 other tissue types with automatic normalization into the Montreal Neurological Institute (MNI) space. The segmented images were modulated to account for spatial expands and contracts in the normalization step, and thus reflected GMV. The deformation field maps of the normalizations were obtained to later normalize the functional images. Subsequently, the GMV images were spatially smoothed using a 6-mm full-width at half-maximum (FWHM) 3D Gaussian kernel and resampled with a 3 × 3 × 3 mm resolution to match the functional images.
Functional Data Preprocessing
Imaging data analysis was conducted using SPM8 package (http://www.fil.ion.ucl.ac.uk/spm/ [date last accessed 13 January 2012]) under MATLAB 7.6. For each subject, the first 2 images of each scan were discarded. Then, the functional images were motion corrected and co-registered to the subject's anatomical images in native space. Next, the subject's deformation field maps obtained from the structural image segmentation were applied to all the functional images, so that all the functional images were normalized to the MNI space. The normalized images were resampled at 3 mm3 resolution. Finally, all functional images were spatially smoothed using an 8-mm FWHM 3D Gaussian kernel.
Task Activations
Motor Task
In the general linear model (GLM), the periods of finger tapping were modeled as a box-car function and convolved with a canonical hemodynamic response function (HRF) implemented in SPM. The GLM models were estimated in a voxelwise manner and the beta map representing motor task activation was obtained for each subject.
DSST
In the GLM model, the stimulus onset was modeled as a delta function and convolved with a canonical HRF. Because the DSST involved 3 runs, after estimating the GLM model, the contrast map representing average effect of DSST activations across the 3 sessions was obtained for further analysis.
BH Task
In the GLM model of BH, the breath holding periods was modeled as a box-car function with an onset delay for 7 s to account for the BOLD response delay of BH (Biswal et al. 2007). Then, the delayed box-car function was convolved with canonical HRF. After estimating the GLM model, beta map representing BH activations was obtained for future analysis.
ALFF Map
The ALFF maps (Zang et al. 2007) were calculated for each subject using the Resting-State fMRI Data Analysis Toolkit V1.5 (http://restfmri.net/ [date last accessed 13 January 2012]). The time series were first linear detrended and band-pass filtered between 0.01 and 0.08 Hz. Then, the map of the low-frequency power was estimated in a voxelwise manner for each subject.
Intervoxel Correlation Analysis
First, the relationship between task activation and anatomic neurovascular factors were examined across the whole brain. The whole-brain GM mask was defined by a group mean GM intensity that was larger than 0.2 (Taki et al. 2011). For each subject, corresponding values of the task activations, BH activation, ALFF, and GMV were extracted within the mask. Pearson correlations between the above variables were calculated for each subject. Individual subjects' correlation coefficients were transformed into z scores using Fisher's transformation for intersubject statistics. Mean z scores were inverse transformed to r values to represent group mean r values.
Whole-Brain Regression
BOLD activation calibrations were carried out using regression models. Based on the observation that BOLD activation was positively correlated with vascular factors in task positive regions and was negatively correlated with vascular factors in task negative regions (see Supplementary Figure S1), the higher order polynomial effects of neurovascular and anatomical factors were included in the model to account for nonlinear effects. In addition, the interaction terms between anatomical and neurovascular factors were also included in the model. Separate regression models with linear, quadratic, and cubic effects were performed, and the order of polynomial effects were determined using the Akaike's Information Criterion (AIC; Akaike 1974). Regression models with larger than third order were not applied in the current analysis because the higher order models are difficult to interpret and might introduce over-fitting problems. The AIC reflects a trade-off between minimizing the model error and the model complexity. The finite-sample corrected AIC was adopted as follows (Hurvich and Tsai 1989; Zuo et al. 2010):
where is the variance of the residuals, k is the number of predictors in the regression model, and n is the number of samples. Lower AIC value reflects better model evidence after considering both model prediction accuracy and complexity.
The same whole-brain GM mask was used for the regression analyses. All values were extracted within the mask and concatenated as a vector. The beta vector for the motor task and the contrast vector for the DSST were set as dependent variables, respectively. For the GMV and BH adjustment, the GMV and BH vectors were included as independent variables, and for the GMV and ALFF adjustment, the GMV and ALFF vectors were included as independent variables. Both independent variables were z-transformed before entry into the regression model. The regression models were estimated using least squares. Given the β estimates from the linear regression model, the effects of the independent variables and their polynomial and interaction variables were removed from the corresponding dependent variable. Finally, the adjusted activation value vectors were reconstructed into 3D images.
Quantification
To illustrate the spatial distributions of the activation changes after calibrations, voxelwise statistics were conducted on the group level. First, second-level one-sample t-tests were separately conducted for the β maps before and after calibrations. For the motor task, only positive activations were calculated, and for the DSST, positive and negative activations were calculated separately. For each task positive or negative effect, group maps before and after calibration were overlayed, so that the effects of calibrations can be visually inspected. In addition, group level paired t-tests were performed to directly compare the β maps before and after calibrations for both tasks and both calibration models.
Results
The Relationships among the Task Activations, Anatomical, and Neurovascular Factors
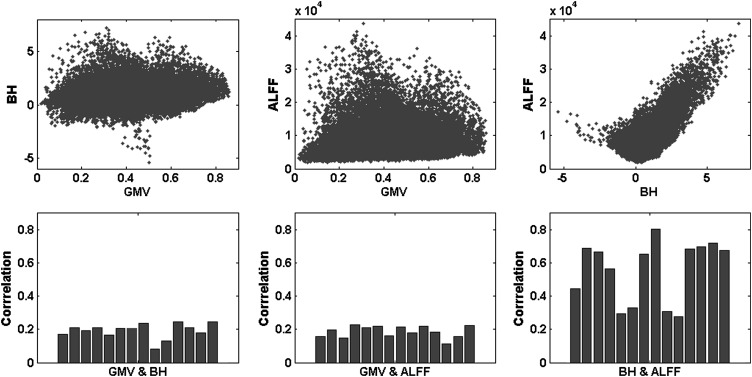
As illustrated in Figure 1, the BH activations and the ALFF showed consistent large positive correlations across the whole brain. The mean correlation was 0.5837 (P < 0.01). There were also small but consistent correlations between the GMV and BH and between GMV and ALFF. The mean correlation between the GMV and BH was 0.1925 (P < 0.01) and the correlation between the GMV and ALFF was 0.1875 (P < 0.01).
Figure 1.
Correlations among the GMV, BH activations (contrast values), and ALFF across the whole brain. The upper panels illustrated the scatterplot for a single subject, and the lower panels showed the correlation coefficient for each subject.
Motor Task
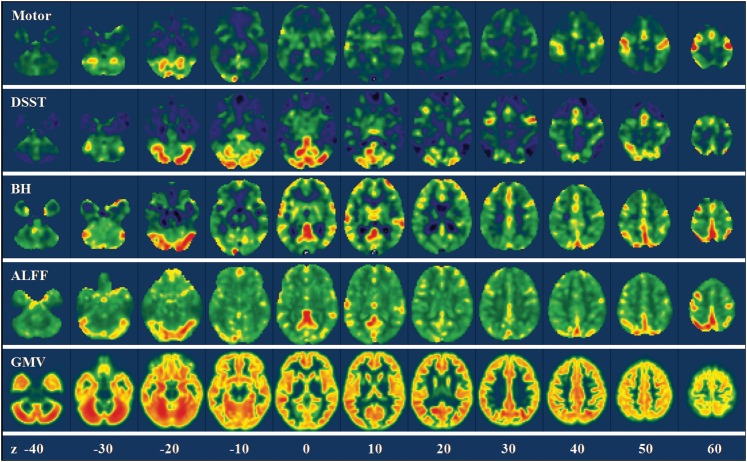
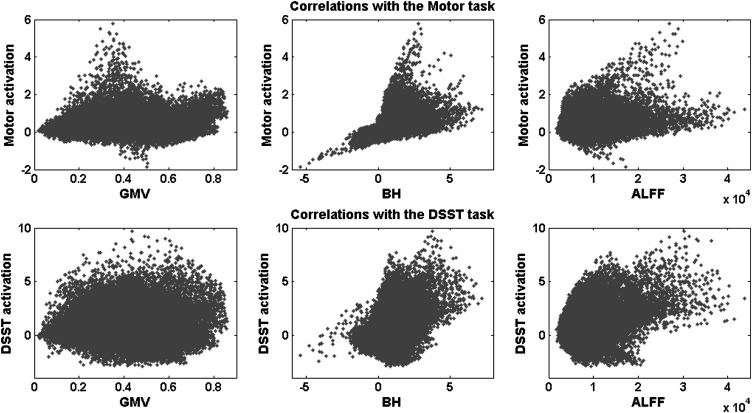
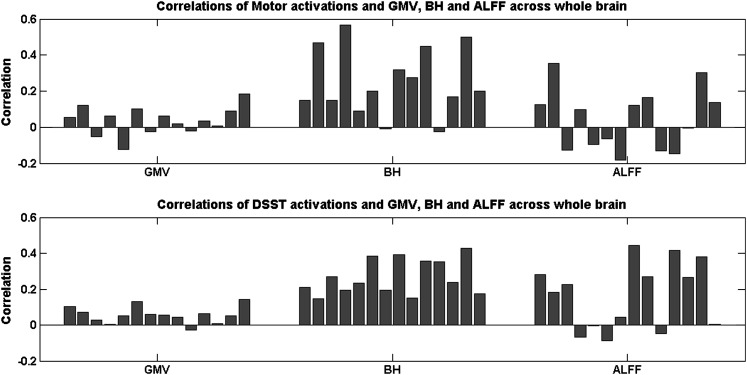
Figure 2 shows the intervoxel variances of the motor task activation, the GMV, the BH activations, and the ALFF across the whole brain. The relationship between the task activations and the other 3 variables are illustrated in the upper panels of Figures 3 and 4. The motor-task–related activation was not correlated with the GMV (r = 0.0365, P > 0.05) and ALFF (r = 0.0405, P > 0.05), whereas there were moderate positive correlations with the BH activation (r = 0.2600, P < 0.01).
Figure 2.
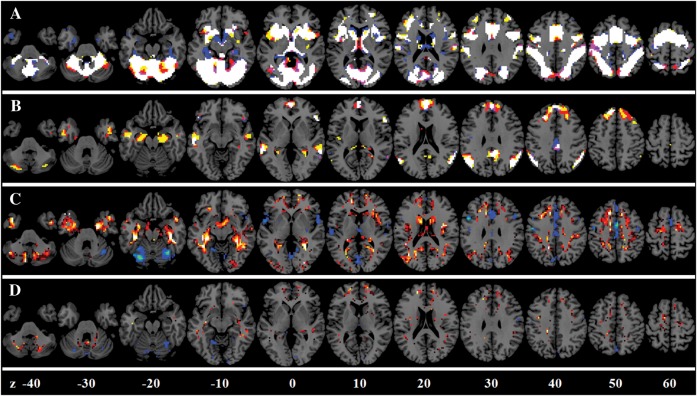
Voxelwise variances of the motor activations, the DSST activations, the GMV, the BH activations, and the ALFF across the whole brain in a representative subject. The color coding was adjusted to show the full range of the variance for each map. Z values in the bottom represented the z coordinates in the MNI space.
Figure 3.
Scatterplot of the relationship between the task activations (beta values) and the GMV (left), the BH activations (beta values, middle), and the ALFF (right) for a single subject across the whole brain. The upper panels showed the motor task activations, and the lower panels showed the DSST activations.
Figure 4.
Correlation coefficients between the task activations and the GMV (left), the BH activations (middle), and the ALFF (right) across the whole brain for each subject. The upper panels showed the motor task activations, and the lower panels showed the DSST activations.
The DSST
Figure 2 shows the intervoxel variances of DSST activation, GMV, BH, and ALFF across the whole brain. The relationships between the task activations and the other 3 variables are illustrated in the lower panels of Figures 3 and 4. The intervoxel correlations were fairly consistent across subjects (see the lower panels of Fig. 4). DSST activations showed small but consistent positive correlation with GMV (r = 0.0562, P < 0.01). Furthermore, DSST activations showed moderate positive correlations with both BH activations (r = 0.2690, p < 0.01) and ALFF (r = 0.1704, P < 0.01).
Activation Calibration
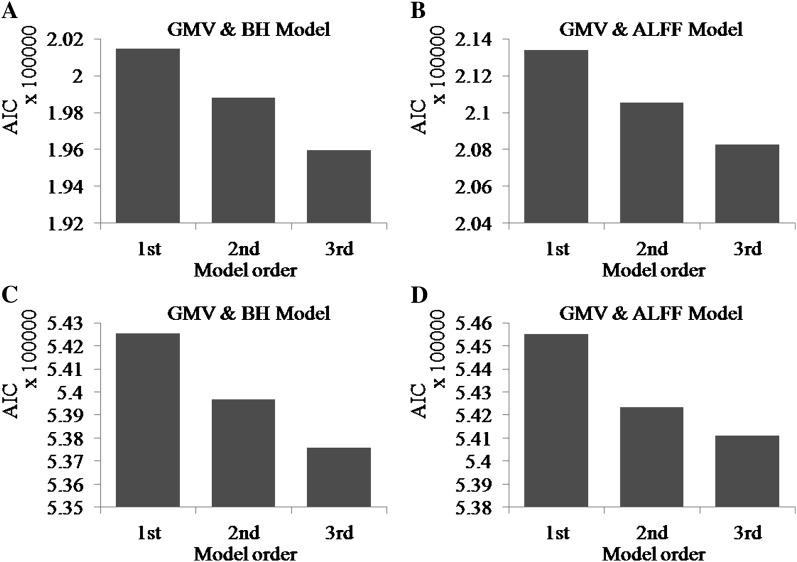
For both the motor and DSSTs, and for both calibration methods, the third order regression models had the least AIC values (Figure 5) for all the subjects. Thus, we chose to use the third order polynomial to model and regress out anatomical and neurovascular variables.
Figure 5.
Mean AIC for the 3 regression models for the motor task (A and B) and DSST (C and D). The left panels (A and C) show the AIC for the GMV and BH calibration, and the right panels (B and D) show the AIC for the GMV and ALFF calibration.
Motor Task
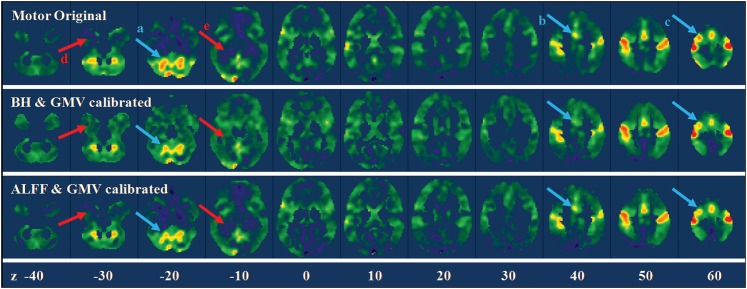
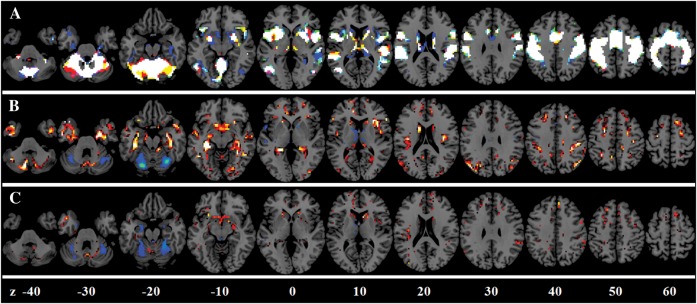
For the motor task, the GMV and BH model accounted for on average 13.18% of total variances, and the GMV and ALFF model accounted for on average 6.65% of total variances. Figure 6 illustrates the results of calibration of the motor task activations for a single subject. The calibration tended to suppress the activations in the cerebellum (arrow a), the supplementary motor area (arrow b), and sensorimotor area (arrow c) and enhanced the activations in the anterior temporal lobe (arrow d) and parahippocampal regions (arrow e). Figure 7 displayed the group mean effects of calibrations. GMV/BH adjustment tended to reduce activation in the regions, including midline cingulate gyrus, bilateral anterior insula, and posterior cerebellum. Conversely, the adjustment tended to increase activation in anterior temporal lobe, parahippocampal gyrus, and widespread regions near the border of GM and WM. The effects of GMV/ALFF adjustment were smaller than the GMV/BH adjustment. However, if the threshold was reduced, a similar pattern could be observed.
Figure 6.
Whole-brain motor task activation maps for a single subject before and after calibrations. The upper panel showed the original beta maps of the motor activations, and the middle and lower panels showed the beta maps after BH/GMV and ALFF/GMV calibrations. The arrows highlighted the regions with obvious suppression (light blue) and enhancement (light red) after calibrations. Z values in the bottom represented the z coordinates in the MNI space.
Figure 7.
BOLD activation calibration for the motor task. (A) Overlap among the original activations (in red), the activations after GMV/BH adjustment (in blue), and the activations after the GMV/ALFF adjustment (in green). (B) Enhanced activations (in red) and suppressed activations (in blue) after the GMV/BH adjustment. (C) Enhanced activations (in red) and suppressed activations (in blue) after the GMV/ALFF adjustment. Z values represented the z coordinates in the MNI space.
The DSST
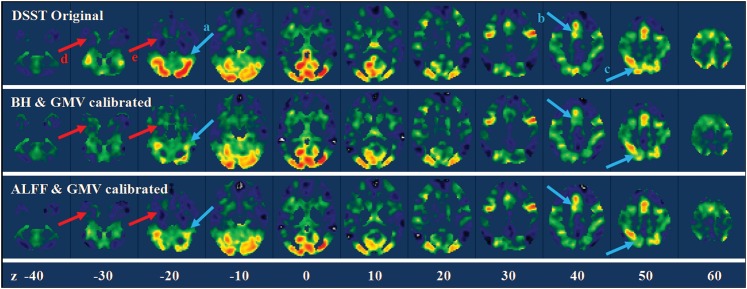
For the DSST, the GMV and BH models accounted for on average 11.22% of total variances and the GMV and ALFF models accounted for on average 9.08% of total variances. Figure 8 illustrates the results of calibration of the DSST activations for a single subject. Activation suppression can be visually observed in the cerebellum (arrow a), supplementary motor area (arrow b), and posterior parietal lobe (arrow c). Whereas activation enhancements can be observed in the anterior temporal lobe (arrow d) and the parahippocampal regions (arrow e). Figure 9 displays the group mean effects of calibrations. GMV/BH adjustment tended to reduce activation in regions, including midline cingulate gyrus, bilateral anterior insula, and posterior cerebellum. Conversely, the adjustment tended to increase activation in anterior temporal lobe, parahippocampal gyrus, and widespread regions bordering GM and WM. Similar patterns were observed in GMV/ALFF adjustment but with reduced effect sizes.
Figure 8.
Whole-brain DSST activation maps for a single subject before and after calibrations. The upper panel showed the original beta maps of the DSST activations, and the middle and lower panels showed the beta maps after BH/GMV and ALFF/GMV calibrations. The arrows highlighted the regions with obvious suppression (light blue) and enhancement (light red) after calibrations. Z values in the bottom represented the z coordinates in the MNI space.
Figure 9.
BOLD activation calibration for the DSST. (A) Overlap among the original positive activations (in red), the activations after GMV/BH adjustment (in blue), and the activations after the GMV/ALFF adjustment (in green). (B) Overlap among the original negative activations (in red), the activations after GMV/BH adjustment (in blue), and the activations after the GMV/ALFF adjustment (in green). Note that the activation maps were two-tailed, thus reflected both activations and deactivations. (C) Enhanced activations (in red) and suppressed activations (in blue) after the GMV/BH adjustment. (D) Enhanced activations (in red) and suppressed activations (in blue) after the GMV/ALFF adjustment. Z values represented the z coordinates in the MNI space.
Discussion
Effects of Activation Calibration
The present study utilized an intervoxel whole-brain regression method to adjust neurovascular and brain tissue effects on the BOLD activation maps. Activations in some task-related ROIs were amplified and the variances suppressed. These results were consistent with previous work on BOLD calibration (Biswal et al. 2007; Thomason et al. 2007; Kannurpatti and Biswal 2008; Kannurpatti et al. 2011). Extending previous work, we directly modeled intrasubject BOLD variability across the whole brain and incorporated additional anatomical information within the model. Consideration of intrasubject variability across the whole brain is important as many functional imaging studies investigating these issues are exploratory, and the task-related regions are not clearly delineated or prespecified. In addition, using a whole-brain calibration method, it would be possible to detect brain regions vulnerable to neurovascular and tissue artifacts and regions where BOLD signals were needed to be enhanced due to poor neurovascular response. Regions where activations were suppressed generally coincided with the regions that had larger neural–vascular response, including the cingulate cortex, border regions between the occipital lobe and the cerebellum, lateral frontal lobe, and regions along the Sylvian fissure. This result suggested that the adjustment method could be a powerful tool to calibrate BOLD activation maps.
Large vessels constituted an additional, but not exclusive, adjustment factor because the distribution of the adjustment suppression agreed well with the distribution of large vessels. For example, one of the suppressed regions extended from the posterior cerebellum to the occipital pole. This region was adjacent to the transverse sinus, which passed though the edges of the visual cortex and the cerebellum. Another region in which the activation was suppressed was the cingulate cortex, which was close to the anterior cerebral artery. Further regions showing suppressed activity were mainly located in the anterior insula regions containing the middle cerebral artery and the superficial middle cerebral vein that passed through the insula and the frontal lobes.
In contrast, after adjustment widespread regions showed enhanced activity mainly on the edges of the GM and WM. This difference following adjustment might be due to partial volume effects caused by variations of the proportion of GM comprising a certain voxel. Another region that showed amplified activation was located in the anterior temporal lobe and the parahippocampal gyrus. Examination of the BH activations and ALFF maps confirmed that these regions have lower BH activation and ALFF values, suggesting that they had a relatively impoverished neurovascular response. Such poor neurovascular response could cause lower BOLD activation compared with other brain regions and might reflect regional differences in vascular distribution (e.g., Harrison et al. 2002).
The Contribution of Vascular and Anatomical Factors
The current results show consistent intrasubject correlations between BOLD activation and the neurovascular variables, including both the BH activations and the ALFF. Within task activation networks (upper panel of Supplementary Fig. S1), task activation revealed positive correlations with the neurovascular variables. This result agrees with previous studies (Biswal et al. 2007; Handwerker et al. 2007; Kannurpatti and Biswal 2008; Kannurpatti et al. 2011). Additionally, the current analysis showed, for the first time, a negative correlation between DSST-induced deactivations and the BH activations or the ALFF (lower panel of Supplementary Fig. S1). In other words, the larger the neurovascular vulnerability in a voxel, the greater this voxel showed negative activation. This result suggested that the previous established physiological effects on BOLD activation (Wise et al. 2004; Birn et al. 2006) are more complex outside the task positive regions. The neurovascular coupling may act as an amplifier of neuronal activity. This result suggests the hypothesis that, independent of whether the task-related activity is increased or decreased (Shmuel et al. 2006) relative to rest, local neurovascular coupling amplifies the neuronal response in either direction. Future research will be required to test this hypothesis.
Contrary to the partial volume effect hypothesis, the relationship between task activation and the GMV was equivocal. Within the motor areas, motor task activations revealed small but reliable negative correlation with the GMV (results now shown), however, within task positive network, the DSST activation revealed small but reliable positive correlations with the GMV. Directly examining the motor activations, the GMV and the BH/ALFF maps showed that voxels with very high motor activations had larger BH/ALFF values but lower GMV. This observation suggests that some of these outlier voxels might be due to larger vessels because regions that have larger vessels always have lower GMV. Thus, larger vessels could have distorted the relationship between the GMV and the task activations. Consequently, the relationship between the task activations and the GMV reflects both partial volume and large vessel effects. The latter effect was accounted for as the interaction between the neurovascular variables and the GMV in the regression model.
Limitations
In this study, the complex relationship between the task activation, anatomical and neurovascular effects, were nonlinear and varied across the brain. The current work only modeled the linear to cubic effect for each variable and the interaction between anatomical and neurovascular variables. Furthermore, by considering either BH or ALFF as the physiological variable in the model, multicolinearity was avoided. However, there was a certain level of correlation between GMV versus BH and GMV versus ALFF indicating a subtle overlap between anatomy and physiology. It is thus difficult to account for all the physiological effects of the activation maps. Ours is the first study to investigate nonlinear neurovascular effects on task activation; further knowledge of physiological effects on task activation will further increase the accuracy of calibration methods such as these.
Conclusion
The present study proposed a whole-brain regression method to minimize the spatial variances of fMRI activations caused by neurovascular and partial volume effects. About 10% of the whole-brain task activation variance could be explained by the regression model. Calibrations based on these regressions can suppress activation signals in regions characterized by disproportionate neurovascular response and GMV, and enhance activation signals in regions characterized by weaker neurovascular responses and smaller GMV, thus, in general, reducing the variance to mean ratio. The voxelwise adjustment using GMV and neurovascular parameters can minimize structural and physiological variances among individuals, and could be adopted for quantitative fMRI comparisons between populations with large anatomical and physiological variations.
Supplementary Material
Supplementary material can be found at: http://www.cercor.oxfordjournals.org/
Note
Conflict of Interest : None declared.
Funding
National Institute of Health (grants 5R01AG032088 to B. B. B. and AG029523 to B. R.).
Supplementary Material
References
- Akaike H. A new look at statistical-model identification. IEEE Trans Automat Contr. 1974;19:716–723. [Google Scholar]
- Ashburner J, Friston KJ. Unified segmentation. Neuroimage. 2005;26(3):839–851. doi: 10.1016/j.neuroimage.2005.02.018. [DOI] [PubMed] [Google Scholar]
- Bandettini PA, Wong EC. A hypercapnia-based normalization method for improved spatial localization of human brain activation with fMRI. NMR Biomed. 1997;10(4–5):197–203. doi: 10.1002/(sici)1099-1492(199706/08)10:4/5<197::aid-nbm466>3.0.co;2-s. [DOI] [PubMed] [Google Scholar]
- Birn RM, Diamond JB, Smith MA, Bandettini PA. Separating respiratory-variation-related fluctuations from neuronal-activity-related fluctuations in fMRI. Neuroimage. 2006;31(4):1536–1548. doi: 10.1016/j.neuroimage.2006.02.048. [DOI] [PubMed] [Google Scholar]
- Biswal BB, Kannurpatti SS, Rypma B. Hemodynamic scaling of fMRI-BOLD signal: validation of low-frequency spectral amplitude as a scalability factor. Magn Reson Imaging. 2007;25(10):1358–1369. doi: 10.1016/j.mri.2007.03.022. [DOI] [PMC free article] [PubMed] [Google Scholar]
- Biswal BB, Mennes M, Zuo XN, Gohel S, Kelly C, Smith SM, et al. Toward discovery science of human brain function. Proc Natl Acad Sci U S A. 2010;107(10):4734–4739. doi: 10.1073/pnas.0911855107. [DOI] [PMC free article] [PubMed] [Google Scholar]
- Cohen ER, Rostrup E, Sidaros K, Lund TE, Paulson OB, Ugurbil K, Kim SG. Hypercapnic normalization of BOLD fMRI: comparison across field strengths and pulse sequences. Neuroimage. 2004;23(2):613–624. doi: 10.1016/j.neuroimage.2004.06.021. [DOI] [PubMed] [Google Scholar]
- Davatzikos C. Why voxel-based morphometric analysis should be used with great caution when characterizing group differences. Neuroimage. 2004;23(1):17–20. doi: 10.1016/j.neuroimage.2004.05.010. [DOI] [PubMed] [Google Scholar]
- Gati JS, Menon RS, Ugurbil K, Rutt BK. Experimental determination of the BOLD field strength dependence in vessels and tissue. Magn Reson Med. 1997;38(2):296–302. doi: 10.1002/mrm.1910380220. [DOI] [PubMed] [Google Scholar]
- Handwerker DA, Gazzaley A, Inglis BA, D'Esposito M. Reducing vascular variability of fMRI data across aging populations using a breathholding task. Hum Brain Mapp. 2007;28(9):846–859. doi: 10.1002/hbm.20307. [DOI] [PMC free article] [PubMed] [Google Scholar]
- Harrison RV, Harel N, Panesar J, Mount RJ. Blood capillary distribution correlates with hemodynamic-based functional imaging in cerebral cortex. Cereb Cortex. 2002:225–233. doi: 10.1093/cercor/12.3.225. [DOI] [PubMed] [Google Scholar]
- Hurvich CM, Tsai CL. Regression and time-series model selection in small samples. Biometrika. 1989;76:297–307. [Google Scholar]
- Kannurpatti SS, Biswal BB. Detection and scaling of task-induced fMRI-BOLD response using resting state fluctuations. Neuroimage. 2008;40(4):1567–1574. doi: 10.1016/j.neuroimage.2007.09.040. [DOI] [PMC free article] [PubMed] [Google Scholar]
- Kannurpatti SS, Biswal BB, Hudetz AG. Differential fMRI-BOLD signal response to apnea in humans and anesthetized rats. Magn Reson Med. 2002;47(5):864–870. doi: 10.1002/mrm.10131. [DOI] [PubMed] [Google Scholar]
- Kannurpatti SS, Motes MA, Rypma B, Biswal BB. Increasing measurement accuracy of age-related BOLD signal change: minimizing vascular contributions by resting-state-fluctuation-of-amplitude scaling. Hum Brain Mapp. 2011;32(7):1125–1140. doi: 10.1002/hbm.21097. [DOI] [PMC free article] [PubMed] [Google Scholar]
- Kastrup A, Kruger G, Glover GH, Neumann-Haefelin T, Moseley ME. Regional variability of cerebral blood oxygenation response to hypercapnia. Neuroimage. 1999;10:675–681. doi: 10.1006/nimg.1999.0505. [DOI] [PubMed] [Google Scholar]
- Kastrup A, Thomas C, Hartmann C, Schabet M. Cerebral blood flow and CO2 reactivity in interictal migraineurs: a transcranial Doppler study. Headache. 1998;38(8):608–613. doi: 10.1046/j.1526-4610.1998.3808608.x. [DOI] [PubMed] [Google Scholar]
- Lu H, Yezhuvath US, Xiao G. Improving fMRI sensitivity by normalization of basal physiologic state. Hum Brain Mapp. 2010;31(1):80–87. doi: 10.1002/hbm.20846. [DOI] [PMC free article] [PubMed] [Google Scholar]
- Meltzer CC, Leal JP, Mayberg HS, Wagner HN, Jr, Frost JJ. Correction of PET data for partial volume effects in human cerebral cortex by MR imaging. J Comput Assist Tomogr. 1990;14(4):561–570. doi: 10.1097/00004728-199007000-00011. [DOI] [PubMed] [Google Scholar]
- Motes MA, Biswal BB, Rypma B. Age-dependent relationships between prefrontal cortex activation and processing efficiency. Cogn Neurosci. 2010;2(1):1–10. doi: 10.1080/17588928.2010.512974. [DOI] [PMC free article] [PubMed] [Google Scholar]
- Posse S, Olthoff U, Weckesser M, Jancke L, Muller-Gartner HW, Dager SR. Regional dynamic signal changes during controlled hyperventilation assessed with blood oxygen level-dependent functional MR imaging. Am J Neuroradiol. 1997;18:1763–1770. [PMC free article] [PubMed] [Google Scholar]
- Rostrup E, Law I, Blinkenberg M, Larsson HB, Born AP, Holm S, Paulson OB. Regional differences in the CBF and BOLD responses to hypercapnia: a combined PET fMRI study. Neuroimage. 2000;11:87–97. doi: 10.1006/nimg.1999.0526. [DOI] [PubMed] [Google Scholar]
- Rypma B, Berger JS, Prabhakaran V, Bly BM, Kimberg DY, Biswal BB, D'Esposito M. Neural correlates of cognitive efficiency. Neuroimage. 2006;33:969–979. doi: 10.1016/j.neuroimage.2006.05.065. [DOI] [PubMed] [Google Scholar]
- Shmuel A, Augath M, Oeltermann A, Logothetis NK. Negative functional MRI response correlates with decreases in neuronal activity in monkey visual area V1. Nat Neurosci. 2006;9(4):569–577. doi: 10.1038/nn1675. [DOI] [PubMed] [Google Scholar]
- Taki Y, Hashizume H, Sassa Y, Takeuchi H, Wu K, Asano M, Asano K, Fukuda H, Kawashima R. Correlation between gray matter density-adjusted brain perfusion and age using brain MR images of 202 healthy children. Hum Brain Mapp. 2011;32(11):1973–1985. doi: 10.1002/hbm.21163. [DOI] [PMC free article] [PubMed] [Google Scholar]
- Thomason ME, Foland LC, Glover GH. Calibration of BOLD fMRI using breath holding reduces group variance during a cognitive task. Hum Brain Mapp. 2007;28(1):59–68. doi: 10.1002/hbm.20241. [DOI] [PMC free article] [PubMed] [Google Scholar]
- Wechsler D. 1981. The psychometric tradition: Developing the Wechsler Adult Intelligence Scale. Contemp Educ Psychol. 6(2):82–85. [Google Scholar]
- Wise RG, Ide K, Poulin MJ, Tracey I. Resting fluctuations in arterial carbon dioxide induce significant low frequency variations in BOLD signal. Neuroimage. 2004;21(4):1652–1664. doi: 10.1016/j.neuroimage.2003.11.025. [DOI] [PubMed] [Google Scholar]
- Zang YF, He Y, Zhu CZ, Cao QJ, Sui MQ, Liang M, Tian LX, Jiang TZ, Wang YF. Altered baseline brain activity in children with ADHD revealed by resting-state functional MRI. Brain Dev. 2007;29(2):83–91. doi: 10.1016/j.braindev.2006.07.002. [DOI] [PubMed] [Google Scholar]
- Zuo XN, Kelly C, Di Martino A, Mennes M, Margulies DS, Bangaru S, Grzadzinski R, Evans AC, Zang YF, Castellanos FX, et al. Growing together and growing apart: regional and sex differences in the lifespan developmental trajectories of functional homotopy. J Neurosci. 2010;30(45):15034–15043. doi: 10.1523/JNEUROSCI.2612-10.2010. [DOI] [PMC free article] [PubMed] [Google Scholar]
Associated Data
This section collects any data citations, data availability statements, or supplementary materials included in this article.


