

Abstract
Prolonged wakefulness is associated not only with obvious changes in the way we feel and perform but also with well-known clinical effects, such as increased susceptibility to seizures, to hallucinations, and relief of depressive symptoms. These clinical effects suggest that prolonged wakefulness may be associated with significant changes in the state of cortical circuits. While recent animal experiments have reported a progressive increase of cortical excitability with time awake, no conclusive evidence could be gathered in humans. In this study, we combine transcranial magnetic stimulation (TMS) and electroencephalography (EEG) to monitor cortical excitability in healthy individuals as a function of time awake. We observed that the excitability of the human frontal cortex, measured as the immediate (0–20 ms) EEG reaction to TMS, progressively increases with time awake, from morning to evening and after one night of total sleep deprivation, and that it decreases after recovery sleep. By continuously monitoring vigilance, we also found that this modulation in cortical responsiveness is tonic and not attributable to transient fluctuations of the level of arousal. The present results provide noninvasive electrophysiological evidence that wakefulness is associated with a steady increase in the excitability of human cortical circuits that is rebalanced during sleep.
Keywords: compensatory tracking task, EEG, human cortical excitability, sleep deprivation, transcranial magnetic stimulation
Introduction
When we stay awake too long, we become drowsy, we may experience lapses in vigilance, and we feel a general sense of heaviness or tiredness. Objectively, prolonged wakefulness leads to measurable performance impairments at all levels, ranging from simple reaction time tasks (Lim and Dinges 2008) to higher order cognitive functions (Horne 1993; Killgore 2010), including a saturation of learning capacity (Mander et al. 2011). Clinically, staying awake increases the risk for seizures (Gastaut and Tassinari 1966) and the chance to encounter hallucinations (Babkoff et al. 1989), while it may relieve depressive symptoms (Riemann et al. 2002). By an electroencephalographic (EEG) standpoint, prolonged wakefulness is associated with high spectral power in the theta range (4–7 Hz) and with large slow waves (0.5–4.5 Hz) during subsequent sleep (Borbély and Achermann 2005). Altogether, these observations suggest that the state of cortical circuits may change significantly as a function of time awake. Recent in vitro and in vivo animal experiments have found evidence for a net prevalence of synaptic potentiation processes during wakefulness, leading to a gradual buildup of cortical excitability. Thus, prolonged wakefulness has been found to increase the frequency and amplitude of miniature excitatory postsynaptic currents in cortical slices (Liu et al. 2010) and the number and size of central synapses in Drosophila melanogaster (Bushey et al. 2011). In rats, wakefulness has been shown to increase the firing rate and the synchronization of cortical neurons (Vyazovskiy et al. 2009) and the slope of the local field potential (LFP) evoked by electrical cortical stimulation, which is a classic marker of synaptic strength in vivo (Vyazovskiy et al. 2008).
In humans, cortical excitability can be studied by means of transcranial magnetic stimulation (TMS), a noninvasive tool enabling the direct stimulation of cortical neurons. Hence, a number of studies have applied TMS over the motor cortex and have recorded the subsequent surface electromyographic (EMG) activity (TMS-EMG) of peripheral muscles to study the effects of sleep deprivation on motor-evoked potentials (MEPs). These studies did not find any significant modulation of MEPs by time awake in healthy subjects (Manganotti et al. 2001; Sale et al. 2007; Doeltgen and Ridding 2010) or have found conflicting results (Civardi et al. 2001; Manganotti et al. 2001; De Gennaro et al. 2007; Kreuzer et al. 2011).
In the present work, we assessed the excitability of human cortical circuits by an approach that is closer to the one employed in the animal model, where the amplitude and the slope of the early LFP response to cortical stimulation is measured (Bliss and Lomo 1973; Vyazovskiy et al. 2008). In order to do so, we used simultaneous TMS/EEG, a technique that allows measuring directly the local and early electrical response of cortical neurons to TMS, while bypassing subcortical, sensory, and motor pathways. Recent studies have demonstrated that TMS-evoked potentials (TEPs) have a high test–retest reproducibility, provided that the stimulation parameters are controlled by means of a navigation system (Lioumis et al. 2009), and that they can be employed to detect and track changes of cortical excitability over time at the single-subject level (Casarotto et al. 2010). Here, we measured the slope and amplitude of the early (first 20 ms) and local EEG response to TMS during a day of baseline wakefulness, after one night of total sleep deprivation, and after one night of recovery sleep. We found that prolonged wakefulness brings about a significant increase of the immediate EEG response to TMS at the single-subject level and that this increase is rebalanced by one night of recovery sleep.
Materials and Methods
Subjects
The study was approved by the Local Ethical Committee of the Hospital “Luigi Sacco,” Milan and involved 6 healthy volunteers (1 female, age 25–41) who gave their written informed consent. All subjects underwent clinical, neurological, and psychiatric examinations to rule out history or presence of drug/alcohol abuse, major medical/neurological disorders, and exclusion criteria for TMS application. Throughout the protocol, regular meals were scheduled (∼7:30 AM, ∼1:00 PM, ∼7:30 PM), and in-between subjects could watch movies, listen to music, play video games, card, and board games, and interact with the researchers. Participants were not allowed to engage in heavy physical activity, consume caffeine/alcohol and other stimulants, or leave the laboratory area except for short walks under researchers’ supervision.
Experimental Protocol
The entire experimental protocol lasted 4 consecutive night/day cycles, including one regular night/day cycle for adaptation to the lab environment, and was organized as follows (Fig. 1a):
-
1. Baseline night (11:00 PM to 7:00 AM): subjects were sleeping and spontaneous EEG was continuously recorded.
Baseline day (7:00 AM to 11:00 PM): subjects underwent 3 experimental sessions (9:00 AM; 3:00 PM; and 9:00 PM), each encompassing the following measurements: 1) vigilance, by means of the psychomotor vigilance task (PVT, Dinges and Powell 1985; 60 trials), 2) TEPs, and 3) 3 min of spontaneous EEG (eyes open). During the afternoon session (3:00 PM), an additional TEP and spontaneous EEG measurement was carried out while subjects were engaged in the compensatory tracking task (CTT, see below).
-
2. Sleep deprivation night (11:00 PM to 7:00 AM): subjects were totally sleep deprived under the continuous supervision of one experimenter.
Sleep deprivation day (7:00 AM to 11:00 PM): subjects underwent one experimental session at 3:00 PM (PVT, TEPs, TEPs during CTT, EEG, EEG during CTT were recorded). PVT was also administered at 9:00 PM, to measure vigilance at the end of the entire period of prolonged wakefulness.
-
3. Sleep recovery night (11:00 PM to 7:00 AM): spontaneous EEG was continuously recorded while subjects were sleeping.
Sleep recovery day (7:00 AM to 11:00 PM): subjects underwent one experimental session at 3:00 PM (PVT, TEPs, EEG were recorded).
Figure 1.
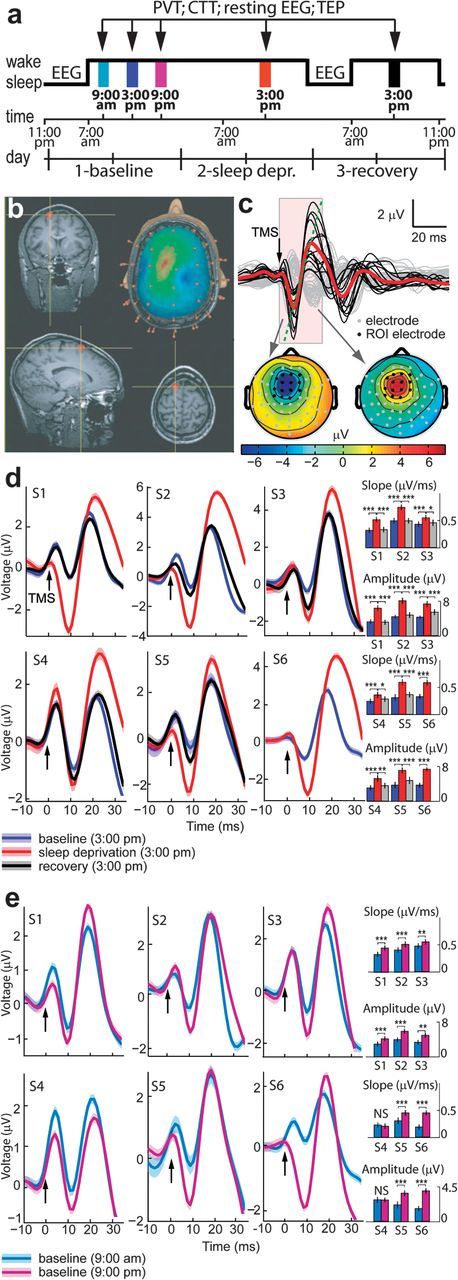
(a) Schedule of the experimental protocol (adaptation night/day cycle is not shown). Black arrows indicate the daytime experimental sessions. EEG was recorded during the baseline and recovery night and during the experimental sessions while collecting resting EEG, CTT, and TEP. (b) TMS was targeted to the left frontal cortex by means of a neuronavigation system that ensured stimulation reproducibility across sessions. (c) Average EEG response to TMS in all channels (top) and instantaneous topographical maps of scalp voltages (bottom) (data from subject 1). Black traces refer to the TEPs recorded from a region of interest (ROI) around the stimulated site (AF1, AFz AF2, F5, F1, Fz, F2, FC3, FC1, FCz, FC2, C3, C1, and Cz channels highlighted in black on the topographical maps below), where TMS evoked a clear negative-to-positive deflection. After averaging the single-trial responses across the channels in the ROI (red trace), cortical excitability was measured as the slope and amplitude of the early negative-to-positive component of the evoked response (from 10 ± 1 to 20 ± 2 ms). (d) Superimposition of TEPs recorded during baseline day, sleep deprivation day, and recovery day for each subject. The measurements were carried out at the same time (3:00 PM) to control for circadian effects. (e) Superimposition of TEPs measured during baseline day, from morning session (9:00 AM) to evening session (9:00 PM) in each subject. (d,e) Black arrows indicate TMS pulses. Bar graphs illustrate average values (±standard error of the mean) of amplitude and slope. Bonferroni-corrected two-tailed paired t-tests between sessions: *P < 0.05, **P < 0.01, ***P < 0.001, NS = not significant. Upper row: subjects 1–3, lower row: subjects 4–6. Shadows around the TEP traces indicate the standard error of the mean. In subject number 6 TEPs from the recovery night could not be analyzed due to technical artifacts.
Three days before the experiment, subjects followed regular bed times to ensure stable circadian entrainment.
TMS Targeting
TMS pulses were generated by a Focal Bipulse 8-Coil (Eximia TMS Stimulator; Nexstim Ltd., Helsinki, Finland) (Fig. 1b). A Navigated Brain Stimulation (NBS) system (Nexstim Ltd., Helsinki, Finland) was used to locate the TMS target on individual structural magnetic resonance images (1-T Phillips scanner, 1 mm3 spatial resolution) and to real-time control the reproducibility of stimulation parameters across sessions (Casarotto et al. 2010). TMS was targeted to the convexity of the middle or caudal portion of the superior frontal gyrus within the left supplementary motor cortex, with the current perpendicular to its main axis. Indeed, the left frontal lobe was previously shown to be most susceptible to sleep deprivation (e.g., Horne 1993). TMS target location was slightly adjusted across subjects to adapt to individual anatomy and to maximally prevent the unwanted activation of muscles and nerves (for individual coordinates, see Supplementary Table 1). In each subject, stimulation intensity was adjusted to deliver an induced electric field between 120 and 130 V/m on the cortical surface, as estimated by the NBS system. In each session, about 200–300 pulses were delivered (mean ± standard deviation [SD] over all sessions: 261 ± 40 pulses) with an interstimulus interval randomly jittered between 600 and 750 ms. This stimulation rate does not induce significant reorganization/plasticity processes that might possibly interfere with the longitudinal measurements (Casarotto et al. 2010).
EEG Recording
EEG was recorded with a 60-channel TMS-compatible amplifier (Nexstim Ltd., Helsinki, Finland), equipped with a proprietary sample-and-hold circuit that prevents TMS-induced artifacts (Virtanen et al. 1999). EEG cap was repositioned before each experimental session, controlling for reproducibility of location using the NBS system. Impedance at all electrodes was always kept below 5 kΩ. Vertical electrooculogram was recorded with 2 additional electrodes to measure eye movements and blinks. Signals were band-pass filtered between 0.1 and 500 Hz and sampled at 1450 Hz. During the TMS stimulation, subjects wore inserted earplugs continuously playing a masking noise that abolished the auditory potentials elicited by TMS-associated clicks (Massimini et al. 2005). Daytime experimental sessions were performed while subjects had their eyes opened and were monitored by video recording.
Compensatory Tracking Task
The goal of the CTT is to keep a cursor on a circular target located in the center of a computer screen, using a trackball input device. The cursor is displaced by 2 forces, a random buffeting force and a radial distraction force. The user must compensate these 2 computer-generated forces by continuously interacting with the trackball. Performance is measured as the distance, in pixels, between the cursor and the target. After a training session performed to avoid learning effects, the CTT allows monitoring continuously the level of vigilance; transitory lapses of vigilance immediately result in temporary increases of the target–cursor distance (Makeig and Jolley 1996). The time courses of target–cursor distances were used to study the correlation between short-term fluctuations in the vigilance level and changes in TEPs and spontaneous EEG, as described below.
Data Analysis
Data were analyzed using MATLAB (The Mathworks Inc., Natick, MA).
Continuous EEG recordings gathered during TMS stimulation were split into epochs between −80 and 300 ms around TMS pulses. Single trials and channels contaminated by artifacts or eye movements were rejected following a semi-automatic procedure (Casarotto et al. 2010). Altogether, 213 ± 35 trials (mean ± SD across all sessions and subjects) were analyzed. Then, EEG recordings were band-pass filtered between 2 and 80 Hz, downsampled at 725 Hz, and rereferenced to the average reference. To evaluate cortical excitability, we focused on the first large EEG component triggered by TMS. This component was highly reproducible across subjects and was invariably comprised between a negative deflection at 10 ± 1 ms and a positive deflection at 20 ± 2 ms (±SD across subjects), mainly detectable at electrodes AF1, AFz AF2, F5, F1, Fz, F2, FC3, FC1, FCz, FC2, C3, C1, and Cz on the grand average (Fig. 1c for a single-subject example). A set of 14 region of interest electrodes was individually selected to account for the small interindividual differences of coil position and was kept constant across sessions in each subject. TEPs were averaged in space across this set of sensors, and their single-trial peak-to-peak amplitude and slope (mean first derivative of the rising segment as in Vyazovskiy et al. 2008) were calculated (see Supplementary Fig. 1). At the single-subject level, significant differences of amplitude and slope between session pairs were assessed by two-tailed two-sample t-tests applied to the corresponding single-trial measurements (n ∼ 180–260). The obtained P values were Bonferroni-corrected with factor 5 (5 comparisons of interest: 1) baseline morning [9:00 AM] vs. baseline evening [9:00 PM], 2) baseline afternoon [3:00 PM] vs. sleep deprivation afternoon [3:00 PM], 3) baseline evening [9:00 PM] vs. sleep deprivation afternoon [3:00 PM], 4) sleep deprivation afternoon [3:00 PM] vs. recovery afternoon [3:00 PM], 5) baseline afternoon [3:00 PM] vs. recovery afternoon [3:00 PM]). At the group level, amplitude and slope changes were assessed by Friedman's nonparametric analysis of variance (ANOVA) followed by Fisher's least significant difference test for post hoc paired comparisons. Changes in sleep stages and slow wave activity (log transformed, averaged across all electrodes) were assessed by two-tailed paired t-tests.
Waking spontaneous EEG was analyzed to quantify the spectral power in the theta frequency range (4–7 Hz). Continuous EEG recordings were rereferenced to the average reference and divided into 4-s epochs. Power spectra were computed by Fast Fourier transform (FFT, frequency resolution 0.25 Hz) for each subject and session and were then averaged over epochs, accepted channels, and frequency bins in the theta frequency range (4–7 Hz). Spontaneous EEG theta power as well as PVT performance were compared among sessions at the group level by Friedman's nonparametric ANOVA followed by Fisher's least significant difference test. In the case of PVT, statistics were computed on the 10th percentile of the longest reaction time.
Overnight recordings were sleep staged in 20-s epochs according to standard criteria (American Academy of Sleep Medicine standard criteria; Iber et al. 2007), and power spectra were calculated for continuous 20-s epochs for all channels (FFT routine).
Single-trial amplitude and slope of the first TMS-evoked EEG component and single-epoch theta power of spontaneous EEG were likewise computed for the recordings obtained during CTT. Moreover, single-trial TEP measurements as well as single-epoch theta power of spontaneous EEG were correlated with the concurrent level of performance. Single-trial task performance was computed as the mean distance of the tracker ball from the target in the temporal window between −1 and 2 s around TMS pulses and in the 4-s long epochs of spontaneous EEG, respectively. In order to test whether short-term fluctuations in vigilance were related to cortical excitability and EEG slowing, single-trial task performance was correlated with TEP measurements and theta power of spontaneous EEG by applying the Pearson's correlation coefficient.
Results
All subjects showed good sleep as verified by standard scoring of the sleep EEG (American Academy of Sleep Medicine standard criteria; Iber et al. 2007). Sleep in the recovery night showed the typical response to sleep deprivation, which included a shortened latency to the first occurrence of nonrapid eye movement sleep stage N2 (sleep deprivation, 5.8 ± 1.1 min; baseline, 12.1 ± 1.1 min; P < 0.05), reduced waking (sleep deprivation, 5.4 ± 0.9 min; baseline, 12.6 ± 1.0 min; P < 0.005), and a global increase in spectral power in the slow-wave frequency range (1–4.5 Hz; Supplementary Fig. 2).
After one night of sleep deprivation, the slope and amplitude of the early (10–20 ms) TEP, measured at the same time of day (3:00 PM), increased significantly (P < 0.001) in each subject; the response returned to the baseline level after one night of recovery sleep (Fig. 1d for single-subject level statistics, Table 1 and Fig. 2 for group-level statistics). A progressive increase of the cortical response was also observed during 12 h of baseline wakefulness, from morning (9:00 AM) to evening (9:00 PM), reaching significance in 5 subjects of 6 (Fig. 1e). In all cases, TEPs were significantly (P < 0.001) larger in the afternoon (3:00 PM) after sleep deprivation compared with the previous evening (9:00 PM). Thus, staying awake brought about a gradual increase of cortical excitability that was measurable and significant at the single-subject level; this increase was reverted by one night of recovery sleep. Mean slope and amplitude changes across sessions were significantly correlated at the single-subject level (Pearson's correlation coefficient 0.93 ± 0.02 mean ± SD across subjects; P < 0.001). Supplementary Figure 3 shows the grand average TEP in all conditions.
Table 1.
Nonparametric group analysis
| Baseline | Sleep deprivation | Sleep recovery | Friedman’s ANOVA | ||||
| 9:00 AM | 3:00 PM | 9:00 PM | 3:00 PM | 3:00 PM | χ2(4) | P | |
| Amplitude (μV) | 2.43 ± 0.65 | 3.58 ± 0.99 | 4.12 ± 0.98 | 6.52 ± 1.30 | 3.62 ± 0.68 | 19.03 | <0.0008 |
| Slope (μV/ms) | 0.32 ± 0.11 | 0.37 ± 0.11 | 0.4 3± 0.13 | 0.56 ± 0.14 | 0.40 ± 0.10 | 18.53 | <0.001 |
| Theta power (μV2) | 1.01 ± 0.32 | 1.11 ± 0.45 | 1.06 ± 0.35 | 1.65 ± 0.62 | 1.17 ± 0.41 | 10.24 | <0.037 |
Note: Data are mean ± SD.
Figure 2.

Modulation of TEP slope (a), TEP amplitude (b), theta power of eyes-open spontaneous EEG (c), and PVT performance (d) as a function of time spent awake. Values are mean ± standard error of the mean over subjects. Bonferroni-corrected two-tailed paired t-tests between sessions: *P < 0.05, **P < 0.01, ***P < 0.001. Red bar indicates a night of sleep deprivation and blue bar a night of recovery sleep.
Figure 2 shows group-level results and allows comparing the modulation of early TEPs during prolonged wakefulness with the corresponding modulation of spontaneous EEG theta power and of PVT performance. While TEP amplitude and slope increased significantly (P < 0.01) already from morning to evening during the baseline day and increased further in the afternoon after sleep deprivation (Fig. 2a,b), theta power showed a significant increase after sleep deprivation but no modulation during baseline day (Fig. 2c). Similarly, PVT reaction time did not change during baseline day and increased significantly only in the evening preceding the recovery sleep, when vigilance is maximally affected by the entire period of prolonged wakefulness (Fig. 2d).
Typically, after a period of prolonged wakefulness, subjects tend to fall into short-lasting (tens of seconds) episodes of drowsiness that are associated with severe performance impairment and with transient increases of low theta (4–5 Hz) EEG power (Makeig and Inlow 1993). To test whether these transient lapses affected our electrophysiological results, during the baseline afternoon (3:00 PM) and the sleep deprivation afternoon (3:00 PM) sessions, we additionally collected TEPs and spontaneous EEG while subjects were engaged in the CTT task (Makeig and Inlow 1993), which continuously monitored their level of vigilance (Fig. 3a). In agreement with previous studies (Makeig and Inlow 1993; Makeig et al. 2000), poor CTT performance significantly correlated (P < 0.05) with increased spontaneous EEG theta power on a trial-by-trial basis in each subject (data not shown). Conversely, no significant correlation was detected between single-trial task performance and either TEP slope or amplitude (P > 0.05) in each subject. As shown in Figure 3b, the amplitude of single-trial cortical responses was tonically increased in all subjects after sleep deprivation, irrespective of the concurrent performance/vigilance level.
Figure 3.
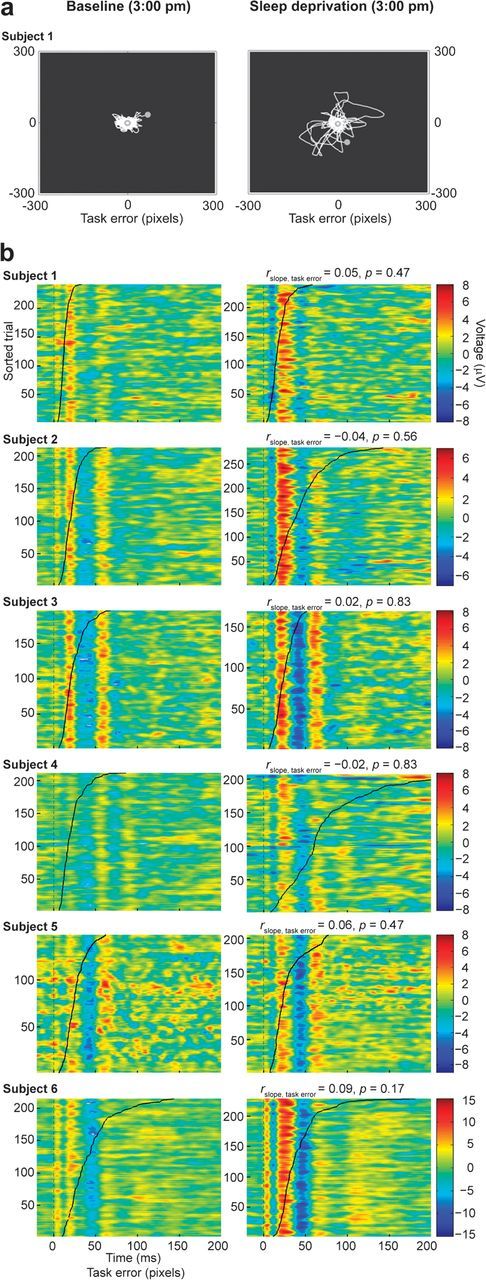
(a) Example of the trajectory of the tracker ball during a visuomotor compensatory tracking task session (subject 1) performed at 3:00 PM in the baseline afternoon (left) and in the sleep deprivation afternoon (right). Sleep deprivation was associated with transient lapses of vigilance and decreases in task performance, as shown by the higher distance of the tracker ball from the target. (b) Single-trial TEPs (amplitude is color coded) sorted according to the corresponding task error value (black curve) are shown for each subject (a moving average filter spanning 5 trials was applied for visualization purposes only). TMS pulses occur at 0 ms. The superimposed black curve shows the single-trial task error value, measured in pixels, sorted in ascending order. Task error did not correlate significantly with the amplitude and slope of TEPs in any subject.
Discussion
The present measurements reveal, for the first time in humans, that the immediate cortical response to direct stimulation increases progressively with time awake. This modulation is significant at the single-subject level and appears to reflect a steady accumulation of cortical excitability occurring during wakefulness rather than transient fluctuations due to lapses of vigilance. The fact that TMS/EEG revealed a clear-cut modulation of cortical responsiveness at the individual level, whereas previous works, employing single or paired-pulse TMS in combination with electromyography, found more variable results may have different explanations. First, TMS/EEG and TMS/EMG are 2 complementary approaches that capture different aspects of cortical excitability with different sensitivity. In this specific case, we hypothesize that TMS/EEG assesses the responsiveness of cortical neurons in a way that is more similar to the one classically employed in animals (electrical stimulation combined with field potential recordings) by measuring the immediate cortical electrical response to a trans-synaptic stimulation. This may be the reason why TMS/EEG better replicates animal studies of cortical excitability after sleep deprivation when compared with TMS/EMG. Second, using TMS/EEG one can probe directly the excitability of frontal associative areas (as it was done in the present study), whereas TMS/EMG measurements are necessarily confined to the motor cortex. Since prolonged wakefulness and sleep deprivation in humans are known to have a prominent effect on frontal cortical circuits (Horne 1993), TMS/EEG on frontal cortex may be more sensitive to these changes than TMS/EMG on motor cortex. In order to directly test this hypothesis, future studies should be designed to evaluate how the excitability of different cortical areas (frontal and occipital, primary and associative) changes as a function of prolonged wakefulness. To this regard, a consistent increase of motor cortex excitability was found when TMS/MEP (Manganotti et al. 2006) and TMS/EEG (Del Felice et al. 2011) measurements were carried out in sleep-deprived patients with juvenile myoclonic epilepsy.
In the animal model, changes in slope and amplitude of the first LFP component elicited by electrical stimulation of cortical axons reflect changes in excitability related to the strengthening or weakening of cortical synapses. Accordingly, in vivo long-term potentiation (LTP)-inducing procedures increase LFP amplitude and slope (Bliss and Lomo 1973), whereas long-term depression (LTD) procedures reduce it (Kirkwood et al. 1993). We suggest that noninvasive cortical stimulations and recordings by showing correlated changes of slope and amplitude may capture changes in synaptic efficacy occurring in the human brain. Accordingly, the induction of LTP-like modifications in human cortical circuits, by means of high-frequency TMS protocols, results in a clear-cut increase of early-latency TEPs (starting from 5 to 15 ms) (Esser et al. 2006; Veniero et al. 2010). Hence, it is possible that also in humans, as in animal models (Vyazovskiy et al. 2008; Liu et al. 2010), the progressive enhancement of the immediate neuronal (EEG) reaction to TMS may reflect an overall buildup of synaptic strength occurring during wakefulness. As suggested by computer models (Olcese et al. 2010), this progressive strengthening of cortical connections occurring during wakefulness may be linked to the increase of slow wave activity (SWA; 0.5–4.5 Hz) that is normally observed during subsequent sleep (Borbély and Achermann 2005). Accordingly, we found preliminary evidence that the changes in the slope of TEPs and the changes in sleep SWA may be related (Supplementary Fig. 2).
Clearly, inferring on cortical plastic changes in humans based on noninvasive measurements alone is not warranted, and alternative mechanisms, accounting for the observed increase of TEPs, should be considered. In principle, changes in the membrane potential of cortical neurons can also affect the responsiveness of cortical neurons (Rector et al. 2009). For example, decreasing levels of activating neuromodulators during prolonged wakefulness may render cortical neurons hyperpolarized or bistable and thus more prone to react to TMS with a high-amplitude synchronous burst of activity (Hill and Tononi 2005). On the other hand, changes in glutamate and monoamines may affect cortical excitability. Notably, fixed-potential amperometry in freely behaving rats showed a progressive increase in glutamate release from the cortex during prolonged wakefulness (Dash et al. 2009), and in vivo microdialysis in freely moving rats showed increased levels of extracellular serotonin and dopamine in the basal forebrain (Zant et al. 2011). Both observations could be associated with increased excitability. While amperometry can be performed only in animal models, forced desynchrony protocols in humans (Cajochen et al. 2002) may be performed in order to define a possible contribution of neuromodulation and circadian factors to the observed changes of TEPs. Another mechanism that may contribute to the observed increase of TEPs is a shift toward excitation in the inhibition/excitation balance in cortical circuits. Accordingly, in spite of a number of works reporting negative results (Manganotti et al. 2001; Sale et al. 2007; Doeltgen and Ridding 2010), 2 studies, employing TMS-elicited MEPs (Civardi et al. 2001; Kreuzer et al. 2011), detected a significant decrease of short-term intracortical inhibition occurring, at the group level, after 24 h of sleep deprivation.
Whether the present results are primarily contributed by synaptic plasticity, changes in neuromodulation, or impaired inhibition, they point to a novel electrophysiological correlate of sleep pressure in humans: a progressive buildup of cortical excitability that is rebalanced by subsequent sleep. Notably, as illustrated in Figure 1, not only the observed changes are repeatable across subjects but they are also statistically significant in single individuals. Such a strong effect is not frequent in neuroimaging and evoked potentials studies, where group-level analysis is often needed to detect significant results. In this perspective, measuring changes in cortical excitability by means of TMS/EEG may represent a novel electrophysiological approach to study sleep efficiency, the susceptibility to prolonged wakefulness, as well as the mechanisms of insomnia at the individual level (van der Werf et al. 2010). Hence, future studies should be performed on larger and more heterogeneous (gender, age) populations, possibly including insomniacs and depressed patients. Practically, measuring TEPs offers some interesting advantages. Compared with slow-wave activity, the classic marker of sleep pressure, TEPs can be measured at any time during wakefulness without requiring subjects to fall asleep. Compared with theta power, an EEG correlate of sleep need and sleepiness that can be measured during wakefulness (Finelli et al. 2000), TEPs seem to be more sensitive to sleep pressure (their amplitude increased significantly already during the baseline day) but not affected by transient fluctuations in the level of arousal (Fig. 3). More generally, the present findings suggest that, in humans, sleep may contribute to keep cortical excitability under control and provide a plausible mechanism for the well-known effects that sleep deprivation has on seizures, hallucinations, and depressive symptoms.
Supplementary Material
Supplementary material can be found at: http://www.cercor.oxfordjournals.org/
Funding
This work was supported by grants from the European Union (LSHM-CT-2005-518189) and from the Italian Ministry for Education, University and Research (PRIN2006) to M.M.; from the National Institute of Health (Director Pioneer Award) to G.T.; from the Swiss National Science Foundation (PP00A3-114923) to R.H.; from the Academy of Finland (121167) and the International Doctoral Programme in Biomedical Engineering and Medical Physics to H.M.; from the Department of Clinical Sciences “L. Sacco”, Università degli Studi di Milano co-funded by “Dote ricerca”: Fondo Sociale Europeo, Regione Lombardia to S.C.
Acknowledgments
Conflict of Interest : None declared.
References
- Babkoff H, Sing HC, Thorne DR, Genser SG, Hegge FW. Perceptual distortions and hallucinations reported during the course of sleep deprivation. Percept Mot Skills. 1989;68:787–798. doi: 10.2466/pms.1989.68.3.787. [DOI] [PubMed] [Google Scholar]
- Bliss TV, Lomo T. Long-lasting potentiation of synaptic transmission in the dentate area of the anaesthetized rabbit following stimulation of the perforant path. J Physiol. 1973;232(2):331–356. doi: 10.1113/jphysiol.1973.sp010273. [DOI] [PMC free article] [PubMed] [Google Scholar]
- Borbély AA, Achermann P. Sleep homeostasis and models of sleep regulation. In: Kryger MH, Roth T, Dement WC, editors. Principles and practice of sleep medicine. Philadelphia: Elsevier Saunders; 2005. pp. 405–417. [Google Scholar]
- Bushey D, Tononi G, Cirelli C. Sleep and synaptic homeostasis: structural evidence in Drosophila. Science. 2011;332(6037):1576–1581. doi: 10.1126/science.1202839. [DOI] [PMC free article] [PubMed] [Google Scholar]
- Cajochen C, Wyatt JK, Czeisler CA, Dijk DJ. Separation of circadian and wake duration-dependent modulation of EEG activation during wakefulness. Neuroscience. 2002;114(4):1047–1060. doi: 10.1016/s0306-4522(02)00209-9. [DOI] [PubMed] [Google Scholar]
- Casarotto S, Romero Lauro LJ, Bellina V, Casali AG, Rosanova M, Pigorini A, Defendi S, Mariotti M, Massimini M. EEG responses to TMS are sensitive to changes in the perturbation parameters and repeatable over time. PLoS One. 2010;5(4):e10281. doi: 10.1371/journal.pone.0010281. [DOI] [PMC free article] [PubMed] [Google Scholar]
- Civardi C, Boccagni C, Vicentini R, Bolamperti L, Tarletti R, Varrasi C, Monaco F, Cantello R. Cortical excitability and sleep deprivation: a transcranial magnetic stimulation study. J Neurol Neurosurg Psychiatry. 2001;71(6):809–812. doi: 10.1136/jnnp.71.6.809. [DOI] [PMC free article] [PubMed] [Google Scholar]
- Dash MB, Douglas CL, Vyazovskiy VV, Cirelli C, Tononi G. Long-term homeostasis of extracellular glutamate in the rat cerebral cortex across sleep and waking states. J Neurosci. 2009;29(3):620–629. doi: 10.1523/JNEUROSCI.5486-08.2009. [DOI] [PMC free article] [PubMed] [Google Scholar]
- De Gennaro L, Marzano C, Veniero D, Moroni F, Fratello F, Curcio G, Ferrara M, Ferlazzo F, Novelli L, Concetta Pellicciari M, et al. Neurophysiological correlates of sleepiness: a combined TMS and EEG study. Neuroimage. 2007;36(4):1277–1287. doi: 10.1016/j.neuroimage.2007.04.013. [DOI] [PubMed] [Google Scholar]
- Del Felice A, Fiaschi A, Bongiovanni GL, Savazzi S, Manganotti P. The sleep-deprived brain in normals and patients with juvenile myoclonic epilepsy: a perturbational approach to measuring cortical reactivity. Epilepsy Res. 2011;96(1–2):123–131. doi: 10.1016/j.eplepsyres.2011.05.015. [DOI] [PubMed] [Google Scholar]
- Dinges DF, Powell JW. Microcomputer analyses of performance on a portable, simple visual RT during sustained operations. Behav Res Methods Instrum Comput. 1985;17(6):652–655. [Google Scholar]
- Doeltgen SH, Ridding MC. Behavioural exposure and sleep do not modify corticospinal and intracortical excitability in the human motor system. Clin Neurophysiol. 2010;121(3):448–452. doi: 10.1016/j.clinph.2009.11.085. [DOI] [PubMed] [Google Scholar]
- Esser SK, Huber R, Massimini M, Peterson MJ, Ferrarelli F, Tononi G. A direct demonstration of cortical LTP in humans: a combined TMS/EEG study. Brain Res Bull. 2006;69(1):86–94. doi: 10.1016/j.brainresbull.2005.11.003. [DOI] [PubMed] [Google Scholar]
- Finelli LA, Baumann H, Borbély AA, Achermann P. Dual electroencephalogram markers of human sleep homeostasis: correlation between theta activity in waking and slow-wave activity in sleep. Neuroscience. 2000;101:523–529. doi: 10.1016/s0306-4522(00)00409-7. [DOI] [PubMed] [Google Scholar]
- Gastaut H, Tassinari CA. Triggering mechanisms in epilepsy. The electroclinical point of view. Epilepsia. 1966;7(2):85–138. doi: 10.1111/j.1528-1167.1966.tb06262.x. [DOI] [PubMed] [Google Scholar]
- Hill S, Tononi G. Modeling sleep and wakefulness in the thalamocortical system. J Neurophysiol. 2005;93(3):1671–1698. doi: 10.1152/jn.00915.2004. [DOI] [PubMed] [Google Scholar]
- Horne JA. Human sleep, sleep loss and behaviour: implications for the prefrontal cortex and psychiatric disorder. Br J Psychiatry. 1993;162:413–419. doi: 10.1192/bjp.162.3.413. [DOI] [PubMed] [Google Scholar]
- Iber C, Ancoli-Israel S, Chesson AL, Quan SF. The AASM manual for the scoring of sleep and associated events: rules, terminology and technical specifications. Westchester (IL): American Academy of Sleep Medicine; 2007. [Google Scholar]
- Killgore WD. Effects of sleep deprivation on cognition. Prog Brain Res. 2010;185:105–129. doi: 10.1016/B978-0-444-53702-7.00007-5. [DOI] [PubMed] [Google Scholar]
- Kirkwood A, Dudek SM, Gold JT, Aizenman CD, Bear MF. Common forms of synaptic plasticity in the hippocampus and neocortex in vitro. Science. 1993;260(5113):1518–1521. doi: 10.1126/science.8502997. [DOI] [PubMed] [Google Scholar]
- Kreuzer P, Langguth B, Popp R, Raster R, Busch V, Frank E, Hajak G, Landgrebe M. Reduced intra-cortical inhibition after sleep deprivation: a transcranial magnetic stimulation study. Neurosci Lett. 2011;493(3):63–66. doi: 10.1016/j.neulet.2011.02.044. [DOI] [PubMed] [Google Scholar]
- Lim J, Dinges DF. Sleep deprivation and vigilant attention. Ann N Y Acad Sci. 2008;1129:305–322. doi: 10.1196/annals.1417.002. [DOI] [PubMed] [Google Scholar]
- Lioumis P, Kičić D, Savolainen P, Mäkelä JP, Kähkönen S. Reproducibility of TMS-evoked EEG responses. Hum Brain Mapp. 2009;30(4):1387–1396. doi: 10.1002/hbm.20608. [DOI] [PMC free article] [PubMed] [Google Scholar]
- Liu ZW, Faraguna U, Cirelli C, Tononi G, Gao XB. Direct evidence for wake-related increases and sleep-related decreases in synaptic strength in rodent cortex. J Neurosci. 2010;30(25):8671–8675. doi: 10.1523/JNEUROSCI.1409-10.2010. [DOI] [PMC free article] [PubMed] [Google Scholar]
- Makeig S, Inlow M. Lapses in alertness: coherence of fluctuations in performance and EEG spectrum. Electroencephalogr Clin Neurophysiol. 1993;86(1):23–35. doi: 10.1016/0013-4694(93)90064-3. [DOI] [PubMed] [Google Scholar]
- Makeig S, Jolley M. Technical document 96-3C. San Diego (CA): Naval Health Research Center; 1996. COMPTRACK: a compensatory tracking task for monitoring alertness. [Google Scholar]
- Makeig S, Jung TP, Sejnowski TJ. Awareness during drowsiness: dynamics and electrophysiological correlates. Can J Exp Psychol. 2000;54(4):266–273. doi: 10.1037/h0087346. [DOI] [PubMed] [Google Scholar]
- Mander BA, Santhanam S, Saletin JM, Walker MP. Wake deterioration and sleep restoration of human learning. Curr Biol. 2011;21(5):R183–R184. doi: 10.1016/j.cub.2011.01.019. [DOI] [PMC free article] [PubMed] [Google Scholar]
- Manganotti P, Bongiovanni LG, Fuggetta G, Zanette G, Fiaschi A. Effects of sleep deprivation on cortical excitability in patients affected by juvenile myoclonic epilepsy: a combined transcranial magnetic stimulation and EEG study. J Neurol Neurosurg Psychiatry. 2006;77(1):56–60. doi: 10.1136/jnnp.2004.041137. [DOI] [PMC free article] [PubMed] [Google Scholar]
- Manganotti P, Palermo A, Patuzzo S, Zanette G, Fiaschi A. Decrease in motor cortical excitability in human subjects after sleep deprivation. Neurosci Lett. 2001;304(3):153–156. doi: 10.1016/s0304-3940(01)01783-9. [DOI] [PubMed] [Google Scholar]
- Massimini M, Ferrarelli F, Huber R, Esser SK, Singh H, Tononi G. Breakdown of cortical effective connectivity during sleep. Science. 2005;309(5744):2228–2232. doi: 10.1126/science.1117256. [DOI] [PubMed] [Google Scholar]
- Olcese U, Esser SK, Tononi G. Sleep and synaptic renormalization: a computational study. J Neurophysiol. 2010;104(6):3476–3493. doi: 10.1152/jn.00593.2010. [DOI] [PMC free article] [PubMed] [Google Scholar]
- Rector DM, Schei JL, Rojas MJ. Mechanisms underlying state dependent surface-evoked response patterns. Neuroscience. 2009;159(1):115–126. doi: 10.1016/j.neuroscience.2008.11.031. [DOI] [PMC free article] [PubMed] [Google Scholar]
- Riemann D, Voderholzer U, Berger M. Sleep and sleep-wake manipulations in bipolar depression. Neuropsychobiology. 2002;45(Suppl 1):7–12. doi: 10.1159/000049255. [DOI] [PubMed] [Google Scholar]
- Sale MV, Ridding MC, Nordstrom MA. Factors influencing the magnitude and reproducibility of corticomotor excitability changes induced by paired associative stimulation. Exp Brain Res. 2007;181(4):615–626. doi: 10.1007/s00221-007-0960-x. [DOI] [PubMed] [Google Scholar]
- van der Werf YD, Altena E, van Dijk KD, Strijers RL, De Rijke W, Stam CJ, van Someren EJ. Is disturbed intracortical excitability a stable trait of chronic insomnia? A study using transcranial magnetic stimulation before and after multimodal sleep therapy. Biol Psychiatry. 2010;68(10):950–955. doi: 10.1016/j.biopsych.2010.06.028. [DOI] [PubMed] [Google Scholar]
- Veniero D, Maioli C, Miniussi C. Potentiation of short-latency cortical responses by high-frequency repetitive transcranial magnetic stimulation. J Neurophysiol. 2010;104(3):1578–1588. doi: 10.1152/jn.00172.2010. [DOI] [PubMed] [Google Scholar]
- Virtanen J, Ruohonen J, Näätänen R, Ilmoniemi RJ. Instrumentation for the measurement of electric brain responses to transcranial magnetic stimulation. Med Biol Eng Comput. 1999;37(3):322–326. doi: 10.1007/BF02513307. [DOI] [PubMed] [Google Scholar]
- Vyazovskiy VV, Cirelli C, Pfister-Genskow M, Faraguna U, Tononi G. Molecular and electrophysiological evidence for net synaptic potentiation in wake and depression in sleep. Nat Neurosci. 2008;11(2):200–208. doi: 10.1038/nn2035. [DOI] [PubMed] [Google Scholar]
- Vyazovskiy VV, Olcese U, Lazimy YM, Faraguna U, Esser SK, Williams JC, Cirelli C, Tononi G. Cortical firing and sleep homeostasis. Neuron. 2009;63(6):865–878. doi: 10.1016/j.neuron.2009.08.024. [DOI] [PMC free article] [PubMed] [Google Scholar]
- Zant JC, Leenaars CH, Kostin A, Van Someren EJ, Porkka-Heiskanen T. Increases in extracellular serotonin and dopamine metabolite levels in the basal forebrain during sleep deprivation. Brain Res. 2011;1399:40–48. doi: 10.1016/j.brainres.2011.05.008. [DOI] [PubMed] [Google Scholar]