Summary
Background
The proper diagnosis and management of patients after surgery for pituitary tumors are of great importance in clinical practice. The purpose of this study was to investigate the magnetic resonance features of the postoperative sella with fast spin echo T2-weighted imaging and to evaluate the benefits of this sequence compared to the classically performed contrast-enhanced T1-weighted imaging at 1.5T unit.
Material/Methods
The study group consisted of 101 patients who underwent resection of pituitary tumors. There were 58 women (57.4%), aged 22 to 75 (mean age, 52.67 years) and 43 men (42.6%), aged 21 to 79 (mean age, 49 years). In all patients preoperative and multiple postoperative MR studies were performed. Post-contrast T1 and pre-contrast T2 images were interpreted by 2 independent readers (neuroradiologists).
Results
Contrast-enhanced T1-weighted imaging was significantly superior to T2-weighted imaging in assessment of infundibulum (p<0.05). There was no statistically significant difference for each of readers between T1- and T2-weighted images regarding to the following features: visualization of residual pituitary gland (p=0.062 and p=0.368), contours of pituitary (p=0.959 and p=0.265), optic chiasm (p=0.294 and p=0.843), and visualization of presence of residual tumor (p=0.204 and p=0.169). T2-weighted images were significantly superior to contrast-enhanced T1-weighted imaging with regard to visualization of contours of residual tumors (p<0.05).
Conclusions
T2-weighted images may help to discriminate tumorous from non-tumorous involvement of the postoperative sella and the sphenoid sinus. T2-weighted images are also very useful for a long time after the resection in the postoperative evaluation of the implanted muscle with fascia.
Keywords: pituitary gland, residual tumor, magnetic resonance imaging, T2-weighted imaging
Background
Introduction of imaging modalities, especially magnetic resonance (MR), and of modern methods of neurosurgery and pharmacotherapy revolutionized diagnosis and therapy of pituitary tumors. Currently, MR is the method of choice for imaging of the pituitary gland and the perisellar area. Advanced MR techniques – MR diffusion, MR spectroscopy and MR perfusion – have been increasingly applied [1–12].
Pituitary adenomas are common neoplasms, accounting for 15–20% of all diagnosed intracranial tumors [13]. The proper diagnosis and management of patients with pituitary tumors are of high importance in clinical practice [14–17].
MR imaging protocol of pituitary and sellar region including postoperative studies usually consists of unenhanced and enhanced T1-weighted images in coronal and sagittal planes. T2-weighted unenhanced images are also performed sometimes, but most authors have reported postoperative studies of the sellar region using only T1-weighted images [18–20]. There are only a few papers concerning applications of T2-weighted sequences in imaging of the postoperative sella [21–23]. Nakasu et al found that T2-weighted imaging could be a reliable and sufficient method to assess the sella in patients after pituitary surgery [21]. In the literature there is still disagreement whether T2-weighted images are useful in assessment of the sellar region after resection of pituitary tumors.
The purpose of this study was to investigate the magnetic resonance features of the postoperative sella with fast spin echo (FSE) T2-weighted imaging (T2) and to evaluate the benefits of this sequence compared to the classically performed contrast-enhanced T1-weighted imaging (T1+C) on a 1.5T unit. The aim of our study was also to assess whether T2 sequence could replace T1-weighted images after contrast administration. If so, it could lead to reduced use of contrast material. This could be especially useful in patients with high risk of nephrogenic systemic fibrosis (NSF) [24].
Material and Methods
Patient population
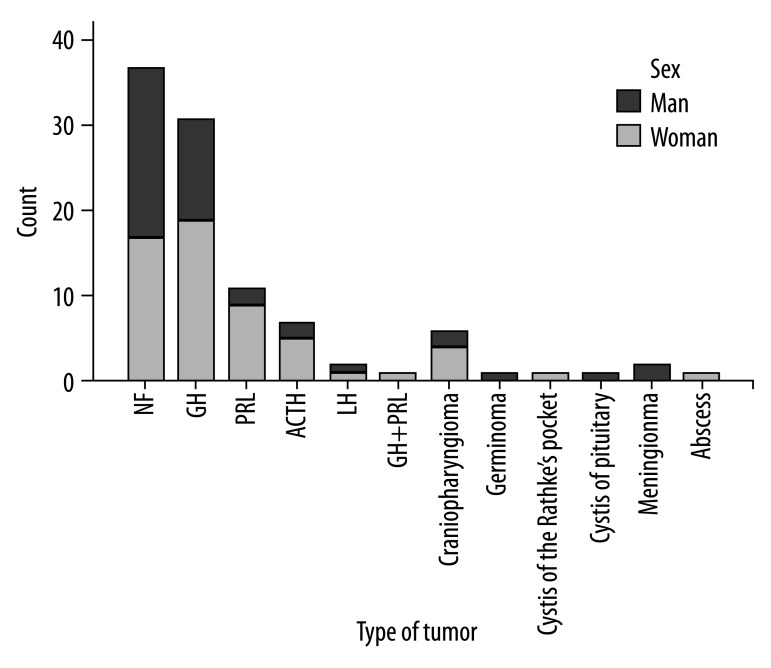
The study group consisted of 101 patients who underwent resection of pituitary tumors with the following diagnoses: pituitary adenoma (89 cases), pituitary abscess (1 case), Rathke’s cleft cyst (1 case), pituitary cyst (1 case), germinoma (1 case), craniopharyngioma (6 cases) and meningioma (2 cases). Among 89 pituitary adenomas there were: 37 hormonally inactive (NF-nonfunctioning) adenomas, 31 growth hormone- (GH) secreting adenomas, 11 prolactin- (PRL) secreting adenomas, 7 adrenocorticotropin- (ACTH) secreting adenomas, 2 luteotropin- (LH) secreting adenomas and 1 case of GH- and PRL-secreting adenoma.
In the study group there were 58 women (57.4%) aged 22 to 75 years (mean 52.67) and 43 men (42.6%) aged 21 to 79 years (mean 49). Overall age of the analysed patients ranged from 21 to 79 years (mean 51.1). Because the patients were observed prospectively, patient’s age at the time of surgery was considered. Types of pituitary tumors in the analysed material with regard to patient’s sex are presented in Figure 1.
Figure 1.
Types of pituitary tumours and their sex distribution.
In all patients preoperative and multiple postoperative MR studies were performed. The number of postoperative examinations ranged from 1 to 8 (mean 3).
The duration of the follow-up – from the moment of the operation until the last MRI study –ranged from 3 to 348 months (mean 70.8). Seventy-three patients were operated only once; in these cases we used follow-up studies and endocrinological assessment to confirm our diagnosis. Twenty-eight patients underwent more than 1 surgery; in these cases we had histopathological confirmation of the MR findings performed after the first operation.
Imaging technique
Imaging was performed using the 1.5T MR unit. Each study began with a single pilot image and 3 localization images, followed by T1-weighetd images in coronal and sagittal planes, using the FAST sequence (Fourier acquired steady-state sequence) and fast spin echo (FSE) T2-weighted coronal images. Technical parameters of those images are presented in Table 1.
Table 1.
Technical parameters of T1- and T2-weighted images in the pituitary gland examination.
| Sequence | FAST T1-weighted | FAST T1-weighted | FSE T2-weighted |
|---|---|---|---|
| Plane | Coronal | Sagittal | Coronal |
| Repetition time – TR (ms) | 229 | 229 | 2500 |
| Echo time – TE (ms) | 4.5 | 4.5 | 96.0 |
| Slice thickness (mm)/gap | 2.5/0.5 | 2.5/0.5 | 2.5/0.5 |
| Number of acquisitions – NSA | 2 | 2 | 2 |
| Matrix | 256×256 | 256×256 | 256×256 |
| Field of view – FOV (cm) | 17.0 | 18.0 | 17.0 |
| Acquisition time (min) | 01:57 | 02:18 | 02:40 |
Paramagnetic contrast medium was administered intravenously in each patient, at a dose of 0.1 ml/kg BW, and post-contrast T1-weighted images were taken in coronal and sagittal planes.
Data analysis
Post-contrast T1 and pre-contrast T2 images were interpreted by 2 independent readers (neuroradiologists) using the following criteria for assessing particular features: 0 – non-visible, 1 – visible, but not clearly; 2 – clearly visible; 3 – excellently visible. The following features of the postoperative sella were evaluated: presence of pituitary, contours of pituitary (i.e. visible border between the pituitary gland and the cavernous sinus or residual mass if present), infundibulum, optic chiasm, presence of residual tumor, contours of residual tumor (visible border between the residual tumor and pituitary gland or the cavernous sinus). Appearance of the postoperative sphenoid sinus (implanted materials, fluid collections) was also described. Implanted materials (muscle with fascia) were used only in 3 patients; therefore this feature was excluded from the statistical analysis.
The pituitary gland persistent after operation was recognised by homogeneous low signal intensity on T2-weighted images and homogeneous contrast enhancement on T1-weighted images, as well as by its anatomic relationship to the infundibulum on T1-weighted images. Residual tumor was differentiated from postoperative changes by means of location, pattern of signal intensity and enhancement presented on preoperative images. Fluid collection was diagnosed when a cyst-like area was found in the surgical cavity and underwent resorption during the follow-up period. As was known from the surgical reports, 3 patients had muscle with fascia implanted into sphenoid sinus.
Results of visual assessment by 2 independent readers were analyzed using Wilcoxon Signed Ranks Test for statistical analysis using the PASW Statistics 18.0 program. A p-value of <0.05 was considered a statistically significant difference.
Results
There were no statistically significant differences in visual assessment of the postoperative sella by the 2 independent readers. The descriptive statistics with the results of the Wilcoxon Signed Ranks Test made by each neuroradiologist are summarized in Tables 2 and 3.
Table 2.
Descriptive statistics made for the first reader.
| T1+C | T2 | p values | |||
|---|---|---|---|---|---|
| Mean score | Std. deviation | Mean score | Std. deviation | ||
| Presence of pituitary | 2.35 | 1.144 | 2.18 | 1.220 | 0.062 |
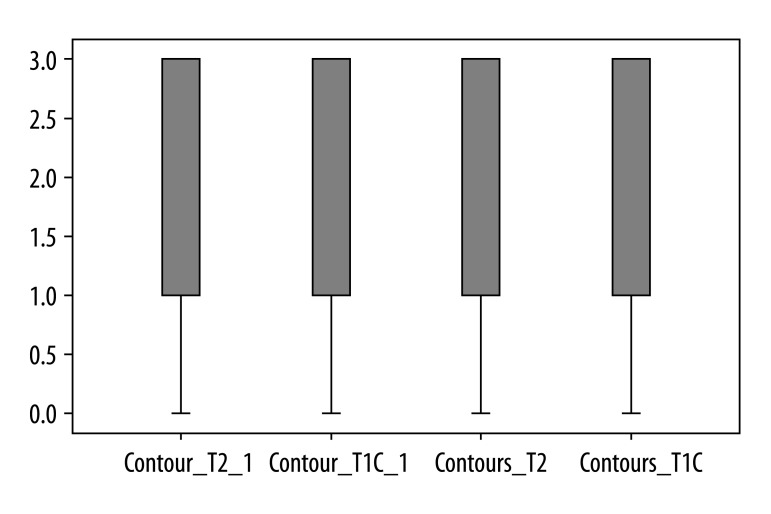
| Contours of pituitary | 2.04 | 1.166 | 2.04 | 1.256 | 0.959 |
| Infundibulum | 2.55 | 0.995 | 0.52 | 0.856 | 0.000* |
| Chiasm | 2.52 | 0.701 | 2.60 | 0.722 | 0.294 |
| Presence of residual tumour | 2.15 | 1.307 | 2.25 | 1.252 | 0.204 |
| Contours of tumour | 1.74 | 1.246 | 2.05 | 1.284 | 0.015* |
Statistically significant p values less than 0.05.
Table 3.
Descriptive statistics made for the second reader.
| T1+C | T2 | p values | |||
|---|---|---|---|---|---|
| Mean score | Std. deviation | Mean score | Std. deviation | ||
| Presence of pituitary | 2.32 | 1.191 | 2.24 | 1.218 | 0.368 |
| Contours of pituitary | 2.00 | 1.233 | 2.12 | 1.243 | 0.265 |
| Infundibulum | 2.48 | 1.054 | 0.59 | 0.908 | 0.000* |
| Chiasm | 2.60 | 0.708 | 2.61 | 0.721 | 0.843 |
| Presence of residual tumour | 2.14 | 1.296 | 2.27 | 1.248 | 0.169 |
| Contours of tumour | 1.65 | 1.292 | 2.09 | 1.274 | 0.001* |
Statistically significant p values less than 0.05.
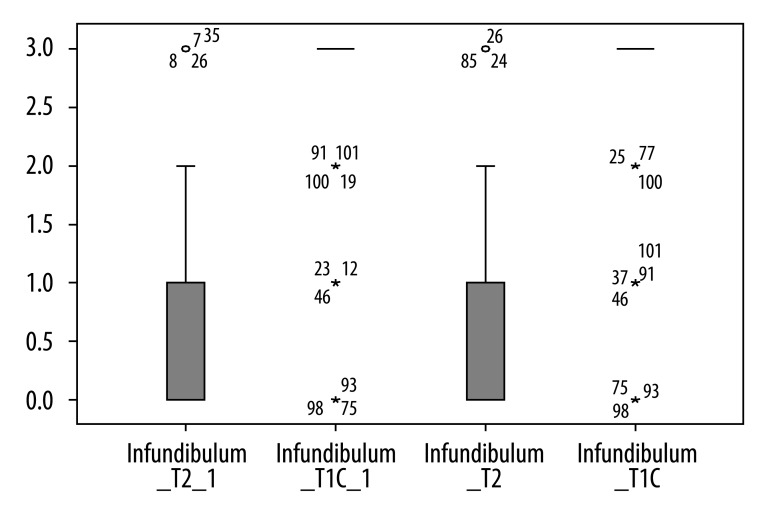
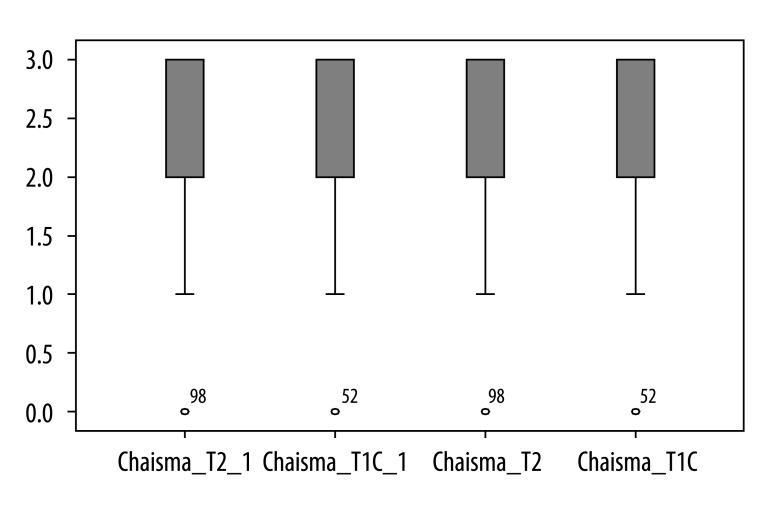
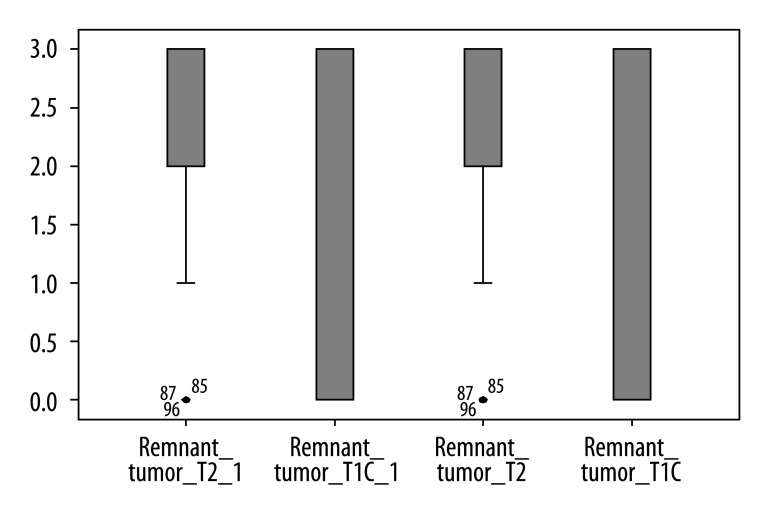
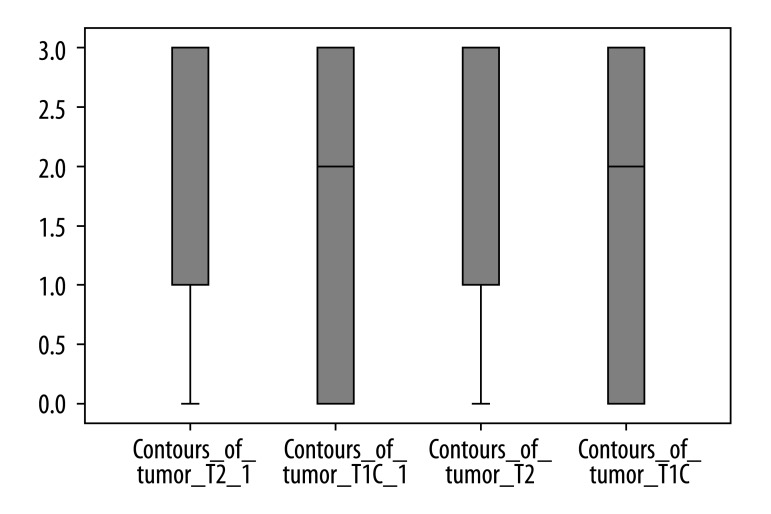
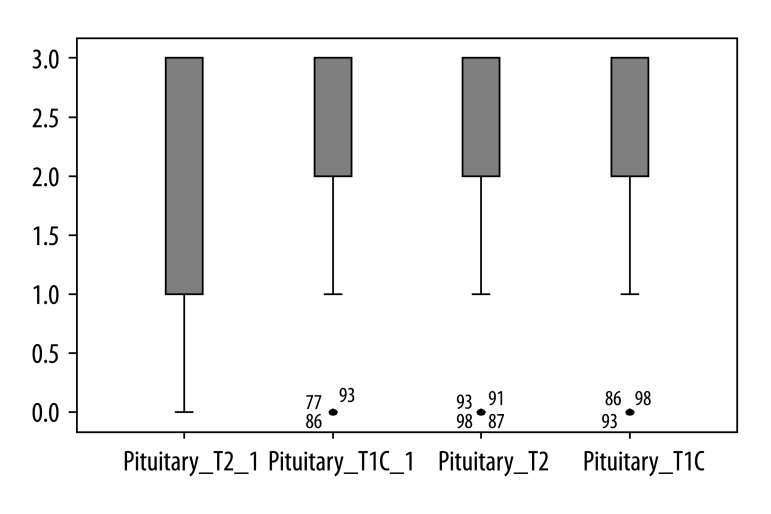
Contrast-enhanced T1-weighted imaging was significantly superior to T2-weighted imaging in assessment of infundibulum (p<0.05) for both radiologists (Figure 2). There was no statistically significant difference for each of the readers between T1- and T2-weighted images regarding to the following features: visualization of residual pituitary gland (p=0.062 and p=0.368), contours of pituitary (p=0.959 and p=0.265), optic chiasm (p=0.294 and p=0.843), and visualization of presence of residual tumor (p=0.204 and p=0.169). We present the spectrum of other results measured by 2 observers in Figures 3 to 6 to demonstrate features without statistically significant difference between T1- and T2-weighted images.
Figure 2.
Results of visual assessment of infundibulum on T2 and T1+C scans measured by two observers.
Figure 3.
Results of visual assessment of optic chiasm on T2 and T1+C scans measured by two observers.
Figure 6.
Results of visual assessment of presence of residual tumour on T2 and T1+C scans measured by two observers.
On the other hand, results of each reader indicated that T2-weighted images were significantly superior to contrast-enhanced T1-weighted imaging with regard to visualization of contours of residual tumor (p<0.05) (Figure 7). Moreover, in 3 cases the residual adenoma was recognized only on T2-weighted images.
Figure 7.
Results of visual assessment of contours of tumour on T2 and T1+C scans measured by two observers.
Muscle with fascia appeared on T1-weighted images as a round hypointense structure, located in the lumen of the sphenoid sinus. After contrast administration, the peripheral part of that material demonstrated slight enhancement. On T2-weighted images, the implanted muscle produced a high signal intensity (increased signal intensity due to degenerative processes of the denervated muscle), while fascia presented as a line of low signal intensity. In 3 cases with muscle and fascia implanted within the sphenoid sinus, the follow-up examinations showed a decreasing intensity of contrast enhancement on T1-weighted images. In contrast, T2-weighted images showed consistent appearance and did not reveal any significant changes in signal intensity within the implanted muscle and fascia for up to 31 months following the operation – no further MR examinations were performed in those cases.
In 1 case there was fluid collection inside the sphenoid sinus what was excellently visible on T2-weighted images.
Discussion
Post-surgical follow-up of the sellar region is very important, especially in cases of hormonally inactive tumors. Detecting recurrence of a proliferative process in subsequent follow-up examinations plays a crucial role for further therapy [3].
However, while presurgical pituitary tumor presentation in MR was described in detail and usually does not present any diagnostic difficulties, post-surgical evaluation of the pituitary gland often becomes a serious problem. Surgical therapy is a primary therapeutic method, except for prolactin-secreting microadenomas [3,25,26]. Interpretation of MR images performed after surgical therapy of pituitary tumors is difficult because of a major change in anatomical conditions in this area. The interpretation depends also on numerous other factors, including: size and expansion of a tumor before surgery, type of surgical access, quality and volume of implanted material, and time of its resorption [3,27,28]. Proper evaluation of post-surgical MR images is crucial to determination of the completeness of surgical resection. Neuroradiologists therefore face the important and difficult task of evaluation of structures present in the surgical area, differentiating residual tumor from residual normal gland, the filling materials and from other post-surgical changes (such as fibrous and cicatricial).
Due to the problems mentioned above, it is important to analyze as many sequences as possible. As pre- and postcontrast T1-weighted images are considered as main sequences for assessing the postoperative sella, the role of T2-weighted images has not been established yet. We therefore decided to assess the value of T2-weighted images in comparison to contrast-enhanced T1-weighted images.
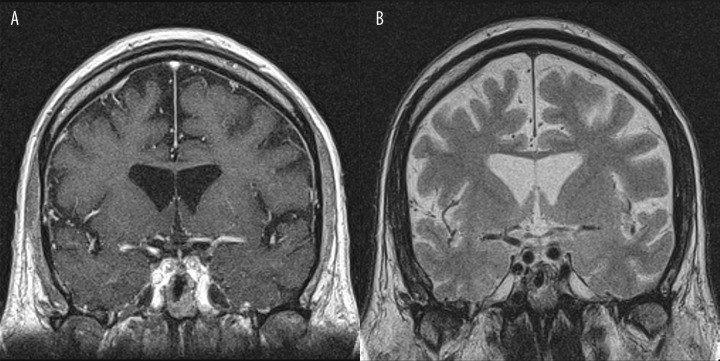
It is not a surprise that contrast-enhanced T1-weighted imaging was significantly superior to T2-weighted imaging in assessment of infundibulum (p<0.05), which corresponds with data from the literature. Nakasu et al also indicated that the pituitary stalk was less frequently visible on T2-weighted images compared to post-contrast T1 [21]. However, in some of our cases the infundibulum was also well delineated on T2-weighted images (Figure 8). Moreover Nakasu et al claim that contrast-enhanced T1-weighted images had no advantages in demonstration of the optic chiasm, and that post-contrast T1 did not improve the detection of the pituitary gland or its contours [21]. This agrees with our findings.
Figure 8.
Visualization of infundibulum: (A) Post-contrast T1-weighted image, coronal plane. (B) Pre-contrast T2-weighted image, coronal plane. In this case the infundibulum is also well delineated on T2-weighted images.
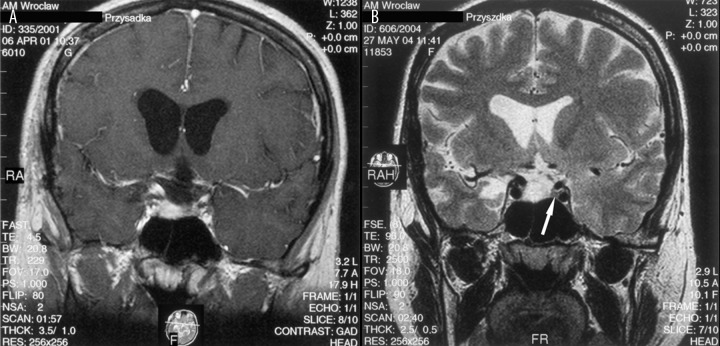
On the other hand, our results demonstrate that T2-weighted imaging is significantly superior to T1-weighted contrast-enhanced imaging regarding visualization of the border between the residual tumor and pituitary gland or the cavernous sinus (p=0.015 for the first reader and p= 0.001 for the second reader). Moreover, in 3 cases it was only possible to recognize the residual tumor on T2-weighted images, not on T1-weighted contrast-enhanced images, because the residual mass demonstrated signal intensity and enhancement pattern identical to normal pituitary gland. In these 3 cases, on the basis of T1-weighted contrast-enhanced images, persistent pituitary gland in the postoperative sellar cavity was diagnosed. As indicated by Bladowska et al, MR imaging of postsurgical pituitary gland does not necessarily correlate with its hormonal function, thus the endocrinological assessment is not always helpful in differential diagnosis of masses persistent in the postoperative sellar region [3]. Some patients with small residual pituitary gland may show normal hormonal function, while in other cases the pituitary seems normal on MR but the patients have hormonal disorders [3].
Because of inconclusive endocrinological assessment in cases of postsurgical pituitary gland, correct diagnosis based on imaging is of great importance. In our opinion, T2 images can significantly improve this diagnosis and in some cases are even superior to post-contrast T1 images. To our knowledge this has never before been reported in the literature.
In the cases mentioned above, T2-weighted images revealed the intrasellar mass, which demonstrated high signal intensity that indicated the residual tumor and excluded persistent pituitary gland (Figure 9). The normal pituitary gland has the same signal intensity as brain parenchyma [21,29,30]. The careful assessment of preoperative T2-weighted images in these 3 cases showed that the pituitary adenomas demonstrated exactly the same high intensity signal.
Figure 9.
(A) Post-contrast T1-weighted image, coronal plane: the residual tumour demonstrates enhancement pattern exactly the same as normal pituitary gland making correct diagnosis impossible. (B) Pre-contrast T2-weighted image, coronal plane: the intrasellar mass presents with high signal intensity, what indicates residual tumour and excludes recognition of the pituitary gland, which is visible on the left side of the sella (arrow).
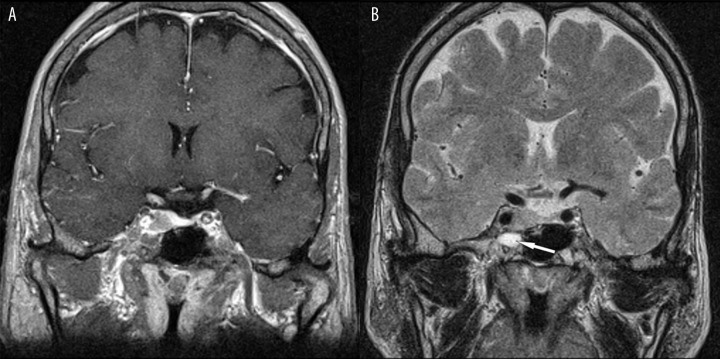
Sometimes the residual tumor may present on post-contrast T1-weighted images with the same signal intensity as postoperative changes in the sphenoid sinus; this may cause misdiagnosis as showed the case in Figure 10. In this patient there was no border line between the tumor infiltrating the right cavernous sinus and fluid collection inside the right sphenoid sinus on post-contrast T1-weighted images. Conversely, the border line was excellently visible on T2-weighted images.
Figure 10.
The fluid collection on the right side of the sphenoid sinus – excellently visible on T2 (arrow). (A) Post-contrast T1-weighted image, coronal plane. (B) Pre-contrast T2-weighted image, coronal plane.
Furthermore, T2-weighted imaging may play an important role in assessment of implanted muscle with fascia. In our material in 3 individuals, an implanted muscle with fascia was identified. It was represented by a round, isointense structure, filling nearly the whole sphenoidal sinus in T1-weighted MRI images. After intravenous contrast administration, the structure was enhanced slightly in its peripheral part, with a central round area of lower signal intensity. Such an image of the implanted muscle was found in 2 patients after 4 months following the operation and in 1 patient 5 months after surgery (Figure 11). The follow-up MRIs (beginning approximately from the 12th postoperative month) revealed a gradual change in the appearance of that material. After contrast administration, the previously distinct border between the enhanced peripheral part and the central hypointense part of the implanted muscle became ill-defined. In further MRI examinations, performed approximately 25 months after surgery or later, the structure inside the sphenoidal sinus remained hypointense after contrast administration. Without the analysis of previous images and the knowledge of the patient’s history, the correct diagnosis of that mass on T1-weighted images would have been impossible (especially its differentiation from fluid cistern).
Figure 11.
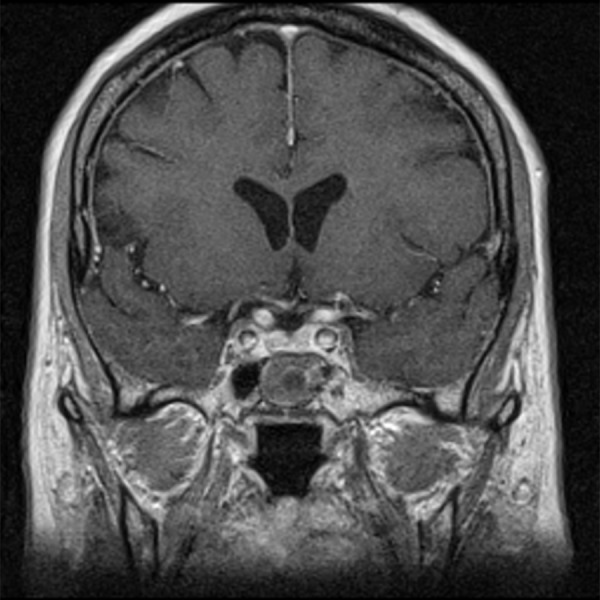
Post-contrast T1-weighted image, coronal plane: in the sphenoid sinus there is a round structure with peripheral enhancement – implanted muscle with fascia.
On the other hand, the implanted muscle with fascia produced a very characteristic and almost stable image in T2-weighted sequence for at least 31 months following the operation. In the T2-weighted sequence, the material is represented by a hyperintense mass with a linear structure of very low signal intensity, consistent with fascia (Figure 12). It should also be pointed out that fascia was not identified on T1-weighted images.
Figure 12.
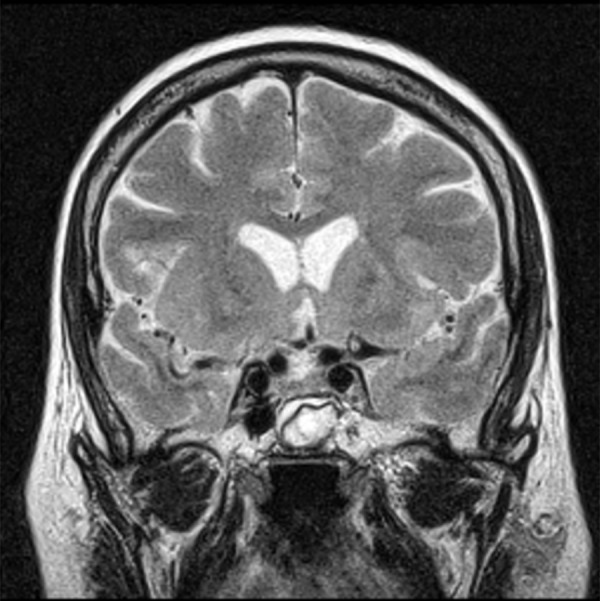
Pre-contrast T2-weighted image, coronal plane: the characteristic appearance of the implanted muscle with fascia.
Kakite et al indicated that 3D-GRE is a more suitable sequence for evaluating sellar lesions on contrast-enhanced T1-weghted imaging at 3.0 T MR units [5]. However, in most radiology departments all over the world, pituitary MR imaging is performed using 1.5 T equipment, so the state of the art in everyday clinical practice, should be based on 1.5 T units.
Our results demonstrate that a careful review of T2-weighted images appears to offer more precise information regarding many anatomical and pathological details that are not visible on post-contrast T1-wieghted images. These results are in agreement with findings of Nakasu et al. [21]. The advantages of our study, compared to the studies mentioned above, are the compatible results of 2 independent readers, as well as the greater number of analyzed patients. In addition, our study supports the findings of Nakasu et al, but adds further information to the literature regarding the changes in the sphenoid sinus, including the characteristic MR appearance of implanted muscle with fascia.
Reduction of contrast material administration could be especially useful in patients with high risk of nephrogenic systemic fibrosis (NSF).
Conclusions
T2-weighted images may help to discriminate between tumorous and non-tumorous involvement of the postoperative sella and the sphenoid sinus, especially in cases in which the signal intensity and enhancement pattern of pituitary gland and tumor are the same on T1-weighted images.
T2-weighted images are also very useful in the postoperative evaluation of the implanted muscle with fascia, especially during long-term follow-up.
The best protocol for the postoperative imaging after pituitary tumor resections includes both T1- and T2-weighted imaging, because T1- and T2-weighted images compliment each other in the postoperative examination of the sella and sellar region. However, in some cases T2 could replace post-contrast T1, especially in patients with high risk of NSF.
Figure 4.
Results of visual assessment of presence of pituitary on T2 and T1+C scans measured by two observers.
Figure 5.
Results of visual assessment of contours of pituitary on T2 and T1+C scans measured by two observers.
Footnotes
Conflict of interest
We declare that we have no conflict of interest.
Source of support: Departmental sources
References
- 1.Bladowska J, Sokolska V, Czapiga E, et al. Advances in diagnostics imaging of the pituitary and the parasellar region. Adv Clin Exp Med. 2004;13:709–17. [Google Scholar]
- 2.Bladowska J, Bednarek-Tupikowska G, et al. MRI image characteristics of materials implanted at sellar region after transsphenoidal resection of pituitary tumours. Pol J Radiol. 2010;75:46–54. [PMC free article] [PubMed] [Google Scholar]
- 3.Bladowska J, Sokolska V, Sozański T, et al. Comparison of post-surgical MRI presentation of the pituitary gland and its hormonal function. Pol J Radiol. 2010;75:29–36. [PMC free article] [PubMed] [Google Scholar]
- 4.Mahmoud OM, et al. Role of PROPELLER diffusion-weighted imaging and apparent diffusion coefficient in the evaluation of pituitary adenomas. Eur J Radiol. 2010 doi: 10.1016/j.ejrad.2010.05.023. [DOI] [PubMed] [Google Scholar]
- 5.Kakite S, et al. Three-dimensional gradient echo versus spin echo sequence in contrast-enhanced imaging of the pituitary gland at 3 T. Eur J Radiol. 2010 doi: 10.1016/j.ejrad.2009.12.036. [DOI] [PubMed] [Google Scholar]
- 6.Mahmoud OM, Tominaga A, Amatya VJ, et al. Role of PROPELLER diffusion weighted imaging and apparent diffusion coefficient in the diagnosis of sellar and parasellar lesions. Eur J Radiol. 2010;74:420–27. doi: 10.1016/j.ejrad.2009.03.031. [DOI] [PubMed] [Google Scholar]
- 7.Œlubowska E, Walecki J, Grieb P, Szary C. 1H MRS spectroscopy in brain tumors – In serach of the highest efficacy. Pol J Radiol. 2009;74:52–60. [Google Scholar]
- 8.Sobiecka B, Urbanik A. The role of choline (Cho) in the diagnostics and differentiation of brain tumours with HMRS technique. Pol J Radiol. 2009;74:7–22. [Google Scholar]
- 9.Krukowski P, Podgórski P, Guziński M, et al. Analysis of the brain proton magnetic resonance spectroscopy – differences between normal grey and white matter. Pol J Radiol. 2010;75:23–27. [PMC free article] [PubMed] [Google Scholar]
- 10.Zimny A, Szewczyk P, Czarnecka A, et al. Usefulness of perfusion-weighted MR imaging in the differential diagnosis of Alzheimer’s disease and mild cognitive impairment. Med Sci Monit. 2010;16(Suppl 1):5–10. [Google Scholar]
- 11.Walecki J, Pawłowska A, Gabryelewicz T, et al. 1H-MRS in mild cognitive impairment (MCI) – the role of particular metabolites in prediction of MCI conversion to AD. Med Sci Monit. 2010;16(Suppl 1):11–18. [Google Scholar]
- 12.Krukowski P, Podgórski P, Guziński M, et al. Change of the brain proton magnetic resonance spectroscopy metabolite’s ratios with aging. Med Sci Monit. 2010;16(Suppl 1):19–23. [Google Scholar]
- 13.Gazioglu N, Erensoy N, Kadioglu P, et al. Altered cyclin D1 genotype distribution in human sporadic pituitary adenomas. Med Sci Monit. 2007;13(11):CR457–63. [PubMed] [Google Scholar]
- 14.Bladowska J, Bednarek-Tupikowska G, et al. Colloid cyst of the pituitary gland: Case report and literature review. Pol J Radiol. 2010;75:92–97. [PMC free article] [PubMed] [Google Scholar]
- 15.Jurkiewicz E, Bekiesińska-Figatowska M, Duczkowski M, et al. Antenatal diagnosis of the congenital craniopharyngioma. Pol J Radiol. 2010;75:102–6. [PMC free article] [PubMed] [Google Scholar]
- 16.Duczkowski M, Duczkowska A, Bekiesinska-Figatowska M, et al. The imaging features of selected congenital tumors – own material and literature review. Med Sci Monit. 2010;16(Suppl 1):52–59. [Google Scholar]
- 17.Lemaire P, Brauner N, Hammer P, et al. Improved screening for growth hormone deficiency using logical analysis data. Med Sci Monit. 2009;15(1):MT5–10. [PubMed] [Google Scholar]
- 18.Takahashi T, Miki Y, Takahashi JA, et al. Ectopic posterior pituitary high signal in preoperative and postoperative macroadenomas: dynamic MR imaging. Eur J Radiol. 2005;55:84–91. doi: 10.1016/j.ejrad.2004.10.003. [DOI] [PubMed] [Google Scholar]
- 19.Bonneville JF, Bonneville F, Schillo F, et al. Follow-up MRI after trans-sphenoidal surgery. J Neuroradiol. 2003;30:268–79. [PubMed] [Google Scholar]
- 20.Hald JK, Eldevik OP, Dunn RL, et al. Improving postoperative MR imaging of pituitary macroadenomas: comparison of full and reduced dose of gadopentetate dimeglumine. Eur Radiol. 2000;10:1068–72. doi: 10.1007/s003300000455. [DOI] [PubMed] [Google Scholar]
- 21.Nakasu Y, Itoh R, Nakasu S, et al. Postoperative sella: evaluation with Fast Spin Echo T2-weighted high-resolution imaging. Neurosurgery. 1998;43(3):440–47. doi: 10.1097/00006123-199809000-00025. [DOI] [PubMed] [Google Scholar]
- 22.Kilic T, Ekinci G, Seker A, et al. Determining optimal MRI follow-up after transsphenoidal surgery for pituitary adenoma: scan at 24 hours postsurgery provides reliable information. Acta Neurochir (Wien) 2001;143:1103–26. doi: 10.1007/s007010100002. [DOI] [PubMed] [Google Scholar]
- 23.Connor SEJ, Deasy NP. MRI appearances of the sphenoid sinus at the late follow-up of trans-sphenoidal surgery for pituitary macroadenoma. Australasian Radiology. 2002;46:33–40. doi: 10.1046/j.1440-1673.2001.00991.x. [DOI] [PubMed] [Google Scholar]
- 24.Gauden AJ, Phal PM, Drummond KJ. MRI safety: nephrogenic systemie fibrosis and Rother risks. J Clin Neuroscience. 2010;17:1097–104. doi: 10.1016/j.jocn.2010.01.016. [DOI] [PubMed] [Google Scholar]
- 25.Wilson CHB. Surgical management of pituitary tumors. J Clin Endocrinol Metab. 1997;82:2381–85. doi: 10.1210/jcem.82.8.4188. [DOI] [PubMed] [Google Scholar]
- 26.Fahlbush R, Hadani M, Perrin G, et al. Neurosurgical treatment of pituitary adenomas: operative and/or medical therapy. Acta Neurochir. 1995;133:211–38. [Google Scholar]
- 27.Yoon PH, Kim DJ, Jeon P, et al. Pituitary adenomas: early postoperative MR imaging after transsphenoidal resection. AJNR. 2001;22:1097–104. [PMC free article] [PubMed] [Google Scholar]
- 28.Steiner E, Knosp E, Herold ChJ, et al. Pituitary adenomas: findings of postoperative MR imaging. Radiology. 1992;185:521–27. doi: 10.1148/radiology.185.2.1410366. [DOI] [PubMed] [Google Scholar]
- 29.Evanson J. Imaging the pituitary gland. Imaging. 2002;14:93–102. [Google Scholar]
- 30.Bonneville JF. Pituitary adenomas: value of MR imaging. J Radiol. 2000;81:939–42. [PubMed] [Google Scholar]


