

Abstract
Cholesterol and ether lipids are ubiquitous in mammalian cell membranes, and their interactions are crucial in ether lipid mediated cholesterol trafficking. We report on cholesterol’s molecular interactions with ether lipids as determined using a combination of small-angle neutron and X-ray scattering, and all-atom molecular dynamics (MD) simulations. A scattering density profile model for an ether lipid bilayer was developed using MD simulations, which was then used to simultaneously fit the different experimental scattering data. From the analysis of the data the various bilayer structural parameters were obtained. Surface area constrained MD simulations were also performed to reproduce the experimental data. This iterative analysis approach resulted in good agreement between the experimental and simulated form factors. The molecular interactions taking place between cholesterol and ether lipids were then determined from the validated MD simulations. We found that in ether membranes, cholesterol primarily hydrogen bonds with the lipid headgroup phosphate oxygen, while in their ester membrane counterparts, cholesterol hydrogen bonds with the backbone ester carbonyls. This different mode of interaction between ether lipids and cholesterol induces cholesterol to reside closer to the bilayer surface, dehydrating the headgroup’s phosphate moiety. Moreover, the three-dimensional lipid chain spatial density distribution around cholesterol indicates anisotropic chain packing, causing cholesterol to tilt. These insights lend a better understanding of ether lipid mediated cholesterol trafficking and the roles that the different lipid species have in determining the structural and dynamical properties of membrane associated biomolecules.
Keywords: lipid bilayer, lipid area, bilayer thickness, ether linkage, spatial density distribution, hydrogen bonding
INTRODUCTION
Ether lipids, whose hydrocarbon chains are attached to the glycerol backbone via an ether linkage (Fig. S1 in the Supporting Information), instead of the more common ester linkage, are essential components of biological membranes. The ether moiety confers important physiological functions, and various phenotypic anomalies have been attributed to ether lipid deficiency. For example, top-down lipidomics reveal that a reduced level of ether lipids in blood plasma is associated with hypertension, a key syndrome of metabolic disorder 1. Similarly, investigations of global serum lipid profiles indicate that obesity is primarily related to altered lipid metabolism. Specifically, the degree of genetic independent obesity was found to correlate negatively with the level of ether phospholipids 2. Deficiency of enzymes involved in ether lipid biosynthesis leads to Zellweger syndrome and rhizomelic chondrodysplasia punctata 3. Ether lipids have also been suggested to act as beneficiary factors in reducing oxidative stress, regulating lipid metabolism, mediating signal transduction, and exerting cytostatic toxicity in tumor cells 4.
Cholesterol is ubiquitous in mammalian cell membranes. It plays pivotal roles in altering membrane fluidity, maintaining membrane integrity, and in the formation of liquid-ordered domains that facilitate protein segregation and provide platforms for signal transduction 5. It has been noted that there is a gradient of cholesterol distribution that exists from the endoplasmic reticulum to the plasma membrane, and the impairment of this distribution is a cause for a variety of diseases 6. Despite this, the underlying molecular mechanism of cholesterol homeostasis remains unclear 7.
The major forms of ether lipids in mammalian cells are plasmalogens, an integral component in cholesterol trafficking. Lack of plasmalogens leads to altered cholesterol transport 8, ultimately impairing its distribution gradient 3. Moreover, serum plasmalogens have been shown to correlate positively with the content of high-density-lipoproteins (HDL) 9, and play an important role in HDL-mediated cellular cholesterol efflux 10. A reduced plasmalogen concentration results in the accumulation of free intracellular cholesterol, which can result in the development of Niemann-Pick type C disease 11. However, in order to understand how ether lipids are involved in cholesterol trafficking, an atomic-level understanding of the interactions between these two biomolecules is needed.
We have carried out small-angle neutron and X-ray scattering experiments, in conjunction with all-atom molecular dynamics (MD) simulations, to gain some understanding of the intermolecular interactions that exist between cholesterol and an ether lipid bilayer composed of 1,2-di-O-hexadecyl-sn-glycero-3-phosphocholine (DHPC). Initial MD simulations, with no applied surface tension, provided an atomistic picture that aided in the design of a scattering density profile (SDP) model. The model was then used to analyze experimental data, from which the different structural parameters (e.g., area per lipid and bilayer hydrophobic thickness) were determined and subsequently used to refine the MD simulations, as outlined previously 12. The “correctness” of the bilayer structure produced by the refined MD simulations was then tested through a model-free, direct comparison to the experimental form factors 13, 14. The need to apply a surface tension to MD simulations in order to reproduce the experimental data highlights the importance of this validation process. Based on experimental data, the refined MD simulations unveiled the detailed atomic-level interactions taking place between cholesterol and DHPC. Specifically, cholesterol was found to preferentially associate with the phosphate oxygen of ether lipids, while in ester lipid bilayers, the prevailing H-bonding interactions take place between cholesterol and the backbone ester carbonyl. The implications of this unique mode of interaction are discussed in the context of ether lipid mediated cholesterol trafficking.
MATERIALS AND METHODS
1,2-di-O-hexadecyl-sn-glycero-3-phosphocholine (DHPC) and cholesterol were purchased from Avanti Polar Lipids (Alabaster, AL) and Sigma-Aldrich (St. Louis, MO), respectively, and used as received. Lipid sample preparations for scattering experiments and volume measurements (Table S1) have been previously described 12, 15, and are summarized in section 2 of the Supporting Information. Briefly, unilamellar vesicles (ULVs) for small-angle scattering experiments were prepared by mixing ~40 mg of lipid with 1.0 ml D2O (St. Louis, MO), or 18 MΩcm H2O (Millipore), followed by temperature cycling through DHPC’s main phase transition until a uniform lipid dispersion was obtained. Lipid dispersions were then heated to 55–60°C and extruded through a polycarbonate filter with 500 Å diameter pores using an Avanti mini-extruder. Finally, the obtained ULV samples were diluted with D2O or H2O to the desired external contrast condition. Samples for volume measurements were prepared in a similar way, except that no extrusion was required (section 3 of the Supporting Information). Unless otherwise specified, all scattering experiments and MD simulations were performed at 60°C.
Small-Angle Neutron Scattering
Neutron data were taken at the Spallation Neutron Source (SNS) BL-6 EQ-SANS instrument, located at Oak Ridge National Laboratory. A range of wavelengths (i.e., 2.5–6.0 Å) and a sample-to-detector distance of 2.0 m were used, resulting in a total scattering vector Q [Q = 4π/λ×sin(θ), where λ is the wavelength and 2θ is the scattering angle] of 0.03 < Q < 0.8 Å−1. No useful data were obtained at Q > 0.3 Å−1, consistent with the highly disordered nature of liquid crystalline bilayers. Time-of-flight data were corrected (i.e., background and transmission) and reduced using the Mantid software supplied by SNS. For data analysis, the obtained one-dimensional (1D) intensity I was converted into a neutron form factor following |F(Q)|=Q×sign(I)sqrt(|I|), where sign(I) refers to the sign of the corrected intensity.
Small-Angle X-ray Scattering
X-ray data were collected at the Cornell High Energy Synchrotron Source G-1 station. Scattering from a collimated incident beam (0.24 × 0.24 mm2) of 1.17 Å wavelength X-rays impinging on ULV samples was detected using a 1024×1024 pixel array FLICAM charge-coupled device with 71 μm linear dimension pixels. The sample-to-detector distance was 505.8 mm, as determined using a powder sample of silver behenate. Samples were taken up in 1.5 mm quartz capillaries and placed in a temperature controlled, multiposition sample holder. The scattering intensity I versus scattering vector Q was obtained through radial averaging of the background subtracted two-dimensional (2D) data, which were then converted into an X-ray form factor using the same relationship as for neutrons.
Molecular Dynamics Simulations
The CHARMM-GUI Membrane Builder was used to generate coordinates for a pure DHPC bilayer (128 DHPCs) and a DHPC bilayer with 20 mol% cholesterol (128 DHPCs + 32 cholesterols) (Table S2). Since DHPC is not included in CHARMM-GUI’s lipid selection, we first built a DPPC bilayer model using CHARMM-GUI, which were then converted to a DHPC bilayer model by replacing the carbonyl group (C=O) in each DPPC molecule with a methylene group (CH2). 4300–4800 water molecules were added to solvate both bilayer leaflets, and a sufficient amount of NaCl was then introduced to simulate a 100 mM solution. MD simulations were performed using NAMD 2.816 and the CHARMM 36 lipid force field 17, 18, the exception being the ether moiety which was adapted from Shinoda et al. 19. To our knowledge, the DHPC force field developed by Shinoda et al. is the only full set of force field parameters specifically optimized for DHPC. We have also considered the parameter set for ethers from Vorobyov et al., which was systematically optimized for a large set of linear and cyclic ethers 20. However, the Vorobyov parameter set lacks exact parameters for the secondary ether linkage and the phosphorous ether linkage. Ether lipid parameters are listed in Table S3. For each bilayer system, atomic coordinates were first minimized using the conjugated gradient algorithm for 5000 steps, followed by 20 ns of equilibration. Equilibrium was determined by monitoring the system’s area per lipid and the root-mean-square deviation (RMSD). In all simulations, the van der Waals (vdW) interactions were truncated via a potential-based switching function used by X-PLOR 21. Starting from a switching distance of 10.5 Å, the vdW potential was brought smoothly to 0 at the cutoff distance of 12 Å. Long-range electrostatic interactions were treated using the particle-mesh Ewald (PME) method 22 with a 1.0 Å grid spacing. The r-RESPA multiple-time-step method was employed with 2 fs time steps per bond, and 2 fs and 4 fs time steps for short-range non-bonded and long-range electrostatic interactions, respectively 23. The bonds between hydrogen and heavy atoms were constrained using the SHAKE algorithm 24. All simulations were conducted on the Jaguar XT5 supercomputer located at the National Center for Computational Science (http://www.nccs.gov/).
We first performed two independent simulations, one for the pure DHPC system and another simulation for the DHPC with 20 mol% cholesterol system, at constant particle number, pressure and temperature (NPT). Langevin dynamics were used to maintain a constant temperature of 333 K, while the Nosé-Hoover Langevin-piston algorithm 25, 26 was used to maintain a constant pressure of 1 bar. The z-axis was allowed to expand and contract independently of the x-y plane. To reproduce the experimental form factors, we carried out three additional simulations with the same MD control parameters, except that surface areas were constrained to values obtained from the SDP model analysis. These simulations were performed at a constant particle number, area, normal pressure, and temperature (NAPnT), such that the bilayer area in the x-y plane did not change, while the z-axis was allowed to expand and contract in order to maintain a constant Pn.
The production run length for each simulation was between 80 and 104 ns. Bilayer simulations were analyzed for number density distributions of each non-hydrogen atom, computed neutron and X-ray form factors, and cholesterol tilt angle. All analyses were performed using the last 50 ns of MD trajectories.
To characterize the short-range packing of lipid’s hydrocarbon chains in the vicinity of cholesterol, a three-dimensional (3D) spatial density distribution was calculated. All the positions of the lipid chain carbon atoms were collected and binned using a grid of 0.1 nm in each of the three dimensions. All histograms were smoothed with a 3D Gaussian function and normalized such that the sum over all bins equaled 1.
RESULTS
SDP Model of an Ether Lipid Bilayer Guided by Initial MD Simulations
Biologically relevant membranes are highly disordered systems and as such, are difficult to study using conventional diffraction techniques. As illustrated in Fig. 1a, no unique spatial coordinates can be assigned to the atoms making up a thermally disordered bilayer. Instead, their positions within a fluid bilayer are best described by broad statistical distributions. One approach used to describe a lipid bilayer is to parse the membrane into several manageable components. Cumulatively, the distribution of these components describes the fluid bilayer structure 27.
Figure 1.

Parsing scheme of the DHPC bilayer based on MD simulations. (a) A snapshot of the equilibrated DHPC bilayer. The lipid bilayer is parsed into five components, namely: terminal methyl (CH3, red); methylene (CH2, green); glycerol backbone and ether linkage (G1, black); phosphate and CH2CH2N moiety (G2, magenta); and the trimethyl groups of the terminal choline (G3, yellow). (b) Number densities of the different components along the bilayer normal. Data were obtained from NAPnT MD simulations at a fixed lipid area of 67.2 Å2. (c) Volume probability distributions of the different components making up the DHPC bilayer. The principle of spatial conservation is illustrated by the fact that the total probability (thick gold line) deviates minimally from unity at every position across the bilayer.
The non-trivial aspects of a parsed lipid bilayer, which address the experimental neutron and X-ray scattering data have been previously described 28, and can be summarized as follows: (1) the neutron and X-ray scattering density distributions of each component should coincide with its volume distribution; (2) the component distributions are represented by simple analytical functions; and (3) the parsimonious use of components in order to adequately describe the bilayer structure, including the much sought-after hydrophobic thickness and lipid area.
In order to arrive at a parsing scheme that meets the above criteria, MD simulations were performed for a pure DHPC bilayer comprised of 128 lipids. The initial MD simulations with no applied surface tension resulted in an area per lipid equal to 59.0 Å2. Similar to the well-documented case for phosphatidylcholine (PC) lipids 29, the ether lipid headgroup was parsed into three components (see Fig. 1), namely the glycerol backbone and ether linkage (G1), the phosphate and CH2CH2N moiety (G2), and the trimethyl group of the terminal choline (G3). It is noteworthy that as a result of their negative neutron scattering length density (NSLD), it was necessary to describe the trimethyl groups with their own, separate function. Finally, the central hydrocarbon core was divided into the terminal methyl trough (CH3) and the methylene groups (CH2). After parsing, the number density of each component was readily calculated from the simulation trajectory (Fig. 1b). The volume distributions of all components (Fig. 1c) were obtained by simultaneously solving an array of linear equations, i.e., Σi ViPi = 1, where Vi and Pi are the component volume and volume probability of the ith component, respectively 30. It is clear that volume distributions of the headgroup components are well described by Gaussians. In the case of the hydrocarbon chains, the total distribution was represented by the sum of two error functions whose width corresponds to the bilayer’s hydrophobic thickness. The terminal CH3 was also represented by a Gaussian, and the CH2 distribution was obtained by subtracting the CH3 Gaussian from the error function. The last component to be dealt with was the surrounding water that intercalates into the headgroup region, and defines the Gibbs dividing surface. MD simulations confirm that the total water and lipid bilayer distributions equal unity at every position across the bilayer (Fig. 1c). Therefore, the water volume distribution emerges through complementarity with the total lipid bilayer distribution 29.
The component volume distributions outlined above form the basis of the SDP model that was used to simultaneously analyze small-angle neutron and X-ray scattering data (Figs. 2a and 2b). Briefly, the NSLD and electron density (ED) profiles (Figs. 2c and 2d) were obtained by summing the products of the component volume distributions (Fig. 2e) with their corresponding neutron or X-ray scattering amplitudes (i.e., the neutron scattering length or the number of electrons, respectively). By Fourier transform, the NSLD and ED profiles were converted into form factors that were fitted to those obtained experimentally. The best structural parameters were then determined by a nonlinear least-square algorithm that included the experimental uncertainties 29.
Figure 2.

SDP model fits to different contrast experimental form factors. In the model, the lipid components were described by analytical functions (i.e., Gaussians and an error function), and the water component was determined through complementarity with the total lipid volume distribution. The various bilayer structural parameters were determined through the joint refinement of experimental neutron (a) and X-ray (b) form factors. The component and total electron densities (c), neutron scattering length densities (d), and volume distributions (e) were calculated using the best-fit structural parameters. Lipid area A, overall bilayer thickness DB, and hydrocarbon thickness 2DC were determined from the component volume distribution profiles (e). For instance, the Gibbs dividing surface of water/lipid interface, which is located half way along the total bilayer thickness (DB/2), is defined as a point where the integrated water distribution on one side and its deficiency on the other side are equal (red regions); the lipid area is related to the total bilayer thickness through A=2VL/DB, where VL is the lipid volume; hydrocarbon thickness is defined by the width of the error function representing the total hydrocarbon distribution. In c, d and e the color scheme for each component is the same as in Fig. 1. The thick gold line shows the bilayer total electron density (c) and total neutron scattering length density of the DHPC bilayer in 100% D2O (d).
DHPC Bilayer Structure Determined by SDP Model Analysis
The best-fit structural parameters for a DHPC bilayer are listed in Table S4, and the corresponding model form factors are shown in Figs. 2a and 2b (solid lines). It is clear that good agreement exists between the model and experimental form factors at all contrast conditions. Of note, and in contrast to previously studied ester lipid bilayers 31, is the well-resolved lobe at Q > 0.18 Å−1 in the 100% D2O neutron scattering data (Fig. 2a). This feature is mainly the result of increased neutron flux and energy resolution available at the SNS EQ-SANS instrument. Another pronounced feature in the experimental data is the negative values in the X-ray form factor at Q>0.56 Å−1 (Fig. 2b). As has been previously emphasized, these values are mainly due to the limited data resolution at higher Q, where the scattering intensity follows a Gaussian distribution centered at zero 29. In other words, the form factor has an equal probability of assuming either a positive or negative value.
The ED, NSLD and component volume distributions for the best-fit DHPC bilayer are shown in Figs. 2c–2e. In the case of the 1D x-ray scattering profile, the maximum ED resides at the headgroup’s phosphate moiety, while in the case of the 1D neutron scattering profile, the center of the transition zone (i.e., between the deuterated water and the protiated hydrocarbon chains) is near the glycerol backbone. The point where the integrated areas of water deficit (red area at the right of the black dashed line, Fig. 2e) and water penetration (red area at the left of the black dashed line, Fig. 2e) are equal defines the canonical Gibbs dividing surface of water/lipid interface. The distance between the two Gibbs dividing surfaces located at opposite bilayer leaflets defines the overall bilayer thickness DB. Lipid area A is related to the overall bilayer thickness by A=2VL/DB, where VL is the lipid volume obtained from density measurements (Fig. S2 and Table S1). The bilayer hydrophobic thickness 2DC is defined by the full width of the error function, and is a parameter thought to play a critical role in influencing membrane-associated protein function.
Refining the MD Simulations of a DHPC Bilayer
MD simulations are often envisioned as a powerful tool for deciphering intra- and inter-molecular interactions that are responsible for a broad spectrum of biological processes. However, such information can only be trusted when experimentally determined structural and dynamical properties are accurately reproduced. In the realm of lipid membranes, an often employed criterion is the average area per lipid owing to its direct relationship to other bilayer structural parameters. In other words, MD simulations have much more gravitas if this quantity is reproduced. Thus, the structural parameters obtained from our SDP model analysis, especially lipid area, are important in helping to refine MD simulations.
A second set of simulations was performed with lipid area constrained to the value derived from SDP model analysis (i.e., 67.2 Å2). The simulated structure can then be directly compared to the experimental data 13, 14. This comparison proceeds by averaging an equilibrated trajectory to obtain the number density of each non-hydrogen atom along the bilayer normal. The total simulated NSLD and ED profiles were obtained by summing the number density of each atom after multiplying with the corresponding NSLD and ED amplitudes (hydrogen atoms are implicitly included). Fourier transform of the difference between the total bilayer and the bulk water gave rise to the simulated form factors. Unlike those obtained experimentally, the form factors calculated from the simulated structures are on an absolute scale. Thus, for a direct comparison to simulated form factors, each set of experimental form factors was multiplied by a scaling factor to minimize their difference (in a least-square sense)—the experimental form factors were weighted by the appropriate experimental uncertainties 12.
Figure 3 reveals good agreement between experimental and simulated form factors at all contrast conditions. The small deviations in the X-ray form factor, starting at the second lobe position, have previously been observed in PC and phosphatidylglycerol (PG) bilayers 12, 29. These deviations are likely the result of larger experimental uncertainties in the X-ray data beyond the form factor’s first lobe. With regard to the neutron data, due to the strong contrast between the protiated lipid and deuterated water, neutron scattering is most sensitive to the overall bilayer thickness, which is inversely related to lipid area by taking into account volumetric data. Therefore, the good agreement between experimental and simulated neutron form factors indicates that the lipid area obtained from SDP model analysis and reproduced by the refined simulations, is accurate. For comparison, we also show experimental and simulated form factors with an area per lipid of 59.0 Å2, where agreement between the two is poor (Fig. S3).
Figure 3.

Direct comparison between different contrast experimental neutron and X-ray form factors, and form factors computed from NAPnT MD simulations at a fixed lipid area of 67.2 Å2. In the top panel, the neutron data at 70 and 50% D2O are shifted vertically for better viewing.
MD Simulations of a DHPC Bilayer with 20 mol% Cholesterol and the Modified SDP Model
Similar to pure DHPC, two sets of MD simulations were performed for a DHPC bilayer doped with 20 mol% cholesterol. The first set of simulations did not apply a surface tension, resulting in a unit cell area of 58.2 Å2. (N.B., the unit cell includes one lipid molecule and the corresponding cholesterol fraction. For example, for 20 mol% cholesterol, the unit cell is composed of one lipid molecule and 1/4 cholesterol molecule. A second set of MD simulations was performed at a fixed unit cell area of 68.6 Å2, a value obtained from SDP model analyses. From here on only the 68.6 Å2 data will be discussed, as it represents the correct unit cell area.
Figure 4a shows a snapshot of the DHPC/cholesterol bilayer. The majority of cholesterol molecules are slightly tilted, with their hydroxyl groups residing near the headgroup-hydrocarbon chain interface. The number density distributions of each lipid component and cholesterol are shown in Fig. 4b. It is clear that cholesterol extends over a range in the bilayer which is similar to the hydrocarbon CH2 component. Moreover, due to the molecule’s rigid tetracyclic ring and flexible tail architecture, cholesterol’s number density curve has a shape similar to the CH2 component. In light of this, and the fact that there is no readily available analytical function to represent cholesterol’s number density distribution, we combined the CH2 and cholesterol components into a single component—effectively treating cholesterol as part of the CH2. The validity of such an assumption was for the most part justified by comparing the area per lipid values obtained using this model and from MD simulations (see results in the following sections). Figure 4c shows the component volume distributions calculated from the modified number density distributions. The principle of spatial conservation is still maintained as evidenced by the small deviations from unity of the total volume distribution (thick gold line). We note that the enhanced fluctuations near the bilayer center are the result of cholesterol being combined with CH2 (i.e., the model is less than perfect).
Figure 4.

MD simulations of the DHPC bilayer with 20 mol% cholesterol. (a) A snapshot of the equilibrated system. The same parsing scheme for DHPC lipids is used as in Fig. 1. Cholesterols are shown as blue sticks. (b) Component number density distributions calculated from NAPnT MD simulations performed at a fixed unit cell area of 68.6 Å2. Cholesterol (Chol) number density is depicted by the blue line. (c) Component volume distributions calculated from the number density distributions in (b) after combining the CH2 and cholesterol components (CH2Chol).
SDP Model Analysis of DHPC Bilayers with Different Concentrations of Cholesterol
SDP model analysis was performed for DHPC bilayers doped with different amounts of cholesterol. As mentioned, in this model CH2 and cholesterol were combined into a single component. The best-fit experimental and model form factors at different contrast conditions are shown in Fig. S4. A noticeable difference, compared to the pure DHPC bilayer, is that the second lobe in the X-ray form factors is suppressed, while the third lobe becomes more pronounced with increasing cholesterol concentration.
Bilayer structural parameters obtained from SDP model analysis are listed in Table S4. It has previously been pointed out that defining the lipid area of a binary mixture is nontrivial 32. The lipid area referred to in this paper is the so-called apparent lipid area, which is defined as: ALapp=(VL−VHL)/DC, where VHL is the lipid headgroup volume. In general, with increasing amounts of cholesterol, lipid bilayer thickness (i.e., the overall bilayer thickness DB and the hydrocarbon thickness 2DC) increases, while the apparent lipid area decreases linearly (Fig. 5).
Figure 5.

Representative structural parameters of the fluid phase DHPC bilayer as a function of cholesterol concentration. Cholesterol’s ordering effect is manifested by the decreased apparent lipid area and the increased overall bilayer and hydrocarbon thicknesses at higher cholesterol concentrations. A closer examination indicates that cholesterol’s condensation effect is linear, at least up to the highest cholesterol concentration studied here (i.e., 30 mol%).
Direct Comparison between Experimental and Simulated Form Factors of a DHPC Bilayer with 20 mol% Cholesterol
Agreement between experimental form factors and those calculated from MD simulations with a fixed unit cell area validates the appropriateness of the modified SDP model. Figure 6 shows good agreement between experimental and simulated neutron form factors at all contrast conditions for a DHPC/cholesterol mixture, confirming the appropriateness of the lipid unit cell area that was derived from the modified SDP model analysis. However, similarly to the pure DHPC bilayer, slight deviations are observed in the X-ray form factor at Q values beyond the first lobe, most likely the result of experimental uncertainties. In section 8 of the Supporting Information, we present direct comparisons between experimental and simulated form factors with no applied surface tension (58.2 Å2, Fig. S5). In those cases poor agreement is observed between the different form factors.
Figure 6.

Direct comparison between different contrast experimental form factors of the DHPC bilayer with 20 mol% cholesterol and form factors computed from NAPnT MD simulations at a fixed unit cell area of 68.6 Å2. Similar to Fig. 3, the experimental form factors are relatively scaled, and the neutron form factors at 70 and 50% D2O are shifted vertically for better viewing.
Intermolecular Interactions Inferred from Refined MD Simulations
To understand the intermolecular interactions that are responsible for stabilizing cholesterol in an ether lipid bilayer, we calculated the volume averaged radial distribution functions (RDFs) of various DHPC atoms with respect to cholesterol’s OH group (OH-Chol). Figure 7a reveals a distinct, sharp peak centered at 2.7 Å for the phosphate oxygen (the two non-ether oxygen atoms), indicating strong H-bonding interactions taking place between OH-Chol and the lipid’s phosphate oxygen. A broad peak with a well-defined position is also observed for the choline nitrogen, a bulky group which most likely interacts with the OH-Chol through long-range electrostatic interactions. Conversely, the RDF for the backbone ether oxygen displays a much broader distribution, accompanied by a small peak centered near 2.8 Å. Interestingly, the RDF of the water’s oxygen implies that the OH-Chol also interacts strongly with surrounding water molecules through H-bonding, though the probability of this interaction is about 50% less than that of the phosphate oxygen—based on the RDF amplitudes.
Figure 7.

Volume normalized radial distribution functions of OH-Chol with phosphate oxygen (a), choline nitrogen (b), backbone ether oxygen (c), and water oxygen (d). Distinct sharp peaks are observed near 2.7 Å for the phosphate oxygen and water oxygen. A broad peak with a well-defined position is observed for the choline nitrogen near 4 Å. Conversely, the radial distribution function for the backbone ether oxygen is very broad, except for a small peak near 2.8 Å.
Figure 8 shows an equilibrated cholesterol molecule surrounded by two ether lipids and two water molecules. In this snapshot, the two water molecules are localized within 3.3 Å of cholesterol, and stabilized by H-bonds. The sharp peak in the RDF between the phosphate oxygen and OH-Chol (Fig. 7a) is the result of strong H-bonding between the cholesterol and the first lipid to its left (2.7 Å). Although further away, the nitrogen atom from the other neighboring lipid (right side) shields cholesterol from bulk water by positioning itself above the OH-Chol, and possibly forming long range electrostatic interactions. This snapshot also implies that OH-Chol interacts weakly with the backbone ether oxygen.
Figure 8.

A snapshot depicting intermolecular interactions between OH-Chol and nearby atoms. The orange dashed lines highlight potential hydrogen bonding and electrostatic interactions. The water oxygens are colored in purple.
Cholesterol’s Orientation in an Ether Lipid Bilayer
The trajectory averaged tilt angle distribution was calculated to characterize cholesterol’s orientation within an ether bilayer. The tilt angle is defined as the angle between the bilayer normal and the vector pointing from the tetracyclic ring’s C13 to C3 atom (Fig. 9 and Fig. S1). Note that the distribution is the average between the two opposing leaflets. It is clear from the data that cholesterol preferentially orients near 20° with respect to the bilayer normal (Fig. 9).
Figure 9.

Tilt angle of cholesterol’s planar tetracyclic ring with respect to the bilayer normal. (a) Tilt angle is defined as the angle between the bilayer normal (purple cylinder) and the vector connecting cholesterol’s C13 and C3 atoms (white cylinder). (b) The trajectory averaged cholesterol tilt angle distribution, with a maximum probability located near 20°.
It is noteworthy that cholesterol’s planar tetracyclic ring is not symmetrical. The two methyl substitutes (C18 and C19) protruding from the ring define cholesterol’s rough face (Fig. S1)—the opposite side is the so-called smooth face. The trajectory averaged 3D spatial density distribution of lipid chains surrounding cholesterol was calculated to observe any effects as a result of ring asymmetry (Fig. 10). Substantial chain density is observed near cholesterol’s smooth face, whereas the density is minimal near the rough face. Aside from this, the density distribution is more or less symmetrical around cholesterol’s main axis.
Figure 10.
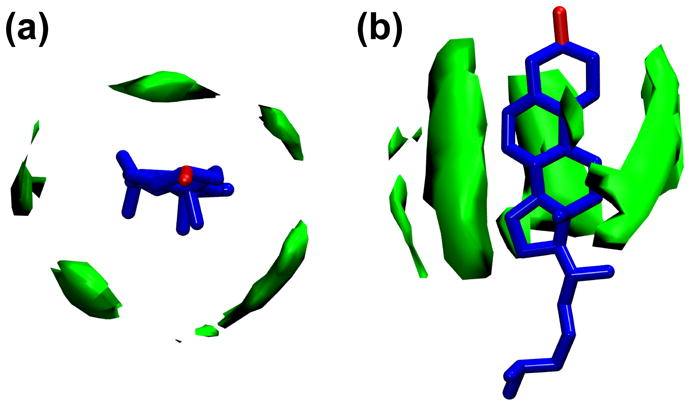
3D spatial density distribution of lipid hydrocarbon chains in the vicinity of cholesterol. The green contours define the locations with highest chain density. The anisotropic chain packing is the result of cholesterol’s asymmetric tetracyclic ring, with high density chain packing taking place in the vicinity of the ring’s smooth face. (a) Top view and (b) side view.
DISCUSSION
The Structure of an Ether Lipid Bilayer
It has been argued that model-based analysis of standalone neutron or X-ray scattering data is inadequate in distinguishing degenerate bilayer structures (i.e., different structures fit equally well to the same set of experimental data). Taking X-ray scattering data as an example, prior knowledge of the distance between the phosphate and the onset of the hydrocarbon chain region is required to unequivocally determine the bilayer’s hydrophobic thickness. Previously, underestimating this quantity led to an overestimation of DOPC’s (1,2-dioleoyl-sn-glycero-3-phosphatidylcholine) molecular area 29. Similarly, due to the fact that SANS is nominally not a high resolution technique, SANS data is only able to reveal certain features of the bilayer. Therefore, to compensate for each technique’s inherent deficiencies we developed an SDP model for DHPC/cholesterol bilayers that is capable of simultaneously fitting both neutron and X-ray data, thus enabling us to accurately determine the bilayer’s various structural parameters.
Applying this analysis protocol to a pure DHPC bilayer revealed a lipid area of 67.4 Å2 at 60°C, a value 2.3 Å2 larger than a previous measurement for DHPC bilayers at 48°C 33. Taking into account a lipid area thermal expansion coefficient of ~0.17 Å2/°C 31, these two results turn out to be consistent with each other. Our data also indicate that DHPC has a slightly larger lipid area than its ester counterpart, DPPC (65.0 Å2 at 60°C) 31. MD simulations show that the two hydrogen atoms in ether lipids, which replace the carbonyl oxygen in ester lipids, lie in a plane along the glycerol backbone forming a water impermeable barrier (Fig. S6). Thus, when compared to ester lipids, it seems that ether lipids are hindered to a greater extent in this hydrocarbon “hinge” region (i.e., compared to one oxygen, the steric interactions due to two hydrogen atoms are larger), and they consequently have a slightly larger lipid area than their ester lipid counterparts. The notion that chemical composition at the hinge region can dictate lipid lateral packing can have profound implications. By incorporating either bulky or compact chemical species in this region of the bilayer, unique packing geometries can be achieved. Importantly, the incorporation of amphipathic molecules in this region can have non-trivial consequences with regard to the bilayer’s physical properties.
Not surprisingly, we found that the addition of cholesterol resulted in a decrease in area per lipid and an increase in the bilayer’s hydrocarbon chain thickness. A closer examination indicates that cholesterol’s well-known condensation effect manifests itself in a linear fashion as a function of its increasing concentration, at least up to 30 mol% (highest concentration studied). This result is in contrast to saturated ester lipids (e.g., DMPC and DPPC), whose maximum chain ordering effect plateaus near 20–25 mol% cholesterol 34–36. This difference between the chemically different lipid bilayers suggests that ester lipids are more susceptible to cholesterol ordering than ether lipids. As will be discussed below, due to the absence of the backbone carbonyl oxygens, the OH-Chol tends to preferentially interact with the phosphate oxygen in ether lipids. Consequently, cholesterol’s planar tetracyclic ring is positioned further away from the lipid hydrocarbon core (Fig. 8), thereby reducing its influence on lipid chain ordering.
MD Simulations
Two MD configurations (i.e., constrained and non-constrained area per lipid) were used to simulate ether lipid bilayers. Since simulations with and without cholesterol behave similarly, only the former will be discussed. In the first configuration, constant pressure was enforced, allowing lipid lateral area and transverse bilayer thickness to vary. The resulting lipid area was found to be significantly smaller than that predicted by experimental data, with the corresponding minima of the simulated form factors shifting to smaller Q values (Fig. S3). This lipid condensation phenomenon is ubiquitous in the MD simulation reports. For example, MD simulations underestimated POPG (1-palmitoyl-2-oleoyl-sn-glycero-3-phosphatidylglycerol) lipid area by 20%, leading to erroneous predictions regarding intra- and inter-molecular H-bonding and lipid-ion interactions 37. Sources contributing to the differences between experimental and simulated data, include different sample environment (e.g., curved vesicles in experiment versus flat bilayer patches in simulation) and the suboptimal parameterization of lipid force fields.
To minimize such discrepancies between experiment and simulation, a common practice is to tune MD simulations, such that accurately determined experimental form factors are reproduced. In practice then, lipid area was constrained to a value determined from model-based analysis of the experimental data. It should be noted that the experimental area per lipid, in addition to related structural parameters, is not model-free but is associated with the model which was used to analyze the experimental data. MD simulations therefore aid in building a realistic model by providing atomistic information. This iterative process of data analysis resulted in good agreement between the “raw” experimental form factors and the form factors calculated from fixed area MD simulations. Such agreement between the different data not only lends strong support to the validity of our MD simulations, but also to the SDP model used to fit the experimental data. It should be pointed out, however, that although our area constrained NAPnT simulations are able to reproduce the experimental form factors, the force field used (Table S3) is not optimal, as evidenced by the fact that the NPT simulations consistently underestimated lipid areas.
Cholesterol Tilt and Lipid Chain Spatial Density Distribution
Our fixed area MD simulations indicate that cholesterol’s planar tetracyclic ring is tilted by ~20° from the bilayer normal. It is possible that such a displacement from its upright orientation may be important in better enabling cholesterol to flip-flop between bilayer leaflets 38. Similar tilt angles have been reported for cholesterol in ester lipids 39–42. It has been argued that cholesterol’s tilt angle correlates directly with its ability to impart order 39. For example, in studying a series of cholesterol analogs (different chemical compositions at the tetracyclic ring), Poyry and coworkers reported that the sterol exhibiting the smallest tilt had the greatest effect on lipid chain ordering, supporting the notion that cholesterol’s ring structure has been optimized through evolution 43.
A major source contributing to cholesterol tilt is its ring asymmetric profile (Fig. S1). One would expect, for example, a difference in hydrocarbon chain packing in the vicinity of the smooth face versus the rough face, as lipid hydrocarbon chains near cholesterol’s smooth face are forced to adopt a more ordered conformation than chains residing in the vicinity of its rough face 44. To quantify this ring asymmetry effect, 3D spatial density distributions of neighboring lipid chains were calculated (Fig. 10). Indeed, an anisotropic density distribution was observed, with high and low density regions near the smooth and rough faces of the molecule, respectively. As a result, the gap near the rough face exerts less steric restraint, allowing for cholesterol to tilt in its direction. It is believed that the spatial distribution of hydrocarbon chains around cholesterol has important implications with regard to cholesterol’s condensation effect. In particular, it has been shown that the smooth face is better at ordering lipid chains than the rough face 44. Thus, it is conceivable that a larger chain density near cholesterol’s smooth face will impart a greater chain ordering effect.
Atomic-Level Interactions and their Possible Biological Implications
A feature made possible by atomistic MD simulations is the determination of abundant H-bonding between OH-Chol and the ether lipid’s phosphate oxygen. The presence of such H-bonding is in contrast to the situation in ester lipids. Although it is experimentally difficult to unambiguously identify the intermolecular H-bonding between the OH-Chol and its surrounding ester lipids (due in part to cholesterol’s dynamic and transient nature), atomistic MD simulations clearly show OH-Chol preferentially associating with the backbone carbonyl oxygen residing at the hydrocarbon-water interface. Smondyrev and Berkowitz found that H-bonding between OH-Chol and DPPC’s carbonyl oxygen is far more frequently observed than between OH-Chol and DPPC’s phosphate oxygen 45. In another study, Chiu et al. showed that the magnitude of the RDF peak (a direct measure of H-bonding) for OH-Chol/carbonyl oxygen in DPPC bilayers was much more pronounced than the peak for the OH-Chol/phosphate oxygen 46. Similarly in a DMPC bilayer, Pasenkiewicz-Gierula et al. showed that OH-Chol interacts more strongly with the carbonyl oxygen than with the phosphate oxygen, both in direct H-bonding and through water bridged association 47. However, these preferential associations are impaired in ether lipids.
To compensate for these missing interactions, OH-Chol is repositioned to the vicinity of the phosphate oxygen. Strong H-bonding interactions with the lipid’s phosphate moiety have profound implications on the molecular organization of membrane-active compounds. For example, it has been shown that a lipid’s phosphate moiety plays important roles in orchestrating membrane insertion of arginine monomers 48, anchoring of the antimicrobial peptide protegrin-1 49, and regulating the voltage-gated potassium channel 50. In ether bilayers, the prevalent association of OH-Chol with the phosphate oxygen also reduces the hydration level near the phosphate, as the interfacial water molecules that normally associate with the phosphate oxygen are displaced by the OH-Chol. The RDF of the water oxygen around the phosphate moiety confirms this dehydration effect when cholesterol is introduced into the membrane (Fig. S7). Moreover, compared to ester lipid bilayers, the OH-Chol in ether lipid bilayers is in closer contact with the phosphate oxygen (Fig. 8). This unique molecular arrangement may be essential in explaining the effect plasmalogens have on cholesterol efflux, a process essential in cholesterol trafficking 3. It is conceivable that the elevated cholesterol position in the ether membrane is more likely to increase cholesterol’s desorption rate, facilitating its extraction from cell membranes.
CONCLUSIONS
We used small-angle neutron and X-ray scattering, in addition to all-atom MD simulations, to study cholesterol’s molecular position and orientation in an ether lipid bilayer. MD simulations enabled the parsing of the ether bilayer into several components with distinct scattering characteristics, forming the basis of the SDP model used to analyze the experimental data. In turn, the structural parameters obtained from model analyses were used as input parameters for refined MD simulations, and from which detailed intermolecular interactions between cholesterol and ether lipids were determined. Compared to their ester lipid counterparts, ether lipids were found to interact very differently with OH-Chol. Specifically, in ether lipid bilayers OH-Chol primarily forms H-bonds with the phosphate oxygen, while in ester lipids the dominant interactions occur between OH-Chol and the backbone’s carbonyl oxygen. The different modes of interaction of the OH-Chol with ether lipids may explain the role played by plasmalogens in mediating cholesterol trafficking. Importantly, the present study also shows how different intermolecular interactions in a membrane environment can be invoked by modifying a lipid’s chemical composition.
Supplementary Material
Acknowledgments
This work is based on research conducted at Oak Ridge National Laboratory’s Spallation Neutron Source, which is sponsored by the Scientific User Facilities Division, Office of Basic Energy Sciences, U.S. Department of Energy, and Cornell High Energy Synchrotron Source (CHESS), which is supported by the National Science Foundation and the National Institutes of Health/National Institute of General Medical Sciences under National Science Foundation award DMR-0225180. We thank Robert Standaert for critical reading of the manuscript. JK is supported by ORNL’s Program Development (PD) and Laboratory Directed Research and Development (LDRD) programs. XC is partially supported by ORNL’s LDRD Seed Money program.
Footnotes
Molecular structures of cholesterol and DHPC, text describing sample preparation for scattering experiments, text describing molecular volume determination, systems and parameterization used in MD simulations, text describing detailed scattering density profile model analysis, direct comparison to a pure DHPC bilayer, scattering density profile model fits to DHPC/cholesterol mixtures, direct comparison to a DHPC bilayer with 20 mol% cholesterol, interfacial molecular structure of a pure DHPC leaflet, dehydration near DHPC phosphate moiety induced by the addition of cholesterol. This material is available free of charge via the Internet at http://pubs.acs.org.
References
- 1.Graessler J, Schwudke D, Schwarz PEH, Herzog R, Shevchenko A, Bornstein SR. Plos One. 2009;4(7):e6261. doi: 10.1371/journal.pone.0006261. [DOI] [PMC free article] [PubMed] [Google Scholar]
- 2.Pietiläinen KH, Sysi-Aho M, Rissanen A, Seppänen-Laakso T, Yki-Järvinen H, Kaprio J, Orešič M. Plos One. 2007;2(2):e218. doi: 10.1371/journal.pone.0000218. [DOI] [PMC free article] [PubMed] [Google Scholar]
- 3.Gorgas K, Teigler A, Komljenovic D, Just WW. BBA-Mol Cell Res. 2006;1763(12):1511–1526. doi: 10.1016/j.bbamcr.2006.08.038. [DOI] [PubMed] [Google Scholar]
- 4.Paltauf F. Chem Phys Lipids. 1994;74(2):101–139. doi: 10.1016/0009-3084(94)90054-x. [DOI] [PubMed] [Google Scholar]
- 5.Lingwood D, Simons K. Science. 2010;327(5961):46–50. doi: 10.1126/science.1174621. [DOI] [PubMed] [Google Scholar]
- 6.Maxfield FR, Tabas I. Nature. 2005;438(7068):612–621. doi: 10.1038/nature04399. [DOI] [PubMed] [Google Scholar]
- 7.Maxfield FR, Wustner D. J Clin Invest. 2002;110(7):891–898. doi: 10.1172/JCI16500. [DOI] [PMC free article] [PubMed] [Google Scholar]
- 8.Munn NJ, Arnio E, Liu DL, Zoeller RA, Liscum L. J Lipid Res. 2003;44(1):182–192. doi: 10.1194/jlr.m200363-jlr200. [DOI] [PubMed] [Google Scholar]
- 9.Maeba R, Maeda T, Kinoshita M, Takao K, Takenaka H, Kusano J, Yoshimura N, Takeoka Y, Yasuda D, Okazaki T, Teramoto T. J Atheroscler Thromb. 2007;14(1):12–18. doi: 10.5551/jat.14.12. [DOI] [PubMed] [Google Scholar]
- 10.Mandel H, Sharf R, Berant M, Wanders RJA, Vreken P, Aviram M. Biochem Bioph Res Co. 1998;250(2):369–373. doi: 10.1006/bbrc.1998.9321. [DOI] [PubMed] [Google Scholar]
- 11.Schedin S, Sindelar PJ, Pentchev P, Brunk U, Dallner G. J Biol Chem. 1997;272(10):6245–6251. doi: 10.1074/jbc.272.10.6245. [DOI] [PubMed] [Google Scholar]
- 12.Kučerka N, Holland BW, Gray CG, Tomberli B, Katsaras J. J Phys Chem B. 2012;116(1):232–239. doi: 10.1021/jp208920h. [DOI] [PubMed] [Google Scholar]
- 13.Pan JJ, Tieleman DP, Nagle JF, Kučerka N, Tristram-Nagle S. BBA-Biomembranes. 2009;1788(6):1387–1397. doi: 10.1016/j.bbamem.2009.02.013. [DOI] [PMC free article] [PubMed] [Google Scholar]
- 14.Kučerka N, Katsaras J, Nagle JF. J Membrane Biol. 2010;235(1):43–50. doi: 10.1007/s00232-010-9254-5. [DOI] [PMC free article] [PubMed] [Google Scholar]
- 15.Pan J, Heberle FA, Tristram-Nagle S, Szymanski M, Koepfinger M, Katsaras J, Kučerka N. BBA-Biomembranes. 2012;1818(9):2135–2148. doi: 10.1016/j.bbamem.2012.05.007. [DOI] [PMC free article] [PubMed] [Google Scholar]
- 16.Phillips JC, Braun R, Wang W, Gumbart J, Tajkhorshid E, Villa E, Chipot C, Skeel RD, Kalé L, Schulten K. J Comput Chem. 2005;26(16):1781–1802. doi: 10.1002/jcc.20289. [DOI] [PMC free article] [PubMed] [Google Scholar]
- 17.Klauda JB, Venable RM, Freites JA, O’Connor JW, Tobias DJ, Mondragon-Ramirez C, Vorobyov I, MacKerell AD, Pastor RW. J Phys Chem B. 2010;114(23):7830–7843. doi: 10.1021/jp101759q. [DOI] [PMC free article] [PubMed] [Google Scholar]
- 18.Feller SE, Yin DX, Pastor RW, MacKerell AD. Biophys J. 1997;73(5):2269–2279. doi: 10.1016/S0006-3495(97)78259-6. [DOI] [PMC free article] [PubMed] [Google Scholar]
- 19.Shinoda W, Shinoda K, Baba T, Mikami M. J Chem Phys. 2004;121(19):9648–9654. doi: 10.1063/1.1806791. [DOI] [PubMed] [Google Scholar]
- 20.Vorobyov I, Anisimov VM, Greene S, Venable RM, Moser A, Pastor RW, MacKerell AD. J Chem Theory Comput. 2007;3(3):1120–1133. doi: 10.1021/ct600350s. [DOI] [PubMed] [Google Scholar]
- 21.Brünger AT. X-Plor Version 3.1: A System for X-ray Crystallography and NMR. Yale University Press: The Howard Hughes Medical Institute and Department of Molecular Biophysics and Biochemistry; 1992. [Google Scholar]
- 22.Darden T, York D, Pedersen L. J Chem Phys. 1993;98(12):10089–10092. [Google Scholar]
- 23.Tuckerman M, Berne BJ, Martyna GJ. J Chem Phys. 1992;97(3):1990–2001. [Google Scholar]
- 24.Ryckaert JP, Ciccotti G, Berendsen HJC. J Comput Phys. 1977;23(3):327–341. [Google Scholar]
- 25.Feller SE, Zhang YH, Pastor RW, Brooks BR. J Chem Phys. 1995;103(11):4613–4621. [Google Scholar]
- 26.Martyna GJ, Tobias DJ, Klein ML. J Chem Phys. 1994;101(5):4177–4189. [Google Scholar]
- 27.Wiener MC, White SH. Biophys J. 1991;59(1):162–173. doi: 10.1016/S0006-3495(91)82208-1. [DOI] [PMC free article] [PubMed] [Google Scholar]
- 28.Heberle FA, Pan J, Standaert RF, Drazba P, Kučerka N, Katsaras J. Eur Biophys J. 2012;41:875–890. doi: 10.1007/s00249-012-0817-5. [DOI] [PubMed] [Google Scholar]
- 29.Kučerka N, Nagle JF, Sachs JN, Feller SE, Pencer J, Jackson A, Katsaras J. Biophys J. 2008;95(5):2356–2367. doi: 10.1529/biophysj.108.132662. [DOI] [PMC free article] [PubMed] [Google Scholar]
- 30.Petrache HI, Feller SE, Nagle JF. Biophys J. 1997;72(5):2237–2242. doi: 10.1016/S0006-3495(97)78867-2. [DOI] [PMC free article] [PubMed] [Google Scholar]
- 31.Kučerka N, Nieh MP, Katsaras J. BBA-Biomembranes. 2011;1808(11):2761–2771. doi: 10.1016/j.bbamem.2011.07.022. [DOI] [PubMed] [Google Scholar]
- 32.Edholm O, Nagle JF. Biophys J. 2005;89(3):1827–1832. doi: 10.1529/biophysj.105.064329. [DOI] [PMC free article] [PubMed] [Google Scholar]
- 33.Guler SD, Ghosh DD, Pan JJ, Mathai JC, Zeidel ML, Nagle JF, Tristram-Nagle S. Chem Phys Lipids. 2009;160(1):33–44. doi: 10.1016/j.chemphyslip.2009.04.003. [DOI] [PMC free article] [PubMed] [Google Scholar]
- 34.Mills TT, Toombes GES, Tristram-Nagle S, Smilgies DM, Feigenson GW, Nagle JF. Biophys J. 2008;95(2):669–681. doi: 10.1529/biophysj.107.127845. [DOI] [PMC free article] [PubMed] [Google Scholar]
- 35.Pan JJ, Mills TT, Tristram-Nagle S, Nagle JF. Phys Rev Lett. 2008;100(19):198103. doi: 10.1103/PhysRevLett.100.198103. [DOI] [PMC free article] [PubMed] [Google Scholar]
- 36.Pan JJ, Tristram-Nagle S, Nagle JF. Phys Rev E. 2009;80(2):021931. doi: 10.1103/PhysRevE.80.021931. [DOI] [PMC free article] [PubMed] [Google Scholar]
- 37.Zhao W, Rog T, Gurtovenko AA, Vattulainen I, Karttunen M. Biochimie. 2008;90(6):930–938. doi: 10.1016/j.biochi.2008.02.025. [DOI] [PubMed] [Google Scholar]
- 38.Bennett WFD, MacCallum JL, Hinner MJ, Marrink SJ, Tieleman DP. J Am Chem Soc. 2009;131(35):12714–12720. doi: 10.1021/ja903529f. [DOI] [PubMed] [Google Scholar]
- 39.Aittoniemi J, Rog T, Niemela P, Pasenkiewicz-Gierula M, Karttunen M, Vattulainen I. J Phys Chem B. 2006;110(51):25562–25564. doi: 10.1021/jp064931u. [DOI] [PubMed] [Google Scholar]
- 40.Olsen BN, Schlesinger PH, Baker NA. J Am Chem Soc. 2009;131(13):4854–4865. doi: 10.1021/ja8095224. [DOI] [PMC free article] [PubMed] [Google Scholar]
- 41.Marrink SJ, de Vries AH, Harroun TA, Katsaras J, Wassall SR. J Am Chem Soc. 2008;130(1):10–11. doi: 10.1021/ja076641c. [DOI] [PubMed] [Google Scholar]
- 42.Kučerka N, Perlmutter JD, Pan J, Tristram-Nagle S, Katsaras J, Sachs JN. Biophys J. 2008;95(6):2792–2805. doi: 10.1529/biophysj.107.122465. [DOI] [PMC free article] [PubMed] [Google Scholar]
- 43.Poyry S, Rog T, Karttunen M, Vattulainen I. J Phys Chem B. 2008;112(10):2922–2929. doi: 10.1021/jp7100495. [DOI] [PubMed] [Google Scholar]
- 44.Rog T, Pasenkiewicz-Gierula M, Vattulainen I, Karttunen M. BBA-Biomembranes. 2009;1788(1):97–121. doi: 10.1016/j.bbamem.2008.08.022. [DOI] [PubMed] [Google Scholar]
- 45.Smondyrev AM, Berkowitz ML. Biophys J. 1999;77(4):2075–2089. doi: 10.1016/S0006-3495(99)77049-9. [DOI] [PMC free article] [PubMed] [Google Scholar]
- 46.Chiu SW, Jakobsson E, Mashl RJ, Scott HL. Biophys J. 2002;83(4):1842–1853. doi: 10.1016/S0006-3495(02)73949-0. [DOI] [PMC free article] [PubMed] [Google Scholar]
- 47.Pasenkiewicz-Gierula M, Rog T, Kitamura K, Kusumi A. Biophys J. 2000;78(3):1376–1389. doi: 10.1016/S0006-3495(00)76691-4. [DOI] [PMC free article] [PubMed] [Google Scholar]
- 48.Herrera FE, Bouchet A, Lairion F, Disalvo EA, Pantano S. J Phys Chem B. 2012;116(15):4476–4483. doi: 10.1021/jp2096357. [DOI] [PubMed] [Google Scholar]
- 49.Khandelia H, Kaznessis YN. BBA-Biomembranes. 2007;1768(3):509–520. doi: 10.1016/j.bbamem.2006.11.015. [DOI] [PMC free article] [PubMed] [Google Scholar]
- 50.Andersson M, Freites JA, Tobias DJ, White SH. J Phys Chem B. 2011;115(27):8732–8738. doi: 10.1021/jp2001964. [DOI] [PMC free article] [PubMed] [Google Scholar]
Associated Data
This section collects any data citations, data availability statements, or supplementary materials included in this article.