

Abstract
In this paper, we propose a novel algorithm to detect text information from natural scene images. Scene text classification and detection are still open research topics. Our proposed algorithm is able to model both character appearance and structure to generate representative and discriminative text descriptors. The contributions of this paper include three aspects: 1) a new character appearance model by a structure correlation algorithm which extracts discriminative appearance features from detected interest points of character samples; 2) a new text descriptor based on structons and correlatons, which model character structure by structure differences among character samples and structure component co-occurrence; and 3) a new text region localization method by combining color decomposition, character contour refinement, and string line alignment to localize character candidates and refine detected text regions. We perform three groups of experiments to evaluate the effectiveness of our proposed algorithm, including text classification, text detection, and character identification. The evaluation results on benchmark datasets demonstrate that our algorithm achieves the state-of-the-art performance on scene text classification and detection, and significantly outperforms the existing algorithms for character identification.
Keywords: Text detection, Scene image, Character appearance, Structure modeling, Structure difference, Structure component co-occurrence, Character identification
1. Introduction
Text information plays a significant role in many applications including assistive navigation, image-based search, object recognition, scene understanding, and geocoding, etc., because it provides more descriptive and abstract information beyond intuitive perception of other objects. However, extracting text from natural scene images must solve three challenging problems. Firstly, it is difficult to predict the fonts, sizes, colors, and deformations of text characters and strings in natural scenes. They appear in multiple patterns and are attached onto all kinds of surfaces, such as signage boards, walls, cars, and objects. Further, they are often captured under variant illuminations and view angles. Secondly, in a camera-captured scene image, text regions with low frequency of occurrences are usually embedded into complex backgrounds. Many objects in background resemble text characters. Thirdly, it is difficult to define a general text structure model. Unlike face which is constantly composed of eyes, nose, cheeks, and chin, and human body which is constantly composed of head, torso, and limbs, text consists of all different words with a set of character combinations. Thus when we need to consider text as a general class in contrast to background outliers, it is difficult to develop a universal text descriptor. Although many optical character recognition (OCR) systems [38, 39, 40] were well developed to identify text characters in document images, text classification and detection in scene images are still open research topics. In this paper we focus on total 62 text characters including 10 digit numbers and 26 English letters with both upper and lower cases.
The task of text extraction from scene images can be divided into three steps [35]: text detection to extract text regions from camera-captured scene images, text segmentation to binarize text body within text regions, and text recognition to reveal the text information. This paper focuses on text detection to effectively extract image regions containing text. Figure 1 summarizes the whole framework of the proposed algorithm. To eliminate background outliers and extract scene text characters in various patterns, our algorithm combines layout analysis and text classification. We adopt color decomposition, character contour refinement, and string line alignment to crop out a set of image patches may contain text from scene images. These image patches are defined as character candidates. Then we design a new representative and discriminative text descriptor to model character appearances and structures. A text classifier is learned from text descriptors of training samples to predict the true positive text patches in character candidates.
Figure 1.

The whole framework of our proposed algorithm. Top row presents the process of layout analysis to generate character candidates in scene images with complex backgrounds, and bottom row presents the modeling of character appearance and structure to generate representative and discriminative text descriptor.
The main contributions of our proposed algorithms include three aspects: (1) a new structure correlation based character appearance model to obtain discriminative appearance features of text characters; (2) a novel text descriptor calculation by structons (e.g. structure difference modeling) and correlatons (e.g. the clustering centers of structure component co-occurrence vectors), which are obtained from structure difference modeling and structure component co-occurrences respectively; (3) a group of spatial layout analysis that combines color uniformity and character contour refinement to localize candidate text characters from scene image and adopts string line alignment to refine detected text regions.
2. Related Work
Many research efforts have been made to detect text regions in natural scene images [3, 8, 33]. The text detection algorithms can be roughly divided into two categories: rule-based algorithms and feature-based algorithms. The first category depends on spatial layout analysis based on text character contours. In this category of algorithms, a set of layout rules related to pixel-level process are defined. The common layout rules are involved in edge density, corner distribution, color uniformity, stroke width consistency, and string line alignment. An image region containing text usually possesses high edge density and gradient variation because of regular character contours in this region. In [23], horizontal and vertical scanning was performed on edge map derived from Laplacian operator to extract the rows and the columns with more edge pixels. Chen et al. employed maximally stable extreme regions which are obtained from enhanced edge map to find out character candidates in scene image [2]. However the constraint of edge density cannot handle complex background interferences which also generate high edge density such as foliage, grass and decoration texture in natural scenes. To solve the problem, some algorithms modeled the regional distributions and neighboring geometrical properties of corner pixels to extract the character contour. In [28], a circular template centered at each corner was built to calculate statistics of neighboring edge points, and the distributions of edge points were used as layout rules. In [37], a set of constraints such as area, saturation, and orientation, was defined on the basis of corner points to extract text regions from static video frames. In [26], zero crossing was performed in the map of gradient difference to calculate refined text regions. By the combinations of edge-based, corner-based, and gradient-based rules, text information can be extracted in well-organized patterns, like the video text. However, more robust rules are required to handle complex scene text with multiple patterns. It is observed that either strokes of a single text character or characters of a single text string in natural scene are most likely presented in same color. Thus if a scene image is decomposed by grouping the pixels in similar colors, the pixels belonging to a character or a string should be assigned into the same layer [10, 21]. Many text detection algorithms employ this rule to separate text information from background outliers in different colors [4, 19, 27]. Moreover, scene text mostly appears in the form of text strings rather than a single text character. In general, string is composed of a group of character members in uniform color, similar size, and approximately sequent alignment, while most background outliers do not have this property. Thus some previous algorithms heuristically searched edge map of scene image for aligned character contours, which would be grouped into text string lines and then evolved into text regions. In [29], a run-length searching method was proposed for merging the horizontal and vertical neighboring text characters into string lines. In [20], string lines in natural scene images were rectified by integrating 2D Euclidean, affine, and projective transformations. In [33], an adjacent character grouping method was proposed to search for sibling characters at each contour and then group them into string lines. However, string line alignment cannot eliminate all background outliers, such as lattices and brick walls. In addition, stroke width consistency is usually employed to localize the contour of character. As the basic elements of character structure, stroke can be used to define effective layout rules related to width consistency. In [7], horizontal scanning was performed to record the intensity variations around edge pixels, and calculate stroke width by the distance between two consecutive intensity impulses with equal magnitudes and opposite directions. In [8], stroke width transform was proposed to map each pixel into the width of its located stroke, and group the pixels corresponding to similar width into candidate text character.
Pixel-level layout analysis is effective on the design of text detectors, but it usually depends on hard-assigned parameters, which are non-adaptive to complex background interferences of natural scene images. In addition, the layout rules used in above algorithms were all developed by subjective selection, while some latent features of character structure are ignored. To model the inner structure of text characters, the second category of text detection algorithms depend on structure-related text descriptors extracted by specific local descriptors and filter responses. Kim et al. [11] considered text as specific texture and analyzed the textural features of characters by SVM models. Then a continuously adaptive mean shift algorithm was used to derive the refined boundaries of text regions. Chen et al. [3] employed 5 representative Haar-like filters on the map of intensity and gradient, joint histogram of intensity and gradient, and edge linking to extract features of character structure. Then an Adaboost model was applied to train text classifier from these features. Ma et al. [18] applied the Canny edge detection to multi-scale images to generate multiple edge maps, where HOG and LBP features were extracted to model character structures. Kumar et al. [12] proposed global matched wavelets to model text structures, and applied Fisher models and SVM models to generate text classifier. In [34], statistics of Gabor filter responses were applied on character strokes to extract text descriptors. In [15], a word shape coding algorithm was designed for document image retrieval, which modeled character structure by a group of components according to topological features and measured document similarity based on the frequency of occurrences of the structure components. Wang et al. [31] adopted HOG features to model character structures and normalized cross correlation to measure character similarity. In [30], they further applied a random ferns model to detect accurate character locations based on the scores of feature points in scene images.
3. Character Appearance Modeling by Structure Correlation
To build a robust text classifier which can effectively distinguish text characters from non-text background outliers, we model the character structure to extract text descriptors. Structure modeling of text character is based on appearance features, which are extracted from character samples by using state-of-the-art interest point detectors and feature descriptors. In this section, we will present a structure correlation algorithm to extract more discriminative appearance features of text characters.
To extract appearance features, we first detect interest points and their neighboring windows over a character sample. As shown in Figure 2, multi-scale saliency detector [13] and Harris corner detector [9] are employed to detect interest points in a character sample. Multi-scale saliency detector prefers blob parts, such as strokes and holes, in a character. Harris corner detector prefers corner points around the ends of a stroke and the joints of neighboring strokes in a character. The salient and corner points correspond to characteristic components of text characters, so we can extract characteristic appearance features of text characters. However, these appearance features are still not discriminative enough to classify text characters from non-text background outliers, because the interest point windows cover only stroke fragments of the character sample, in the form of bars or arcs. These stroke fragments cannot provide global modeling of character appearance. To solve this problem, we propose a model to calculate the correlation between local interest points and their counterparts of the character sample, and generate more complex and characteristic structure (see Figure 3), where discriminative features can be extracted to model character appearance.
Figure 2.
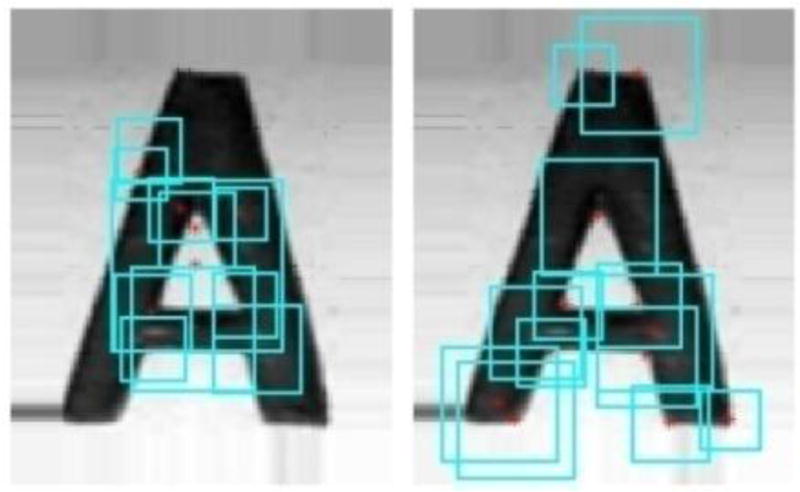
Detected interest points in red and their neighboring windows in cyan. The left is obtained from multi-scale saliency detector and the right is obtained from Harris corner detector.
Figure 3.

Two structure correlation examples. The cyan squares represent original detected interest point windows, and the red squares represent their corresponding symmetric counterparts. We extract the original windows and one of their symmetric counterparts (marked by red dash line), and calculate their correlated windows under absolute difference and reciprocal of sum.
For an interest point window w0, we use 3 symmetrical windows wi (1 ≤ i ≤ 3) as correlated counterparts of w0. They are generated with respect to horizontal midline, vertical midline and center of the image patch respectively, as shown in Figure 3. To combine the structure layout of w0 and its correlated counterparts, we define 4 types of structure correlations as Eq. (1), including sum, absolute difference, reciprocal of sum, and reciprocal of absolute difference. The 4 types of structure correlations could efficiently fuse the structure components of interest point window w0 and its 3 symmetrical counterparts, and ensure the values of the fused windows within a reasonable range.
| (1) |
Structure components generated by the fused windows can provide more discriminative appearance features of text character, although these components do not belong to original character structure. Then state-of-the-art feature descriptors, such as SIFT [14], HOG [5], and LBP, are employed to extract appearance features from the fused windows. Experimental results (see Section 6.1) prove structure correlation can significantly improve the performance of text classification.
4. Character Structure Modeling by Structon and Correlaton
Based on the appearance features, we model character structure and calculate representative text descriptor, which is a feature vector to be used as observation point in learning text classifier. In this section, we will introduce the training sets to be used in our experiments (Section 4.1). Then a set of visual words is calculated from the appearance features to describe the representative features of character structure (Section 4.2). Based on the visual words, we model structure differences (Section 4.3) and structure component co-occurrences (Section 4.4) for character samples to generate robust text descriptors. Figure 4 shows a flowchart of character structure modeling.
Figure 4.

A flowchart of character structure modeling based on appearance features in training set.
4.1. Training Set
First of all, a training dataset is built for learning text classifier, in which we use image patches of text characters as positive samples (character samples), and non-text regions of scene images as negative samples. In our algorithm, all the 62 categories of text characters are considered as a complete class, since we do not have to obtain accurate identification among character categories in text detection. The training dataset is divided into three subsets, which are named as Synthesized Training Set, Template Training Set, and Collected Training Set. The first subset consists of synthesized characters, and the last two subsets consist of scene text characters and non-text background outliers. The difference between Template Training Set and Collected Training Set lies in the choices of character samples according to difficulty of structure modeling. Some examples of the character samples from the three datasets are presented in Figure 5.
Figure 5.

Character examples in our training set: Synthesized Training Set (top row), Template Training Set (middle row), and Collected Training Set (bottom row).
Synthesized Training Set is to build visual words of character structure. It originates from the dataset of synthesized characters proposed in [32], which consists of about 66,000 normal characters in various fonts, which covers the 62 character categories. All the characters are synthesized by GIMP, so they have regular structure patterns with clean background. We select about 20,000 characters to build our Synthesized Training Set. Template Training Set is to model character structure by structure difference and structure component co-occurrence. It originates from Chars74K-GoodImg Dataset, which is composed of all 62 categories of text characters cropped from scene images. They appear in multiple fonts, sizes, colors, and orientations. We select about 2,400 scene characters not influenced by low resolution, excessive deformation or ambiguous occlusion, to be positive samples of Template Training Set. Therefore, the character samples in both Synthesized Training Set and Template Training Set present clear and regular structure patterns. The Collected Training Set is to extract text descriptors and learn text classifier. It originates from the scene images in ICDAR Robust Reading Dataset, which will be described in Section 6.2. In this dataset, there are about 4,000 character samples with more challenging structure deformations and background noises. Our ultimate text classifier learned from these datasets is able to distinguish scene characters from background outliers.
4.2. Visual Words for Modeling Character Structures
On the basis of bag-of-words model, we project the appearance features of each character sample into a histogram of visual words, for modeling text character structure. The codebook of visual words is built from Synthesized Training Set, where we select about 21,000 synthesized character samples. Compared to text characters cropped from scene images, synthesized characters provide more accurate and complete structure. We extract appearance features by structure correlations at the detected interest points of synthesized character samples, and apply K-means clustering to all the extracted appearance features from the dataset. The clustering centers of appearance features are used as visual words of character structures. In our experiments, appearance features derived from Harris corner detector will generate 64 visual words, and those from Multi-scale saliency detector will generate 48 visual words. They compose a vocabulary to represent a universal description of character structures.
For each sample in Template Training Set and Collected Training Set, we can extract its appearance features and quantize each feature into the closest visual word. Then the sample is projected into a visual word histogram. However, it is improper to apply the visual word histograms directly to scene text classification for three reasons. First, visual words only correspond to representative appearance features of regular character structure patterns from synthesized images, but the character samples from scene images have variant appearance patterns, structure deformations, and background interferences. Second, although text characters are regarded as a whole class, the structure differences between different categories of characters cannot be ignored, because they generate different visual word histograms. Third, negative samples in the training set have no formal structure definitions from the perspective of visual word. Negative samples in training set might be image patches cropped from any objects, textures, or background noises in scene images. Thus visual word histograms could not be an effective text descriptor for accurately distinguishing positive character samples from negative samples.
4.3. Structons: Character Structure Difference Modeling
To solve the above problems and obtain more robust text descriptor, we model structure differences based on visual word histograms. Structure difference keeps consistent under character deformations and background noises. Here, we focus on the structure difference between text characters and non-text background outliers. To model character structure, we build structon from visual word histograms of character samples in Template Training Set. At first, we calculate the visual word histograms of all character samples by quantizing their appearance features into the nearest visual word. Then, K-means clustering is applied to build a set of K structons, which are used as structure representation of text characters, as shown in Figure 6. The set of structons is denoted as S. Next, for each negative sample in Template Training Set, we employ the same process to extract its appearance features and project it into a visual word histogram. However, clustering mechanism cannot generate accurate structure representation of non-text background outliers in negative samples, because their structure characteristics are undefined and negative samples are impossible to cover all background outliers.
Figure 6.

The process of calculating text descriptor by structure difference modeling based on structons, which are calculated from visual word histograms of the samples in Template Training Set.
To model structure difference based on the structons of text characters and visual word histograms of negative samples, we employ the information-theoretical metric learning (ITML) [6] to learn a proper distance metric for measuring the distances between them. ITML is defined based on a Mahalanobis distance as Eq. (2),
| (2) |
where M is a semi-positive definite matrix, and vi and vj represent two vectors corresponding to text structons or visual word histograms in our algorithm. In Eq. (2), M defines a distance metric. If M is an identity matrix, Mahalanobis distance will transform into regular Euclidean distance. ITML is to learn a matrix M over the structons by using Bregman’s cyclic projection algorithm, such that the inter-class Mahalanobis distances are maximized, while the intra-class Mahalanobis distances are minimized.
We divide the visual word histograms of negative samples randomly into 40 groups, and each group Gj contains K elements, the same number as character structons. Then we learn the Mahalanobis distance metric between the character structons and each of the groups by Eq. (3), and calculate the distance metric maximizing the distance sum from structons to all the groups, as Eq. (4). Experimental results (see Section 6.1) demonstrate that Mahalanobis distance based on ITML learning improves the performance of text classification compared to regular Euclidean distance associated with M as identity matrix.
| (3) |
| (4) |
In our experiments, K is set to be 128, so the total number of structons from positive samples and negative samples is 256. Figure 6 depicts the processes of text descriptor calculation from a sample in Collected Training Set. At first, we extract its appearance features by structure correlation and project them into a visual word histogram. Next, according to Mahalanobis distance associated with the learned matrix M, we calculate the distances between the histogram and each of the 256 structons, generating a 256-dimensional feature vector of structon distances as text descriptor, to be used for learning text classifier.
4.4. Correlatons: Character Structure Component Co-occurrence
Structure component co-occurrence proved to be effective on image retrieval and object modeling [24]. It encodes spatial arrangements of interest points where appearance features are extracted. Two or more structure components are very likely to come up together. We define correlatons to model the structure component co-occurrence of a character sample based on visual word histograms. In this process, appearance features are projected into visual word histograms in a more tolerant way to be adaptive to structure deformations and background noises. We quantize appearance feature into 4 nearest visual words by different weights. The nearest visual word is still assigned 1, but the second nearest is assigned 0.7, the third nearest is assigned 0.4, and the fourth nearest is assigned 0.2. The generated histogram is defined as tolerant visual word histogram (TVH).
To model the spatial arrangement of the detected interest points in a character sample, the sample is sliced into four parts by a horizontal and a vertical division (see Figure 7). We calculate TVHs for the 4 parts and cascade them into a complete TVH denoted as h. At this TVH h, the values at each pair of visual words are compared to model visual word co-occurrences. We define a measurement of visual word co-occurrences by Eq. (5).
Figure 7.

The process of calculating text descriptor by structure component co-occurrence based on correlatons, which are calculated from cascaded TVHs of the samples in Template Training Set.
| (5) |
where h(i) denotes the number of assignments at the i-th visual word, c(i,j) is to measure the frequency of co-occurrences at a pair of visual words h(i) and h(j), and λ is a balance coefficient which is set as 3 in our experiments. This formula defines that larger and closer assignment values in the histogram represent higher probability of co-occurrences.
By Eq. (5), each training sample generates a co-occurrence matrix c based on its TVH. For further process, this co-occurrence matrix is transformed into a co-occurrence vector by cascading all its rows. However, due to the computational complexity, we do not directly use the co-occurrence feature vector as text descriptor, but model the differences of visual word co-occurrences between training samples in Template Training Set and those in Collected Training Set. We generate co-occurrence vector from Template Training Set by applying K-means algorithm to cluster them into correlatons, which are defined as the clustering centers of co-occurrence vectors. In our experiment, K is set to be 128 and we obtain a total of 256 correlatons from p ositive and negative samples. Then, similar to structon-based text descriptor, for any sample, we calculate the distance from its co-occurrence vector to each of the K correlatons, generating a correlaton-based text descriptor in 256 dimensions. Figure 7 illustrates the whole process of structure modeling based on structure component co-occurrences.
5. Layout Analysis
In our algorithm, layout analysis is to find out character candidates from scene images. It is carried out twice, before and after text classification respectively. The first time is to decompose the edge map of scene image into multiple layers according to color uniformity, and find out proper contours as character candidates in each layer. The second time is to refine the predicted characters from text classifier to obtain accurate text regions with aligned characters. This section will describe the involved algorithms of layout analysis in our algorithm.
5.1. Color Decomposition
Color uniformity exists in both scene text characters and their located surfaces in natural scenes, so we infer that edge pixels in the same character are generated from similar color-pairs. Here a color-pair is defined as a vector of respective RGB values of two colors. To represent an edge pixel by color-pair and spatial position, we denote it by e = 〈r1, g1, b1, r2, g2, b2, y, y, y〉, where the first 6 elements denote color-pair and the vertical coordinate y is repeatedly extended to 3 dimensions for keeping consistent with the RGB colors.
To extract character candidates from background outliers, we cluster edge pixels in similar color-pairs and close spatial positions, which are generated by color difference between text and its located surface. Firstly, a color-pair is calculated at each edge pixel p0. In original scene image, we create a 5×5 neighborhood centered at p0, in which the two neighboring pixels with maximum color difference are selected to compose the representation e0 of edge pixel p0. Secondly, given all edge pixels from the scene images as E = {ei |1 ≤ i ≤ NE}, where NE represents the total number of edge pixels. Gaussian Mixture Model (GMM) is employed to cluster the edge pixels into multiple layers. We apply expectation maximization (EM) algorithm to estimate the parameters of GMM model. EM is able to estimate the parameters leading to maximum likelihood under in complete data. In our process, we expect to use a mixture of K Gaussian distributions to describe the color-pairs and spatial positions of edge pixels, where their representations E are regarded as observation points. But the mean and variance of the K Gaussian distributions in the mixture model are unknown. Thus EM is applied to maximize the expected likelihood by Eq. (6).
| (6) |
where e represents the observation points, wi represents the weights of the i-th Gaussian distribution in the mixture model, and θi represents the parameters of the i-th Gaussian distribution including means and variances. When EM process is converged to an optimized GMM model Θ*, each edge pixel e0 will be assigned to the t-th Gaussian distribution where it generates maximum likelihood such that for all 1 ≤ i ≤ K. We set K = 5 in our experiments, so the edge pixels will be assigned to 5 different layers. Some examples of color-based edge map decomposition are displayed in Figure 8.
Figure 8.

(a) Original scene image and corresponding edge map. (b) Edge map decomposition based on the color-pairs and spatial positions of the edge pixels.
5.2. Character Contour Refinement
We search for object contours to localize character candidates at each layer of edge pixels. A simple method is to find out the groups of connected edge pixels [33]. However, due to the illumination variation and the estimation error of GMM-based clustering, contours of an object (probably text character) are usually broken into several segments by small cracks. In this case, we propose a heuristic construction method to extract object contours under proper crack tolerance. Firstly, we initialize an empty contour C and start the edge pixel search. Secondly, we randomly select an edge pixel p0 and insert it into the contour by C := C ∪ {p0}. Thirdly, an NR × NR neighborhood is built centered at p0, and we check if there are any other edge pixels within the neighborhood except p0. If no, the construction process ends and we output the constructed contour C. If yes, we select the nearest edge pixel p1 to p0 and insert it into the contour by C := C ∪ {p1}. Then we go to the third step and start a new iteration by creating a new NR × NR neighborhood centered at p1 (see Figure 9(a)). To avoid duplicate edge pixel selection, a selected edge pixel will not be set as background pixel in further process, as the green pixels shown in Figure 9(a). By using the neighborhood tolerance, we can restore the broken contours. In our experiments, we set NR as 9. In addition, we observe that a text character mostly has a closed contour, where the first inserted edge pixel is very close to the last inserted edge pixel. To reduce the time complexity, we set a threshold 36 over the distance between two end edge pixels to remove the open contours. At each of the remaining contours, a rectangle bounding box is assigned to generate the image patch of character candidate. The image patch is then input into text classifier to predict whether it is text patch or not. The image patches with positive predictions will compose text regions.
Figure 9.

(a) Character contour refinement, where green points represent the selected edge pixels in previous iterations and two square neighborhoods are created by using p0 and p1 as centers respectively. (b) In the top row, two object contours in black bounding boxes satisfy the layout rules in string line alignment; in the bottom row, two object contours in green bounding boxes do not satisfy one of the layout rules in string line alignment.
5.3. String Line Alignment
After text classification, we perform string line alignment on the predicted text patches to further remove the false positive detections. For a text patch T0, we search for a sibling T with similar height, horizontal alignment, and proper ratio between distance and width, as shown in Figure 9(b). We define the three rules by Eq. (7),
| (7) |
where h0 and h represent the height of T0 and T respectively, w0 and w represent the width of T0 and T respectively, and (x0, y0) and (x, y) represent patch center coordinates of T0 and T respectively. The rules ensure that T0 comes from a text string with more than 2 aligned character members. If no such sibling satisfies all the rules, the text patch T0 will be removed as false positive. In the end, all the remaining text patches will be merged into text regions.
6. Experiments
We carry out three groups of experiments to evaluate the effectiveness of our proposed algorithm. Firstly, text classification is performed to evaluate text descriptor by distinguishing image patches of text characters from those of background outliers. Secondly, we combine layout analysis and text character classification to perform text detection from scene images in 3 benchmark datasets. Thirdly, we use the proposed text descriptors to perform character identification among the character categories.
6.1. Text Classification
Text classification is to evaluate the appearance features based on structure correlation, and the structon-based and correlaton-based text descriptors. These experiments are performed on a set of image patches, in which image patches accommodating text characters in compatible sizes are used as positive samples and the other patches are as negative samples. The performance of text classification is measured by recall and precision. We define recall as the ratio between the number of correctly predicted positive samples and the total number of truth positive samples, and define precision as the ratio between the number of correctly predicted positive samples and the total number of samples being predicted as positive. Recall and Precision are associated with true positive rate and false alarm rate respectively.
To evaluate the structure correlation, we extract two groups of appearance features from the samples in training set. In one group, structure correlation is performed to combine the symmetric counterparts of interest point windows to extract appearance features. In the other group, appearance features are directly extracted from interest point windows. Then the extracted appearance features of each sample are projected into a visual word histogram, and then SVM-based cross validation is performed on the visual word histograms of all samples. In this process, we divide the samples in Template Training Set into 5 subsets, of which four are used for training the SVM-based text classifier and one is used for testing. 5 iterations of performance evaluations are performed in turn for cross validation, and the average value is calculated as evaluation results. By setting thresholds of the SVM prediction probability, we generate curves to illustrate the true positive rates and false positive rates in text classification, as depicted in Figure 10. The evaluation results demonstrate that structure correlation is able to generate more discriminative appearance features and achieve better performance under all the involved feature descriptors.
Figure 10.

Evaluation results of text classification. Text descriptors derived from structure correlation perform better than those directly derived from interest point windows. In addition, text descriptor presented by left figure is calculated from appearance features under Harris-Corner detector and HOG descriptor, and the right one is obtained from appearance features under Harris-corner detector and SIFT descriptor.
To evaluate the text descriptors obtained by character structure modeling involved in structons and correlatons, text classification experiments are further performed on the image patches in Collected Training Set. We select about 4000 text patches as positive samples and 12500 non-text patches as negative samples. The positive samples are cropped ground truth text regions from scene images of ICDAR Robust Reading Dataset (see detailed introduction in Section 6.2). The negative samples are collected from non-text regions of scene images, in which we prefer the neighborhoods of text regions and the objects usually appearing together with text.
In our experiments, 2 types of interest point detectors including multi-scale saliency detector and Harris corner detector, and 3 types of state-of-the-art feature descriptors including HOG, SIFT, and LBP are adopted to extract appearance features of text characters. Figure 11 illustrate the respective experimental results of text classification by the “Recall/1-Precision” curves. The cyan curves represents that visual word histogram is directly used as text descriptor. The green curves represents that the structon distances are added into text descriptor. The blue curves represents that the correlaton distances are added into text descriptor.
Figure 11.

Evaluation results of text classification through text descriptors obtained from character structure modeling. We perform 6 experiments by using the combinations of 2 interest point detectors and 3 state-of-the-art feature descriptors.
The experimental result demonstrates that the structure difference modeling and structure component co-occurrence are able to improve the performance of text classification. It also shows that text descriptor from Harris corner detector performs better than that from multi-scale saliency detector in text classification, so we could infer that character structure depends more on the junctions of neighboring strokes. Furthermore, HOG descriptor performs a little better than SIFT and LBP over corner points, while SIFT descriptor performs a little better than HOG and LBP over salient points. It is probable that SIFT descriptor is mostly associated with the feature points extracted by SIFT detector which relies on the local extremes of multi-scale Difference of Gaussians, so SIFT is more compatible with Multi-scale saliency points than Harris-corners points. LBP was mostly used for texture classification, but character structure generates much less discriminative variations of binary patterns as texture.
To evaluate the text descriptor from different structons/correlatons sizes, we perform text classification over 64, 128, 256, 512 and 1024 structons/correlatons respectively. All the text descriptors in this experiment are based on corner detector and HOG descriptor. The experimental results illustrated in Figure 12 show that the larger number of structons/correlatons can improve the accuracy of text classification, but the accuracy improvement after 128 or more is limited. We use 256 structons and 256 correlatons to build the proposed text descriptor (see Section 4), as a result of trade-off between accuracy and efficiency.
Figure 12.

Evaluation results of text classification from Corner detector and HOG descriptor under the different numbers of structons/correlatons.
6.2. Text Detection
We perform text detection in 3 benchmark datasets and extract the text regions from each scene image. It requires the close cooperation between layout analysis and text classification. We carry out text detection in Robust-Reading-2003 Dataset, Robust-Reading-2011 Dataset, and Street View Text Dataset. In all the text detection experiments, we adopt Harris Corner Detector and HOG Descriptor to generate the text classifier. To measure the performance of our algorithm, we use precision and recall calculated from the area comparisons between detected text regions and ground truth text regions. Their intersections are true positive text regions successfully extracted from natural scene background. Precision p is defined as the ratio between area of intersection regions and that of detected text regions, recall r is obtained from the ratio between area of intersection regions and that of ground truth regions. In addition, f-measure based on harmonic sum is defined in Eq. (8) to fuse precision and recall.
| (8) |
The Robust Reading Dataset (RRD2003) was collected for text detection competition in the conference ICDAR 2003 [16]. It contains about 500 natural scene images, with the resolutions ranging from 640×480 to 1600×1200. In the scene images of RRD, text information appears in signage boards or object captions. Both indoor and outdoor environments are covered in this dataset, and there is no drastic illumination change in most scene images. RRD contains about 2000 ground truth text regions in total. Table 1 presents the evaluation results and the comparisons with previous algorithms on RRD2003 dataset. It demonstrates that the performance of our algorithm is comparable with state-of-the-art algorithms. Some examples of detected text regions are shown in Figure 13.
Table 1.
Evaluation results of text region detection on RRD2003 dataset. We compare our results with several previous algorithms in [8, 16, 17].
| Precision | Recall | f-measure | |
|---|---|---|---|
| Ours | 0.71 | 0.62 | 0.63 |
|
| |||
| B. Epshtein | 0.73 | 0.60 | 0.66 |
| H. Becker | 0.62 | 0.67 | 0.62 |
| C. Yi | 0.71 | 0.62 | 0.62 |
| A. Chen | 0.60 | 0.60 | 0.58 |
| Ashida | 0.55 | 0.46 | 0.50 |
| HW David | 0.44 | 0.46 | 0.45 |
| Wolf | 0.30 | 0.44 | 0.35 |
| Q. Zhu | 0.33 | 0.40 | 0.33 |
Figure 13.

Some examples of text region detection on RRD2003 dataset, where the detected regions are marked in cyan.
The Robust-Reading-2011 Dataset (RRD2011) was collected for text detection competition in the conference ICDAR 2011 [25]. It contains about 400 natural scene images and 1694 ground truth text regions. They have similar resolutions and contexts as the scene images on RRD2003. We use both of them to evaluate our algorithm. Table 2 presents the evaluation results and the comparisons with previous algorithms on RRD2011 dataset. Our algorithm is comparable with the previous algorithms.
Table 2.
Evaluation results of text region detection on RRD2011 dataset. We compare our results with several previous algorithms in [25].
| Precision | Recall | f-measure | |
|---|---|---|---|
| Ours | 0.76 | 0.68 | 0.67 |
|
| |||
| Kim | 0.62 | 0.83 | 0.71 |
| Yi | 0.58 | 0.67 | 0.62 |
| TH-TextLoc | 0.58 | 0.67 | 0.62 |
| Neumann | 0.53 | 0.69 | 0.60 |
| TDM_IACS | 0.54 | 0.64 | 0.58 |
| LIP6-Retin | 0.50 | 0.63 | 0.56 |
| KAIST-AIPR | 0.45 | 0.60 | 0.51 |
| ECNU-CCG | 0.38 | 0.35 | 0.37 |
| Text-Hunter | 0.26 | 0.50 | 0.34 |
The Street View Text Dataset (SVT) [30, 31] was collected from Google street view. It is more challenging than RRD, because the scene images in this dataset come from outdoor environments with illumination variations. The text characters usually have low resolutions and are embedded into complex background outliers. It contains about 350 scene images and 900 ground truth text regions in total. On SVT, due to more complex background interferences, more false positive detections are generated, so the precision is much lower than that in RRD. We obtain the performance as precision 0.36, recall 0.63, and f-measure 0.37. Figure 14 depicts some examples of detected text regions from the scene images on SVT dataset.
Figure 14.

Some result examples of text region detection on SVT dataset, where the detected regions are marked in cyan.
Some examples of detection failures are depicted in Figure 15. Most of them are caused by signage with single-character, non-uniform color, lower resolution, or over-exposure, which cannot generate complete character boundary for layout analysis and character candidate selection. Some others are caused by non-regular text such as hand-written fonts and art fonts, since they cannot be correctly predicted by text classifier learned from machine print text fonts.
Figure 15.
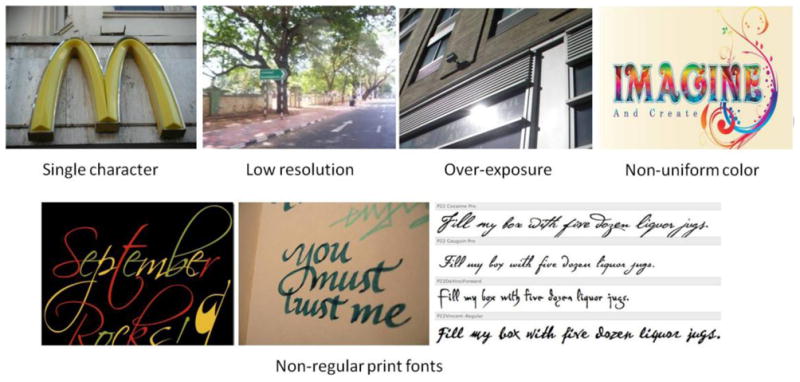
Some failure examples of text detection, which are caused by text with single character, low resolution, overexposure, non-uniform color, and non-regular print fonts.
6.3. Character Identification
The structon and correlaton based text descriptors are designed to distinguish text characters from background outliers in scene images. However, we find that they can further be applied to character identification within the 62 categories. We cascade the text descriptors obtained from Harris-corners, multi-scale saliency, maximally stable extremal region and random selected feature points, and employ them to evaluate the performance of character identification over Chars74K training dataset. The evaluation process is based on the method described in [1]. In the first round, 15 character samples are selected from each class as training samples. In the second round, 5 character samples are selected from each class as training samples. In each round, we create several groups of training samples and testing samples and perform SVM-based cross validation among them. Then the average values of all iterations of cross validations are calculated as final evaluation results. Table 3 presents the results of character identification, where the two rounds are denoted as Chars74K-15 and Chars74K-5 respectively. The experimental results show that our proposed text descriptor outperforms the previous algorithms [30, 31] for character identification.
Table 3.
Results of character identification on Chars74K dataset, which demonstrates that our proposed text descriptor outperforms previous algorithms
| Text Feature Descriptors | Chars74K-5 | Chars74K-15 |
|---|---|---|
| Structon + Correlaton+SVM | 49.8 | 66.7 |
|
| ||
| HOG+NN | 45.33±0.99 | 57.5 |
| MKL | / | 55.26 |
| GB+NN | 36.9±1.0 | 47.09 |
| SC+NN | 26.1±1.6 | 34.41 |
7. Conclusion
We have proposed a text detection algorithm by combining layout analysis based on character candidate localization and text classification based on extracting character structure features. Our algorithm effectively addresses the three challenging problems in scene text detection: character category uncertainty, structure pattern variation, and background outlier elimination. At first, we have proposed a structure correlation model to extract discriminative appearance features of characters by local descriptors. Then in order to handle structure deformations and background noises widely existing in scene character samples, we define structons and correlatons to model the character structures based on the visual words constructed from synthesized characters with regular structure patterns. Structons is to model structure differences among positive character samples. An ITML distance metric is adopted to learn a Mahalanobis distance to measure the structon distances. Correlaton is to model structure component co-occurrences by tolerant visual word histograms. A co-occurrence measurement is defined to calculate the visual word co-occurrences at character samples. Experimental results demonstrate that structons and correlatons can effectively improve the performance on text classification. It proves that our algorithm of character structure modeling extract robust text descriptors to distinguish text from background outliers. To detect text regions in scene images, we have presented layout analysis involved in color-difference-based decomposition, gap-tolerant character contour extraction, and horizontal string alignment. By fusion of layout analysis and text classification, we have achieved good performance on text detection in comparison with state-of-the-art algorithms and significantly outperform the existing algorithms for character identification.
In future work, we will employ lexicon models to improve the performance of text detection in scene images, because it can provide semantic information for heuristic localization of text characters and strings. Furthermore we will extend our text detection algorithm into the process of non-horizontal and deformed text strings.
The main contributions of this paper are summarized as the following points:
Distinguishing text characters from non-text background outliers.
Detecting text regions from natural scene images with complex background.
Identifying scene characters from 62 categories, including 10 digits and 26 English letters in upper and lower cases.
Proposing structure correlation to model appearance of scene character.
Designing a new text descriptor based on structure difference and structure componentco-occurrence of scene character.
Combining a group of layout rules involved in color uniformity and string alignment to localize candidate image patches that probably contain text.
Acknowledgments
This work was supported in part by NSF grant IIS-0957016, EFRI-1137172, NIH 1R21EY020990, DTFH61-12-H-00002, and ARO grant W911NF-09-1-0565.
Footnotes
Publisher's Disclaimer: This is a PDF file of an unedited manuscript that has been accepted for publication. As a service to our customers we are providing this early version of the manuscript. The manuscript will undergo copyediting, typesetting, and review of the resulting proof before it is published in its final citable form. Please note that during the production process errors may be discovered which could affect the content, and all legal disclaimers that apply to the journal pertain.
Contributor Information
Chucai Yi, Email: cyi@gc.cuny.edu.
Yingli Tian, Email: ytian@ccny.cuny.edu.
References
- 1.de Campos T, Babu B, Varma M. Character recognition in natural images. Proceedings of the International Conference on Computer Vision Theory and Applications (VISAPP) 2009 [Google Scholar]
- 2.Chen H, Tsai S, Schroth G, Chen D, Grzeszczuk R, Girod B. Robust text detection in natural images with edge enhanced maximally stable extremal regions. Proceedings of International Conference on Image Processing. 2011:2609–2612. [Google Scholar]
- 3.Chen X, Yuille A. Detecting and Reading Text in Natural Scenes. Proceedings of IEEE Conference on Computer Vision and Pattern Recognition. 2004;2:II-366–II-373. [Google Scholar]
- 4.Chen X, Yang J, Zhang J, Waibel A. Automatic Detection and Recognition of Signs From Natural Scenes. IEEE Transactions on Image Processing. 2004;13(1):87–99. doi: 10.1109/tip.2003.819223. [DOI] [PubMed] [Google Scholar]
- 5.Dalal N, Triggs B. Histograms of oriented gradients for human detection. Proceedings of IEEE Conference on Computer Vision and Pattern Recognition. 2005;1:886–893. [Google Scholar]
- 6.Davis J, Kulis B, Jain P, Sra S, Dhillon I. Information-theoretic Metric Learning. Proceedings of 24th International Conference on Machine Learning. 2007:209–216. [Google Scholar]
- 7.Dinh V, Chun S, Cha S, Ryu H, Sull S. An Efficient Method for Text Detection in Video Based on Stroke Width Similarity. Proceedings of Asian Conference on Computer Vision. 2007;1:200–209. [Google Scholar]
- 8.Epshtein B, Ofek E, Wexler Y. Detecting text in natural scenes with stroke width transform. Proceedings of IEEE Conference on Computer Vision and Pattern Recognition. 2010:2963–2970. [Google Scholar]
- 9.Harris C, Stephens M. A combined corner and edge detector. Proceedings of the Fourth alvey vision conference. 1988:147–151. [Google Scholar]
- 10.Huang J, Kumar S, Mitra M, Zhu W, Zabih R. Image indexing using color correlograms. Proceedings of IEEE Conference on Computer Vision and Pattern Recognition. 1997:762–768. [Google Scholar]
- 11.Kim KI, Jung K, Kim JH. Texture-based approach for text detection in images using support vector machines and continuously adaptive mean shift algorithm. IEEE Trans on Pattern Analysis and Machine Intelligence. 2003;25(12):1631–1639. [Google Scholar]
- 12.Kumar S, Gupta R, Khanna N, Chaudhury S, Joshi SD. Text Extraction and Document Image Segmentation Using Matched Wavelets and MRF Model. IEEE Transactions on Image Processing. 2007;16(8):2117–2128. doi: 10.1109/tip.2007.900098. [DOI] [PubMed] [Google Scholar]
- 13.Kadir T, Brady M. Saliency, scale, and image description. International Journal of Computer Vision. 2001;45(2):83–105. [Google Scholar]
- 14.Lowe D. Distinctive image features from scale-invariant keypoints. International Journal of Computer Vision. 2004;60(2) [Google Scholar]
- 15.Lu S, Tan CL. Retrieval of machine-printed Latin documents through Word Shape Coding. Pattern Recognition. 2008;41(5):1799–1809. [Google Scholar]
- 16.Lucas SM, Panaretos A, Sosa L, Tang A, Wong S, Young R. ICDAR 2003 Robust Reading Competitions. Proceedings of the International Conference on Document Analysis and Recognition. 2003:682–687. [Google Scholar]
- 17.Lucas SM. ICDAR 2005 text locating competition results. In Proceedings of the International Conference on Document Analysis and Recognition. 2005;1:80–84. [Google Scholar]
- 18.Ma L, Wang C, Xiao B. Text detection in natural images based on multi-scale edge detection and classification. In International Congress on Image and Signal Processing (CISP) 2010;4:1961–1965. [Google Scholar]
- 19.Mancas-Thillou C, Gosselin B. Spatial and Color Spaces Combination for Natural Scene Text Extraction. Proceedings of IEEE Conference on Image Processing (ICIP) 2006:985–988. [Google Scholar]
- 20.Myers GK, Bolles RC, Luong QT, Herson JA, Aradhye HB. Rectification and recognition of text in 3-D scenes. International Journal on Document Analysis and Recognition. 2004:147–158. [Google Scholar]
- 21.Nikolaou N, Papamarkos N. Color Reduction for Complex Document Images. International Journal of Imaging Systems and Technology. 2009;19:14–26. [Google Scholar]
- 22.Ojala T, Pietikäinen M, Harwood D. A Comparative Study of Texture Measures with Classification Based on Feature Distributions. Pattern Recognition. 1996;29:51–59. [Google Scholar]
- 23.Phan T, Shivakumara P, Tan CL. A Laplacian Method for Video Text Detection. In the 10th International Conference on Document Analysis and Recognition. 2009:66–70. [Google Scholar]
- 24.Savarese S, Winn J, Criminisi A. Discriminative object class models of appearance and shape by correlations. Proceedings of IEEE Conference on Computer Vision and Pattern Recognition. 2006;2:2033–2040. [Google Scholar]
- 25.Shahab A, Shafait F, Dengel A. ICDAR 2011 Robust Reading Competition Challenge 2: Reading Text in Scene Images. In International Conference on Document Analysis and Recognition (ICDAR) 2011 [Google Scholar]
- 26.Shivakumara P, Huang W, Tan CL. An Efficient Edge based Technique for Text Detection in Video Frames. The Eighth IAPR Workshop on Document Analysis Systems. 2008:307–314. [Google Scholar]
- 27.Sobottka K, Kronenberg H, Perroud T, Bunke H. Text Extraction from Colored Book and Journal Covers. Proceedings of International Conference on Document Analysis and Recognition. 1999;2(4):163–176. [Google Scholar]
- 28.Wan M, Zhang F, Cheng H, Liu Q. Text localization in spam image using edge features. Proceedings of International Conference on Communications, Circuits and Systems (ICCCAS) 2008:838–842. [Google Scholar]
- 29.Wang D, Srihari S. Classification of newspaper image blocks using texture analysis. In Computer Vision, Graphics, and Image Processing. 1989;47(3):327–352. [Google Scholar]
- 30.Wang K, Babenko B, Belongie S. End-to-End scene text recognition. Proceedings of International Conference on Computer Vision. 2011:1457–1464. [Google Scholar]
- 31.Wang K, Belongie S. Word spotting in the wild. Proceedings of European Conference on Computer Vision. 2010:591–604. [Google Scholar]
- 32.Weinman J, Learned-Miller E, Hanson A. Scene text recognition using similarity and a lexicon with sparse belief propagation. IEEE Transactions on PAMI. 2009;31(10):1733–1746. doi: 10.1109/TPAMI.2009.38. [DOI] [PMC free article] [PubMed] [Google Scholar]
- 33.Yi C, Tian Y. Text string detection from natural scenes by structure-based partition and grouping. IEEE Transactions on Image Processing. 2011;20(9) doi: 10.1109/TIP.2011.2126586. [DOI] [PMC free article] [PubMed] [Google Scholar]
- 34.Yi C, Tian Y. Text detection in natural scenes by stroke Gabor words. Proceedings of International Conference on Document Analysis and Recognition. 2011:177–181. doi: 10.1109/ICDAR.2011.44. [DOI] [PMC free article] [PubMed] [Google Scholar]
- 35.Zhang J, Kasturi R. Extraction of Text Objects in Video Documents: Recent Progress. The 8th IAPR Workshop on Document Analysis Systems. 2008:5–17. [Google Scholar]
- 36.Zhao M, Li S, Kwok J. Text detection in images using sparse representation with discriminative dictionaries. Image and Vision Computing. 2010;28(12):1590–1599. [Google Scholar]
- 37.Zhao X, Lin K, Fu Y, Hu Y, Liu Y, Huang T. Text From Corners: A Novel Approach to Detect Text and Caption in Videos. IEEE Transactions on Image Processing. 2011;20(3):790–799. doi: 10.1109/TIP.2010.2068553. [DOI] [PubMed] [Google Scholar]
- 38.Tesseract OCR. http://code.google.com/p/tesseract-ocr/
- 39.OCRopus. http://code.google.com/p/ocropus/
- 40.Free OCR. http://www.free-ocr.com/