

Abstract
The study of gene expression (i.e., the study of the transcriptome) in different cells and tissues allows us to understand the molecular mechanisms of their differentiation, development and functioning. In this article, we describe some studies of gene-expression profiling for the purposes of understanding developmental (age-related) changes in the brain using different technologies (e.g., DNA-Microarray) and the new and increasingly popular RNA-Seq. We focus on advancements in studies of gene expression in the human brain, which have provided data on the structure and age-related variability of the transcriptome in the brain. We present data on RNA-Seq of the transcriptome in three distinct areas of the neocortex from different ages: mature and elderly individuals. We report that most age-related transcriptional changes affect cellular signaling systems, and, as a result, the transmission of nerve impulses. In general, the results demonstrate the high potential of RNA-Seq for the study of distinctive features of gene expression among cortical areas and the changes in expression through normal and atypical development of the central nervous system.
The biological processes and molecular mechanisms underlying age-related physiological and behavioral changes are of special interest to a number of researchers in different areas of gerontology (Stuart-Hamilton, 2006). This might be at least partially related to the trajectory of demographic change occurring in most developed countries, which is due to the aging of their population. During the last century in the United States, there has been a substantial increase in the proportion of the population 65 years of age and older, from 4.1% of the population in 1900 and to 12.8% in 1995 (Malmgren, 2000) to 19% in 2009, according to the US Census (http://factfinder.census.gov). This pattern in the aging of the population might be related to the rise of age-related disorders and to cognitive and behavioral changes.
Most of the behavioral changes associated with aging are related to noticeable declines in different domains of cognitive functioning (Kluger et al., 1997). A number of studies have shown a significantly decreased ability in specific functions such as attention, conceptual organization, creativity, general intelligence, and particularly fluid intelligence (Stuart-Hamilton, 2006). Age-related language decline involving difficulties with lexical understanding and speech production also have been reported (Barresi, Nicholas, Tabor Connor, Obler, & Albert, 2000; Barresi, Obler, An, & Albert, 1999; Nicholas, Connor, Obler, & Albert, 1998; Nicholas, Obler, Albert, & Goodglass, 1985). In addition, researchers have established an association between cognitive decline and age-related morphological changes in the central nervous system (CNS), such as structural changes in the frontal lobes of the brain (Band, Ridderinkhof, & Segalowitz, 2002; Rabbitt, 1997) and axonal demyelination (Deary, Leaper, Murray, Staff, & Whalley, 2003).
A number of studies of the morphology and biochemistry of developing and aging brains have provided evidence that age-related changes in the brain unfold in a systematic way, so that both the structure and function of the brain are modified. At birth most of the brain’s cells are already formed; during early stages of development (a few years after birth) the brain is expanded intensively and extensively through the division and multiplication of glia (Dekaban & Sadowsky, 1978) and the establishment of many new connections among cells. By the age of 20–25 years, the brain has fully matured. Then, after middle adulthood, multiple aging-related changes occur in the brain; these changes are clearly detectable by the age of 50–60 years. Specifically, the weight and the volume of the brain decrease (Dekaban & Sadowsky, 1978; Skullerud, 1985); the number of neurons diminishes, and their morphology changes (Kabaso, Coskren, Henry, Hof, & Wearn, 2009; Terry, DeTeresa, & Hansen, 1987); the number of synapses decreases (Masliah, Mallory, Hansen, DeTeresa, & Terry, 1993; Peters, Sethares, & Luebke, 2008); and the synthesis of neurotransmitters and the density of their receptors lessen (Amenta, Zaccheo, & Collier, 1991; Kaiser, Schuff, Cashdollar, & Weiner, 2005; Ota et al., 2006; Wong et al., 1984). Functional outcomes of such age-related changes manifest in lower levels of neural conductivity (Miller & O’Callaghan, 2003) and a loss of brain plasticity (Burke & Barnes, 2006; Kolb & Whishaw, 1988), which are clearly associated with a decline in intellectual functioning and memory (Albert & Stafford, 1988; Bakker et al., 1999; Woodruff-Pak, 1997). From the current point of view, most of the age-related changes in the brain listed above are induced by changes in the cell’s structure, cellular homeostasis, and intercellular interactions, rather than by a diminution of the number of cells in the brain.
One of the main molecular mechanisms that control life support, development, metabolism, and the specific functioning of cells and tissues is gene expression. A complex orchestra of genes in a cell produces a set of RNA molecules that is called the transcriptome; these molecules are organized into an expression (also referred to as a coexpression) network. The transcriptome reflects the genome activity in a particular cell (or tissue) at a particular moment; the content and structure of the transcriptome are determined by the cell and tissue types under examination, as well as the stages of the cell cycle and organism development.
A number of studies have demonstrated that brain development and function depend on the precise regulation of gene expression, and that the changes in gene expression in the brain throughout the life-span correspond closely to the major stages of prenatal and neonatal development, and the maturing and aging of the brain (Colantuoni et al., 2011; Diaz, 2009; Johnson et al., 2009; Kang et al., 2011; Lambert et al., 2011; Somel et al., 2009, 2010). Thus, the rapid change of the transcriptome in the brain during the prenatal and neonatal stages of development is associated with major neurodevelopmental trajectories: genes related to neuronal differentiation, cell proliferation, and migration show the highest expression levels in the early fetal cortex, whereas genes associated with dendrite and synapse development dramatically increase their expression between the late midfetal period and late infancy (Colantuoni et al., 2011; Kang et al., 2011). Dynamic changes in gene expression are registered during brain maturation before 20–25 years; the rate of change then slows, reaching a plateau by the age of 30. After middle age (~40–45 years) multiple changes in the transcriptome occur, which are clearly detectable by the age of 60–65 years (Lu et al., 2004; Somel et al., 2009). The main trajectory of these age-related changes is seen as a global decrease in levels of gene expression, with an increase in heterogeneity of expression that is widespread throughout the transcriptome. This effect was explained as an outcome of accumulating stochastic changes in the somatic cells, such as mutations, and cellular and DNA damage (Lu et al., 2004; Somel, Khaitovich, Bahn, Paabo, & Lachmann, 2006; Somel et al., 2010). Recent studies of transcriptome structure and its temporal changes in the CNS have formed a global view of gene-expression dynamics as the program running normal human brain development throughout life (Colantuoni et al., 2011; Kang et al., 2011).
Despite insufficient knowledge about the relationship between gene expression in the brain and the realization of higher cognitive functions, a number of studies have reported that the transcriptome structure is associated with the anatomy/function structure of the CNS (Colantuoni, Purcell, Bouton, & Pevsner, 2000; Lockhart & Barlow, 2001; Molyneaux, Arlotta, Menezes, & Macklis, 2007; Roth et al., 2006; Strand et al., 2007). Research based on animal models has provided evidence that gene expression appears to correlate with performance on specific tasks and with brain activity. It has been shown that motor task performance is associated with gene expression in the cerebellum, amygdala, and hippocampus (Nadler et al., 2006) and that there is a correlation between the transcriptional profile of the parietal cortex and sleep behavior (Buechel et al., 2011). In addition, a number of studies have reported that specific patterns and interruptions in gene expression are correlated with a spectrum of neurological disorders (Mirnics & Pevsner, 2004), such as multiple sclerosis (Kinter, Zeis, & Schaeren-Wiemers, 2008), Huntington (Botovecki et al., 2005), Alzheimer (McShea et al., 2006), and Parkinson diseases (Miller & Federoff, 2006), as well as being associated with mental illnesses, such as schizophrenia and bipolar disorder (Moreau, Bruse, David-Rus, Buyske, & Brzustowicz, 2011; Mudge et al., 2008), and suicidal behaviors of patients with mood disorders (Sequeira et al., 2012).
Thus, the accumulation of data on the specificity of transcriptional changes in distinct structural and functional regions of the brain in different developmental stages may be a valuable source of information on the transcriptional foundation of normal development and the functioning of the CNS, as well as insight into the molecular mechanisms of pathological neurodevelopment and cognitive disorders. The results of such studies show the potential for applications in diagnostics for neurological disorders, as was discussed in Scherzer’s (2009) review.
The current knowledge of the transcriptome structure in the human brain is based on studies that used microarray techniques for gene-expression profiling, measuring genes’ activity at the expression level. Today’s technology allows the detection of a whole genome expression profile based on measurements of the expression levels of a large but predefined (i.e., “blind” to anything but what is included in the array) set of well-annotated genes dispersed across a genome. Among other drawbacks (Irizarry et al., 2005; Kawasaki, 2006), this predefinition is a serious limitation of the use of microarray technologies for the analysis of gene expression in the brain, which is characterized by a high level of gene expression and transcriptome complexity in comparison with other tissues. Thus, a number of studies have reported that at least 30%–50% of ~25,000 known protein coding genes (International Human Genome Sequencing Consortium, 2004) are expressed in the brain (Colantuoni et al., 2000; Myers et al., 2007); the transcriptome in the brain is especially enriched in regulatory elements (Amaral, Clark, Gascoigne, Dinger, & Mattick, 2011; Chodroff et al., 2010; Kuss & Chen, 2008; Landgraf et al., 2007; Ponjavic, Oliver, Lunter, & Ponting, 2009; St. Laurent, Faghihi, & Wahlestedt, 2009) and alternative splicing events (de la Grange, Gratadou, Delord, Duterre, & Auboeurf, 2010; Mortazavi, Williams, McCue, Schaeffer, & Wold, 2008; Ramskold et al., 2009; Wang et al., 2008).
During the last several years the development of high-throughput sequencing technologies, such as RNA-Seq, has allowed the so-called direct sequencing of the transcriptome: the detection of a whole genome expression profile without the limitation of using a predefined set of target genes. Moreover, RNA-Seq allows the measurement of expression levels with high accuracy, and the simultaneous detection of genes that have a wide (very high and very low) range of expression levels (‘t Hoen et al., 2008; Asmann et al., 2009; Marioni, Mason, Mane, Stephens, & Gilad, 2008; Wang, Gerstein, & Snyder, 2009). At present, RNA-Seq is considered the most promising technique for transcriptome analysis in the CNS (van der Brug, Nalls, & Cookson, 2010).
Here we report the results of high-throughput sequencing of the transcriptome in three cortical areas involved in the regulation of distinct higher cognitive functions (intellectual functions and actions, speech production, and speech processing and comprehending) from two postmortem female brains from individuals 70 and 40 years of age. Investigating the differential patterns of gene expression in brain tissues from adult and senescent individuals, we are able to examine both the main trend of age-related changes in the neocortex and the consistency of these changes across distinct cortical sites that control different higher cognitive functions. We consider the main findings from standpoint of the current knowledge of the age-related dynamics of gene expression in the CNS. If continued and extended, this research will contribute to a better understanding of the relationships between higher cognitive functions and the transcriptional status of the CNS and their dynamic changes throughout the life span.
Materials and Methods
Specimen ascertainment
Specimens were collected from two healthy, right-handed females who were 70 and 40 years of age (marked in the current publication as Brain 70 and Brain 40, respectively), who died of sudden death, unaccompanied by premortem hypoxia or prolonged agony, both of which have been linked to significant RNA degradation (Barton, Pearson, Najlerahim, & Harrison, 1993; Harrison et al., 1995; Mexal et al., 2006). The brain tissue samples were provided by the Department of Forensic Medicine of the Medical Academy for Continuous Education (Moscow, Russia); all proper consenting and permission procedures were implemented.
Autopsies of the brains were made within a postmortem interval of no more than 24 hr to avoid RNA degradation and the selective reduction in the mRNA at postmortem intervals of 48 hr or more (Catts et al., 2005). The gray matter of three distinct functional cortical areas was dissected from the left hemisphere; in typical individuals, these areas are thought to be involved in the regulation of cognitive functions such as memory, thinking, and executive skills (association cortex, Broca area [BA] 46), speech and language understanding (Wernicke area, BA 22), and speech production (BA 45). We collected all layers of the neocortex from each area to minimize the imbalances in cell composition between samples (Colantuoni et al., 2000; Molyneaux et al., 2007; van der Brug et al., 2010). The dissections were collected into RNAlater stabilization reagent as per the manufacturer’s instructions (Qiagen). During sample shipment, the tissue was kept in RNAlater for a week, then was transferred from the stabilization reagent and stored at −80°C.
Sample preparation and sequencing
Total RNA was extracted from the brain tissue using the RNeasy Plus Mini Kit according to the manufacturer’s instructions (Qiagen); the RNA quality was assessed using Agilent Technologies 2100 Bioanalyzer (RNA integrity number, range = 8.1–9.0). Poly-A mRNA was isolated from 10 μg of total RNA with Dyna1 oligo-dT beads (Invitrogen) and randomly fragmented using RNA fragmentation reagents (Ambion). First-strand complementary DNA (cDNA) synthesis was performed using SuperScriptII reverse transcriptase and random primers (Invitrogen); second-strand cDNA was synthesized using DNA PolI and RNase H (Invitrogen).
The sequencing libraries were prepared according to the paired-end sample preparation protocol (http://www.illumina.com) with slight modifications. The Illumina PE adapters were ligated using End Repair Kit (Epicentre), Klenow fragment (NEB), and LigaFast (Promega). The size selection of the final product was performed by SizeSelect E-Gel (Invitrogen). The templates were enriched by polymerase chain reaction using Phusion DNA Polymerase (NEB). Quality control analysis on the cDNA libraries was performed by Bio-analyzer; the median size of the cDNA library was around 300 nucleotides.
The libraries were sequenced using Illumina high-throughput technology as 75-mers from both ends of the cDNA templates (paired-end sequencing). The sequencing by synthesis was performed at the Yale Center for Genomic Analysis (http://medicine.yale.edu/keck/ycga), using TruSeq PE Clustering kit, TruSeq SBS v2, and Hi-Seq 2000 (Illumina). Six different cDNA samples and one technical replicate were run in seven lanes of the same flow cell.
RNA-Seq reads mapping and annotation
Sequencing reads were processed and aligned to the UCSC Homo sapiens reference genome (hg19) using TopHat (Trapnell, Pachter, & Salzberg, 2009), which uses Bowtie (Langmead, Trapnell, Pop, & Salzberg, 2009). An example of the data alignment is presented in online-only Figure S.1. To estimate transcript abundance levels, the normalized measures were obtained using Cufflinks (Trapnell et al., 2010). The transcript abundances were measured in fragments per kilo-base of exon per million mapped fragments (FPKM). The alignment and processing of the sequencing outputs were performed at the Yale University Biomedical High Performance Computing Center (http://info.med.yale.edu/hpc/).
Detection and functional annotation of differentially expressed genes (DEGs)
Pairwise comparative analysis to detect DEGs across the cortical samples was carried out using differential expression analysis (DESeq) for sequence count data. This is an R package that uses a negative binomial model to estimate the distribution of the raw counts within each transcript and to perform tests for DEGs (Anders & Huber, 2010). The genes showed significant differences in the number of mapped reads at p ≤ .05 and, after adjusting for multiple comparisons, were considered to be differentially expressed.
To identify common biological processes and pathways, molecular functions, and cellular components, as defined by gene ontology (GO) criteria for DEGs, the Database for Annotation, Visualization and Integrated Discovery (DA-VID) was used (http://david.abcc.ncifcrf.gov; Huang, Sherman, & Lempicki, 2009). For this analysis, the “high stringency” setting of the functional analysis tool was used, which compares the enrichment of GO terms in our list of DEGs using a Fisher exact test. The clusters generated by DAVID, with an enrichment score of >1.3 corresponding to p < .05, were considered reliable. The p values of the DA-VID tool and the Benjamini corrections of the scores from the tool as inclusion criteria were used in the trimming of the clusters to an overrepresented term list.
Gene network construction
Coexpression networks for genes differentially expressed between individuals were constructed using a freely accessible WebQTL resource (http://www.genenetwork.org) that combines genetic and phenotypic databases with data analysis tools (Wang, Williams, & Manly, 2003). Specifically, the HBTRC-MLC Human Prefrontal Cortex Agilent Normal database, containing data on the mean expression levels of approximately 37,000 genes in the prefrontal cortex across 170 individual expression profiles, was used to construct a gene network (http://www.genenetwork.org). A Pearson correlation matrix, containing estimates of pairwise correlations between gene-expression levels, was calculated and then transformed into a matrix of connection strengths, which permitted the construction of a coexpression network for each data set in this study.
Results
Analysis of RNA-Seq data
High-throughput paired-ended sequencing using Illumina technology was performed to generate gene-expression profiles of three cortical areas from two individual postmortem brains. Altogether seven samples (six cDNA libraries and one technical replicate) were sequenced in different lanes of the same Illumina Hi-Seq flowcell as 75-mer reads. The number of clusters of identical cDNA fragments generated during the amplification step of sequencing ranged from 133.5 to 186.8 million per lane. Between 100.9 million and 126.7 million (~75%) of these clusters passed quality filtering by Illumina (Table 1). The total number of reads produced for each sample ranged from approximately 73.5 million to 86.0 million; the yields in read count per lane were comparable. Of these reads, 73.5 million to 86.3 million (~70%) were mapped to the reference genome and exon junctions were annotated. The mapping statistics are comparable to those in published studies (Liu, Lin, Jiang, Wang, & Xing, 2011; Marioni et al., 2008; Wang et al., 2008).
Table 1.
Sequencing output, RNA-Seq reads mapping to Human genome build 19, and statistics on the distribution of gene expression measurements across seven studied brain samples corresponding to the three cortical areas from two individuals, including the technical replicate
| Brain 70
|
Brain 40
|
Mean | ||||||
|---|---|---|---|---|---|---|---|---|
| Broca Area | Broca Areaa | Wernicke Area | Association Cortex | Broca Area | Wernicke Area | Association Cortex | ||
| Sequencing Output and RNA-Seq Reads Mapping | ||||||||
|
| ||||||||
| Lane yield (Mbases) | 17,728 | 17,710 | 17,710 | 16,876 | 18,400 | 15,336 | 19,258 | 17,574 |
| Raw clusters | 144.5M | 144.9M | 144.7M | 133.5M | 172.0M | 186.8M | 174.5M | 157.3M |
| Clusters passed filtering (%) | 116.3M (81.0) | 116.5M (80.7) | 116.5M (80.9) | 111.0M (83.5) | 121.1M (70.1) | 100.9M (54.3) | 126.7M (72.8) | 115.6M (74.8) |
| Mapped reads (%)b | 83.8M (71.6) | 83.7M (71.5) | 86.3M (73.8) | 84.4M (76) | 81.4M (67.3) | 73.5M (72.8) | 86.0M (67.7) | 82.7 (71.5) |
| Number of annotated genes/transcript (%)c | 13,584 (90) | 13,585 (90) | 13,777 (91.4) | 13,774 (91.4) | 14,050 (93.2) | 14,181 (94.1) | 14,227 (94.4) | 13,882.5 (91.1) |
|
| ||||||||
| FPKM Statistics on Distribution of Gene Expression Measurements | ||||||||
|
| ||||||||
| Maximum | 21531.30 | 21598.90 | 20984.70 | 19053.50 | 12926.30 | 9556.31 | 9211.85 | |
| Median | 0.6058 | 0.6126 | 0.6487 | 0.6475 | 1.0931 | 1.3085 | 1.0206 | |
| Standard deviation | 187.65 | 188.16 | 184.77 | 165.63 | 119.14 | 89.65 | 83.54 | |
Note: FPKM, fragments per kilobase of exon per million mapped fragments.
Technical replicate.
Estimated as the percentage of the total number of reads.
Estimated as the percentage of 15,096 genes that have shown expression (FPKM = 0.001 and more) in at least one of the seven samples.
The comparison of technical replicates demonstrated good reproducibility of the RNA-Seq output (Table 1; Figure 1). The correlation coefficient of log2FPKM between replicates was extremely high (.99), and there were no statistically significant (p < .01) differences found in read counts between the two technical replicates.
Figure 1.

Pairwise plots of transcript abundance levels (log2 of fragments per kilobase of exon per million mapped fragments) between seven sequenced complementary DNA samples including technical replicates. Each subplot shows the comparison of samples i versus j, each coordinate corresponds to a sample, and each dot corresponds to a gene/transcript. (a, b) Subplots represent the results of intraindividual comparisons between three cortical areas: Broca, Wernicke, and the association cortex. (c, d) Subplots represent interindividual comparisons of transcript abundance levels in the cortical areas.
The numberof RNA-Seq reads mapped per gene varied from 0 to tens of thousands (online-only supplemental Table S.1), which corresponds to the variation of expression levels among genes from 0 to 21,598 FPKM (Table 1). The median of the distribution of gene-expression levels varied among seven sequenced samples from 0.6058 to 1.3085 FKPM, indicating the dominance of low-expressed genes among the genes detected (Table 1 and Figure 2). Genes that showed FPKM ≥ 0.001 (corresponding to 1 or more fragments per 10 kb of transcript per 100 million mapped reads) in at least one sample were considered expressed. According to these criteria, 15,096 expressed genes were detected in the analyzed cortical areas (Table 1), which represents approximately 68% of the total number of genes (of ~22,000) contained in the Gencode (Harrow et al., 2006; http://www.gencodegenes.org).
Figure 2.

The distribution of expression levels (log2 fragments per kilobase of exon per million mapped fragments [FPKM]) of genes detected in Broca area of Brain 70 (the upper diagram) and the same area in Brain 40 (the lower diagram). Genes with FPKM of 0 are excluded. This plot shows that there are few genes that have an FPKM between 0 and 0.001; the latter corresponds to approximately −10 on the logarithmic scale. The threshold of 0.001 was used as a minimum FPKM for determining expressed genes.
Comparative analysis of gene-expression profiles across six cortical samples
To identify the interarea and interindividual variability of gene expression, we performed pairwise comparisons of the expression profiles among three cortical areas across the two brains (Figure 1). The distributions indicate the prevalence of differences in the expression levels among low expressed genes. All plots representing the interindividual pairwise comparisons demonstrate more dispersed distributions compared to intraindividual comparisons. This indicates that more of the genes characterized by wide ranges of expression levels show more differential expression in inter- than intraindividual comparisons. Hierarchical clustering of the six samples, based on correlations between their gene-expression profiles, confirms this finding: the cortical areas from an individual brain cluster together in a single branch of the dendrogram, and the clusters for the two individuals are far removed from each other (Figure 3). Overall, these results indicate that the interindividual differences in gene expression are significantly greater than the intraindividual area differences in these samples.
Figure 3.

Hierarchical clustering of cortical areas from the two individual brains on the basis of the correlations of their gene-expression profiles. The cortical areas are shown in the table as Broca area (Br), Wernicke area (Wr), and association cortex (Ac); the numbers 40 and 70 correspond to the two individuals. The dendrogram shows the significant predominance of interindividual differences in gene expression in the brain over differences between cortical areas within each individual’s brain tissue.
Statistical analyses of gene-expression variations among the cortical areas and individuals listed in Table 1 indicate consistent differences in gene expression between these individuals across all three cortical areas. The variation of gene expression in all cortical areas of the older individual is characterized by lower medians (0.6058–0.6487) and higher standard deviations (185.63–188.16) than those found in the brain tissue from the individual 40 years of age (1.0206–1.3085 and 83.54–119.14, for the medians and standard deviations, respectively). This suggests lower expression levels but higher heterogeneity of gene expression in the brain of the older individual.
DEGs analysis
The analysis of DEGs between cortical areas within each individual showed negligible intraindividual difference between the gene-expression profiles: no genes showed statistically significant (p ≤ .05) differences in their expression levels. Despite the lack of statistical significance in the differential expression analysis, a set of transcripts (584 of 25,165 detected in the brain tissue) showed a concordance in their abundance levels in the studied areas of both individuals. In both individual brains, these genes showed 1.5-fold and more differences in expression levels in one particular cortical area compared to the others (online-only supplemental Table S.2). As an example, the top list of these genes, which have shown a higher dispersion of expression levels among cortical areas, is represented in Table 2. This observation indicates the potential of finding area specificity in gene expression, or an association between gene expression in distinct areas of the neocortex and the different functions they control in studies involving more cortical areas and more individual tissue samples to increase the power of analysis.
Table 2.
The top list of genes showing distinctively lower (italic) or higher (bold) expression levels (fragments per kilobase of exon per million mapped fragments) in particular cortical areas in both intraindividual comparisons
| Gene/Transcript | Brain 70
|
Brain 40
|
||||
|---|---|---|---|---|---|---|
| Broca Area | Wernicke Area | Association Cortex | Broca Area | Wernicke Area | Association Cortex | |
| U3 | 29.8312 | 15.2799 | 13.5087 | 402.1200 | 43.1671 | 114.3660 |
| SNORD116 | 5.4706 | 0.0000 | 0.0000 | 31.1409 | 8.9083 | 14.6001 |
| EIF2B3 | 11.0827 | 3.7824 | 2.9271 | 21.1086 | 8.1721 | 7.1882 |
| SNORD115-26 | 2.9211 | 4.7628 | 5.6121 | 9.5445 | 24.0644 | 15.8628 |
| PIBF1 | 3.1654 | 13.6797 | 12.7923 | 2.8265 | 6.9963 | 11.2787 |
| TYW1 | 8.3413 | 13.7097 | 13.6965 | 3.9672 | 12.7941 | 12.0692 |
| AC016734.2 | 0.0000 | 12.3671 | 2.0430 | 8.2757 | 20.9496 | 14.6457 |
| ALDH3A2 | 2.5966 | 10.7707 | 4.6670 | 5.6800 | 14.5657 | 4.9913 |
| SLC25A40 | 0.7391 | 5.5738 | 0.4404 | 4.7439 | 9.7441 | 4.3427 |
| AC111196.1 | 34.3345 | 19.9724 | 31.6557 | 0.8757 | 0.0229 | 1.5789 |
| RP4-682C21.1 | 5.1772 | 2.6153 | 4.5468 | 7.9338 | 3.3396 | 6.8598 |
| AC003101.2 | 8.7180 | 4.5096 | 19.0410 | 0.0000 | 0.0000 | 4.3712 |
| AC062037.2 | 0.0000 | 0.0000 | 11.1884 | 0.0000 | 0.0000 | 9.7433 |
| AC007722.4 | 0.0000 | 0.0000 | 8.3565 | 0.0000 | 0.0000 | 9.2572 |
| CTD-3035D6.1 | 21.4627 | 18.1370 | 12.0474 | 47.6862 | 41.1740 | 18.9721 |
| RNF13 | 8.9870 | 11.8445 | 4.4631 | 23.3326 | 30.1282 | 15.1839 |
| AC009299.1 | 7.3657 | 9.6999 | 4.4389 | 16.8234 | 17.7581 | 10.4884 |
In contrast to the previous comparison, we identified significant interindividual differences in gene expression within each cortical area. Of 15,096 expressed genes, 491 (~3%) demonstrated differential expression between individual brain samples at p ≤ .05 (see online-only supplemental Table S.3 for the list of DEGs). Of these 491 genes, 177 were differentially expressed in at least two cortical areas (Figure 4). The number of DEGs between individuals varied in different cortical areas: only 15 DEGs were identified in the association cortex, whereas 274 and 391 DEGs were detected in the BA and Wernicke area, respectively (Figure 4). Of 491 DEGs, 133 genes (~27%) had significantly higher expression levels and 358 genes (~73%) significantly lower expression levels in the brain tissue from the older individual compared to those from the younger (online-only supplemental Table S.3). Again, this finding indicates the likelihood of a lower level of gene expression in the brain of the older individual.
Figure 4.
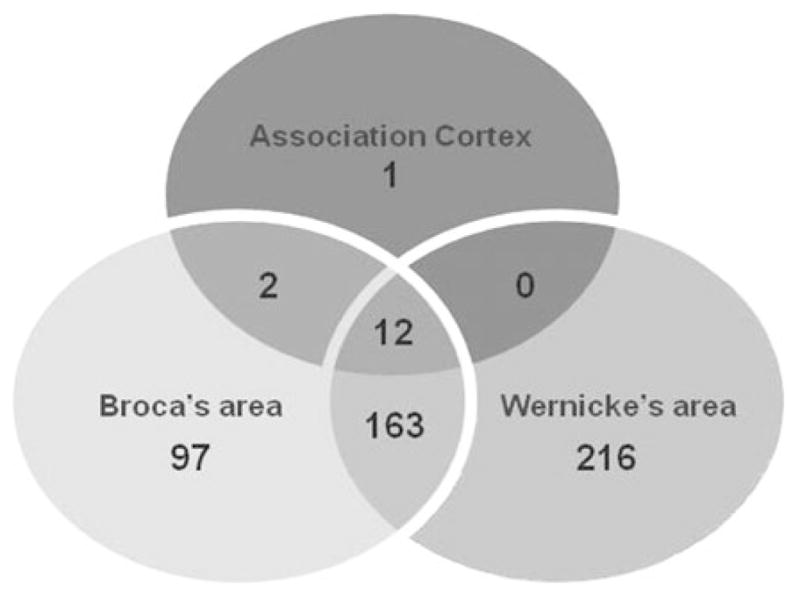
A comparison among three cortical regions, in which 491 genes are detected as significantly (p ≤ .05) differentially expressed between two individual brains within the same areas: Broca, Wernicke, and the association cortex, respectively. Digits in circles represent both the number of differentially expressed genes detected in a particular cortical area and the number of overlapping genes across the areas.
Functional annotation of the DEGs
To identify the specificity of gene-expression differences found between individuals, we investigated the functional relationships between genes, which showed significant interindividual differences in their expression levels across all studied cortical areas. The set of 491 DEGs included 419 genes with known functions, 414 of which were annotated to different functional clusters using DAVID annotation tools (online-only supplemental Table S.4). Table 3 lists the GO terms that are significantly overrepresented among the genes differentially expressed between individual brain tissues. The analysis of the GO annotation suggests that these DEGs are especially enriched in genes involved in the regulation of the transmission of nerve impulses, nervous system development, and neurogenesis.
Table 3.
Summary of functional annotation of 491 genes differentially expressed between individual brains within the same cortical area
| GO Term | Gene Count | Gene (%) | p | Fold Enrichment | Benjamini | Age-Related Change |
|---|---|---|---|---|---|---|
| GO:0051969 for regulation of transmission of nerve impulse | 22 | 5.31 | 8.68E-12 | 6.79 | 1.83E-08 | ↓ |
| GO:0044057 for regulation of system process | 27 | 6.52 | 4.51E-09 | 3.97 | 1.19E-06 | ↓ |
| GO:0006811 for ion transport | 38 | 9.18 | 5.49E-06 | 2.25 | 6.81E-04 | ↓ |
| GO:0008021 for synaptic vesicle | 10 | 2.42 | 9.06E-05 | 5.39 | 2.41E-03 | ↓ |
| GO:0031224 intrinsic to membrane | 168 | 40.58 | 6.93E-05 | 1.25 | 2.01E-03 | ↓ |
| GO:0034702 ion channel complex | 16 | 3.86 | 1.48E-04 | 3.20 | 3.64E-03 | ↓ |
| GO:0048666 for neuron development | 22 | 5.3140 | 1.93E-05 | 2.95 | 1.41E-03 | ↓ |
| GO:0007632 visual behavior | 7 | 1.69 | 4.93E-05 | 10.25 | 2.81E-03 | ↓ |
| GO:0007612 for learning | 8 | 1.93 | 3.27E-04 | 6.05 | 1.20E-02 | ↓ |
| GO:0001653 for peptide receptor activity | 11 | 2.66 | 2.14E-04 | 4.35 | 2.29E-02 | ↓ |
| GO:0055082 for cellular chemical homeostasis | 27 | 6.52 | 2.94E-07 | 3.23 | 6.20E-05 | ↓↑ |
| GO:0051960 for regulation of nervous system development | 16 | 3.86 | 2.20E-05 | 3.78 | 1.50E-03 | ↓ uarr; |
| UP_SEQ_FEATURE for metal ion-binding site: divalent metal cation | 4 | 0.96 | 4.94E-04 | 64.95 | 5.5E-03 | ↑ |
Note: The p values of the DAVID tool and the Benjamini corrections of the scores from the tool were used as inclusion criteria to trim the overrepresented term lists. Fold enrichment in each gene group compared to the base set of genes in the DAVID databases (19,235 genes). The trend of age-related change in the expression of genes belonging to a particular functional group is shown as ↑ and ↓, reflecting an increase and decrease of the expression levels, respectively. GO, gene ontology.
Functional annotation of genes downregulated and upregulated in the aged neocortex
To identify the direction of age-related changes in gene expression for the different functional groups of genes we performed separate functional annotations of genes that were found to be downregulated or upregulated in the brain tissue from the older individual. The lists of GO terms for genes that decreased and increased their expression in the aged neocortex are presented in online-only supplemental Table S.5 and Table S.6, respectively. Genes involved in the control of neuron development, the transmission of nerve impulse, including such functional groups as synaptic vesicles, ion transport, and channel complexes, are overrepresented in the list of 358 genes that showed significantly decreased levels of expression in the brain tissue from the individual 70 years of age (Table 3; online-only supplemental Table S.5). In addition, a number of genes known to be involved in the regulation of such higher cognitive functions as visual behavior and learning also showed decreased expression levels in the neocortex of the elderly individual.
The list of 133 genes significantly increased expression, or upregulated, in the brain tissue from the older individual is especially rich in protein-coding genes that are involved in divalent metal cation binding (Table 3; online-only supplemental Table S.6). This group is represented by four genes from the metallothionein superfamily: MT1E, MT1G, MT1F, and MT2A.
Two of the functional groups overrepresented in the list of DEGs (cellular chemical homeostasis and regulation of nervous system development) contain genes that have shown expressional changes in the brain tissue from the 70-year-old individual in both increased and decreased expression levels (Table 3). It is notable that the coexpression networks reconstructed for genes belonging to these two functional groups indicate high positive correlations within each of the sets of up- and downregulated genes, respectively, and high negative correlations between those subgroups of genes (Figure 5a, b). Moreover up- and downregulated genes have different functions in the regulation of cellular homeostasis and nervous system development. Thus, five of six genes (GLI2, HES1, ID4, PAX6, and SOX2) involved in the regulation of nervous system development and upregulated in the neocortex of the older individual, are factors of transcription regulation (Figure 5a). The genes involved in signal transduction pathway regulation (YWHAG and YWHAH), neuron regeneration and axonal myelinization (AMIGO1 and CD24), and genes coding receptors (KIT, GRIN1, CHRNB2) prevailed among genes belonging to the same functional group, but showing a decrease in the expression in the aged neocortex (Figure 5a).
Figure 5.


Coexpression networks of genes involved in (a) the regulation of nervous system development and (b) cellular chemical homeostasis that have shown differential expression in the neocortex from the individual 70 years of age compared to that in the brain tissue from the individual 40 years of age. The network is constructed based on Pearson correlation coefficients between expression levels of these genes in the human neocortex (http://www.genenetwork.org). Interactions for an absolute correlation above .50 are shown; the correlation coefficients are represented. The positive correlations are shown as bold (r > .7) and normal (.5 < r < .7) lines; the negative correlations are shown as dashed lines. The nodes with symbols of genes upregulated in the brain tissue from the older individual are marked by a dark gray circle.
Similar to the previous finding within the functional group “cellular chemical homeostasis,” the list of genes that have shown significantly decreased expression in the older neo-cortex is especially populated by genes controlling the cellular signaling system, such as genes encoding for receptors (e.g., GPR21, CHRNB2, GRIN1, GPR6, MCH1R/SLC1, AVPR1A, and DRD1), signal transducers and neurotransmitters (e.g., GNG3, CD24, and TAC1; Figure 5b). Among the genes significantly downregulated, or showing decreased expression in the aged neocortex, there were genes involved in the electroneutral exchange of sodium and potassium ions, and potassium-chloride cotransport in mature neurons (SLC9A6 and SLC12A5). In contrast, a number of genes involved in bivalent ion (mainly Ca2+ cations) transport and homeostasis, and, as a result, the activation of signaling cascades, showed significantly increased expression in the aged cortex, such as FXYD1, GRIN2C, LPAR3, and NTSR2. Specifically, the FXYD domain containing ion transport regulator 1 (FXYD1) involved in chloride transport and calcium ion homeostasis; glutamate-activated NMDA-receptor (GRIN2C) triggers an influx of Ca2+ into the postsynapse; LPAR3 involved in releasing of calcium from the endoplasmatic reticulum; and neutrotensin receptor 2 (NTSPR2) indirectly activates a calcium second messenger system.
Taken together, these findings indicate that the main interindividual difference in gene expression in the neocortexes corresponds to the significant variability in activity of genes involved in the control of the cellular signaling system. This difference is specifically related to a decrease in the expression of genes coding receptors, signal transducers and neurotransmitters, as well as to significant changes in the expression of an orchestra of genes controlling ion channels, ion transport, and homeostasis in the neocortex from the aged brain.
Discussion
To investigate age-related changes in gene expression in the neocortex as whole and in its different functional areas, we performed RNA-Seq on the transcriptome in the prefrontal association cortex, which is involved in the regulation of a number of higher cognitive functions such as memory, thinking, and executive skills, and the two cortical areas controlling speech and language (BA and Wernicke area) of two postmortem female brains. The preliminary experiment involved brain tissue from two individuals of different ages (40 and 70 years of age), representing different adult development stages. Thus, at the middle adult stage (40 years of age) the brain has matured and transcriptional status is relatively stable (Lu et al., 2004; Somel et al., 2009); at the late adult stage (70 years of age), the changes in the morphophysiology (Dekaban & Sadowsky, 1978; Kabaso et al., 2009; Masliah et al., 1993; Terry et al., 1987) and transcriptional status (Lu et al., 2004; Somel et al., 2009) of the brain related to normal aging are clearly detectable.
In our comparative study of the transcriptome we focused on the identification of differential expression patterns across distinct cortical regions and differently aged individuals, as well as on the analyses of sets of DEGs in terms of the functions and metabolic pathways those genes control. The main goal of the study, which must be considered preliminary due to the small number of subjects, was to trace the general directions of the comparative relationships between gene expression in the neocortex and higher cognitive functions and the concordance of their age-related dynamics.
The gene-expression profiling of the transcriptome in the neocortex based on RNA-Seq data has shown that at least 68% of known genes (~22,000 genes contained in the Gencode DB) are expressed in the brain. This finding is consistent with reported evidence on the high expression levels in the brain tissue in terms of number of expressed genes as 30%–50% of the genes contained in the human genome (Colantuoni et al., 2000; Myers et al., 2007). The statistical analysis of the distribution of gene-expression measurements (Table 1) showed the consistency in the expression level and the variability among all of the studied cortical regions within an individual brain.
Spatial variability of the gene expression in the neocortex (i.e., the differences between cortical areas within an individual brain) was found to be very low and not detectable at a high level of confidence. Thus, pairwise comparisons of the expression profiles among three cortical areas across the two individual brains showed negligible differences between the gene-expression profiles of distinct cortical areas within an individual brain: no genes showed statistically significant differences in their expression levels. This might be due to both the high similarity in expression profiles across distinct areas of the cerebral cortex and the presence of main gene-expression differences across cortical regions among less expressed genes, for which differences might be detectable and perhaps meaningful, but not significant statistically. The first interpretation is consistent with other studies showing low variability in gene expression among different sites of the cerebral cortex (Khaitovich et al., 2004; Roth et al., 2006). The second interpretation is consistent with the data presented in the previous section on the dominance of low-expressed genes in the transcriptome of the studied cortical tissues. All together these facts and the low power of the statistical apparatus for the reliable detection of differential expression of low-expressed genes constitute serious limitations in comparative studies of transcriptomes from tissues for which a priori low differences in gene expression are expected.
To determine the potential of identifying area specificity in gene expression we compared gene-expression variability between different cortical areas within each individual and across both individuals. This analysis showed that within each individual brain there are sets of genes that distinguish cortical areas from each other. The differences in the expression levels of these genes among cortical regions are not statistically significant but they are consistent across two individual comparisons (Table 2). Overall, these results of the comparative study of gene-expression variation among distinct cortical areas indicate the potential of finding region specificity in gene expression with increased power of analysis, including increased sample size or the involvement in the analysis of more cortical areas and more individual tissue samples.
The pairwise comparisons of global expression profiles using hierarchical cluster analyses of expression patterns across cortical areas and individuals showed that interindividual differences in gene expression are significantly greater than intraindividual differences between cortical areas. At the whole-genome level of expression, this difference is especially clear in the variation of gene-expression levels within each expression profile. Thus, all three cortical areas of the older individual brain were characterized by lower median and higher standard deviations of gene-expression levels compared to those estimated for the cortical areas of the younger individual brain. This indicates a decrease in global gene expression and an increase in the heterogeneity of expression in the aging neocortex. These trajectories of age-related changes in gene expression have been previously reported and have been explained as a possible outcome of accumulating stochastic changes in somatic cells, such as mutations, and cellular and DNA damage, especially in gene promoters (Lu et al., 2004; Somel et al., 2006, 2010). A systematic decrease in gene expression in the CNS has been reported as a transcriptional event associated with different mental disorders. Thus, significant down-regulation of genes coding microRNA has been found in the brain tissue of the patients with schizophrenia and bipolar disorder (Moreau et al., 2011).
The analysis of differential expression patterns in distinct cortical areas between individual brains has shown that several hundred genes have significant interindividual difference in the expression level. Moreover, the variation in the expression differences makes the association cortex especially distant from the other two cortical areas. Thus, the number of DEGs found in this area is an order of magnitude lower than those found in Broca and Wernicke areas (15 DEGs vs. 275 and 391 DEGs, respectively). If confirmed by studying an extended sample of individuals, this finding might indicate the specificity and difference in the rate of age-related change in the transcriptome in different cortical sites of the brain, especially taking into account that heterogeneity has been reported in age-related morphological and molecular changes among different cortical regions (Hof & Morrison, 2004; Raz, Rodrigue, Head, Kennedy, & Acker, 2004).
According to the functional annotation clustering of DEGs between individuals, the most crucial age-related changes in gene expression occur in metabolic pathways involved in the regulation of the transmission of nerve impulses, nervous system development, and neurogenesis. Once again, this finding is consistent with previously published data suggesting an age-related decrease in the expression of genes related to neurodevelopmental processes and signaling pathways (Somel et al., 2009; Von Bernhardi, Tichauer, & Eugenin, 2010). We identified, as differentially expressed in the two brains, genes encoding for a number of receptors involved in the transmission of nerve impulses, among them dopamine receptor D1 (DRD1), glutamate receptor IN 1 (GRIN1), cholinergic receptor NB2 (CHRNB2), arginine vasopressin receptor 1A (AV-PR1A), and a number of G protein-coupled receptors (such as GPR6, GPR21, and MCH1R), which play a key role in the plasticity of synapses and are believed to underlie memory and learning. Iterations in cellular signaling systems are known as a possible mechanism underlying atypical development. Thus, a study on the genomic etiology of autism spectrum disorder (ASD), based on the interaction networks of the genes implicated in ASD and expressed in the developing brain, has shown that the classical cytokine signaling system is a central pathway involved in ASD (Ziats & Rennert, 2011).
Other changes in gene expression found in the aging neo-cortex are related to the cellular ionic homeostasis and trans-membrane transport of ions. Thus, genes belonging to solute carrier families 9 and 12 (SLC9A6 and SLC12A5), which are involved in electrolytic exchange of sodium-potassium protons and potassium-chloride cotransport, respectively, were significantly downregulated in the neocortex tissue from the older individual brain. It has been reported that mutations in those genes, and insufficient quantities of their products, are associated with such outcomes as mental retardation, microcephaly, and cortical dysplasia, and might result in intellectual disability (see, e.g., Gilfillan et al., 2008; Munakata et al., 2007).
It is notable that one of the main ideas our findings suggest is that there are age-related gene-expression changes in the neocortex, mostly affecting the cellular signaling system than neuron morphogenesis. This observation is consistent with animal aging studies that reported, in the neocortex compared to the hippocampus, a predominance of downregulation of cell signaling pathways over downregulation of processes related to neurons in the neocortex compared to the hippocampus from the aging brain (Buechel et al., 2011). Altogether, these data may indicate the variability in age-related transcriptional changes across different structures of the brain, and, as a result, the variability in the risk of distinct functional declines related to normal aging process and pathological development of the CNS.
At the same time, a set of genes involved in the control of cellular ionic homeostasis significantly increase their expression in the neocortex from the 70-year-old individual compared to the middle-aged individual. Dominant among them are genes involved in the Ca2+ region: the release of Ca2+ from the endoplasmatic reticulum (LPAR3), its transport by means of the activation of the calcium second messenger system (NTSPR2), and its influx into the postsynaptic area through glutamate-operated receptor/channels, such as NMDA receptors (GRIN2C). The literature describing the aging-related changes in the calcium signaling system in neurons provides evidence that even the same types of Ca2+ channels appear to respond differently to aging. Thus, there was reported a decrease in the effectiveness of NMDA glutamate-operated receptors (Magnusson, 1998) in contrast to other, AMPA, glutamate-operated receptors, which did not show any aging-related change in their activity (Toescu, 2007). Differential response to aging has been shown for the low and the high voltage-activated Ca2+ channels in terms of their density and activation/inactivation (Toescu, 2007). In general, our preliminary results allow the assumption that some important players involved in the calcium signaling system can be significantly upregulated at the expression level in the aging neocortex. In view of the general decrease in gene expression with aging, the increase in the expressional activity of some players involved in calcium homeostasis might be a compensatory mechanism for maintaining the active state of the calcium cascade, which is crucially associated with neuronal activation and nerve impulse transmission.
Several functional groups of genes that have shown a significant increase of their expression in the aging neocortex might be considered a confirmation of the possible activation of compensatory mechanisms at the transcriptional level responding to age-related changes. Among them, genes coding metallothionein (MT1E, MT1G, MT1F, and MT2A) and factors of the transcription regulation (GLI2, HES1, ID4, PAX6, and SOX2) were especially overrepresented in the list of genes upregulated in the aging cortex. Metallothionein is a stress-sensitive protein: its main function is the binding of various heavy metals related to the removal of free radicals. As a result, an increase in metallothionein abundance is associated with a number of biological consequences, specifically those associated with such positive outcomes as a decrease in apoptosis, oxidative damages, and neurodegeneration, and an increase in neuroprotection, cell growth, and regeneration (Swindell, 2011). It was recently reported that a decrease in the expression level of metallothionein genes, together with alterations in serotonergic and glucocorticoid signaling systems in the cortex, is associated with suicidal behaviors of patients with mood disorder (Sequeira et al., 2012). Although the role of metallothionein in the aging process has not been specifically investigated, it has been reported that the protein is related to the basic mechanisms of aging (Swindell, 2011). In addition, there is evidence of an association between metallothionein’s overexpression and longevity in mice (Yang et al., 2006), and between genotype variation of metallothionein and life span in humans (Cipriano et al., 2006).
Another interesting finding is the overexpression of a number of transcriptional factors in the aging brain. Some of them are known as regulators of genes controlling CNS development, and are expressed in the developing brain (e.g., SOX2 and PAX6); other genes are involved in the response to DNA damage (e.g., HES1). The literature describing age-related changes in gene expression in brain tissue (Colantuoni et al., 2011; Kang et al., 2011; Lu et al., 2004; Somel et al., 2009) provides similar findings on the positive correlation between age and the activity of genes involved in DNA repair and binding, and the regulation of transcription.
In general, the results of this study are consistent with published studies on aging-related dynamic changes in gene expression in the brain. Our results highlight the fact that, being in general stochastic, gene-expression changes have a systematic directed component: factors of the regulation of genome activity and genes coding stress-sensitive proteins can significantly increase their expression with aging. At the same time, a global decrease in genome activity at the transcriptional level, especially a significant decrease in the activity of genes regulating the neuron signaling, throughout normal aging might crucially affect the neocortex functioning and underlie age-related declines in intellectual functions.
Conclusion
The results of our preliminary study have provided some important findings on the structure and diversity of the transcriptome in the human brain. It has become obvious that interindividual diversity in gene expression in the neocortex is a substantial one order of magnitude higher than gene-expression variation between distinct cortical areas within individuals. This conclusion might be important for planning a comparative study of gene expression in cortical regions of the brain. Despite the limitations of the small sample size and, as a consequence, the lack of statistically significant results, our work has indicated the potential use of novel experimental technologies, high-throughput second-generation sequencing of the transcriptome, to detect region-specific expression profiles in distinct functional areas of the neocortex. The results of our investigation, even based on one pairwise comparison of transcriptomes from two individuals of different ages, have shown that most of the found interindividual gene-expression differences might be explained in terms of the age-related dynamics of the transcriptome in the brain. We demonstrated that most of the gene-expression changes in the aging neocortex are related to different cellular signal systems; this might significantly affect signal transduction in the neocortex and might be associated with declines in brain function.
Continued investigation in this field might contribute to a better understanding of the relationships between higher cognitive functions and the transcriptional status of the CNS, as well as the dynamics of these relationships during the life span, throughout different development stages. Such studies, focused on molecular mechanisms underlying normal development, might be especially informative for investigations of relationships between interruptions of these mechanisms and disorders in CNS development and functioning.
Supplementary Material
Acknowledgments
This work was supported by Awards DC007665 as administered by the National Institute of Deafness and Communication Disorders and P50 HD052120 as administered by the Eunice Kennedy Shriver National Institute of Child Health and Human Development. Grantees undertaking such projects are encouraged to freely express their professional judgment. Therefore, this article does not necessarily reflect the position or policies of the National Institutes of Health, and no official endorsement should be inferred. The authors alone are responsible for the content and writing of the article.
Footnotes
Supplementary Materials and Methods
The supplementary material referred to in this article can be found online at http://journals.cambridge.org/dpp
References
- Albert MS, Stafford JL. Computed tomography studies. In: Albert MS, Moss MB, editors. Geriatric neuropsychology. New York: Guilford Press; 1988. [Google Scholar]
- Amaral PP, Clark MB, Gascoigne DK, Dinger ME, Mattick JS. lncRNAdb: A reference database for long noncoding RNAs. Nucleic Acids Research. 2011;39:D146–D151. doi: 10.1093/nar/gkq1138. [DOI] [PMC free article] [PubMed] [Google Scholar]
- Amenta F, Zaccheo D, Collier WL. Neurotransmitters, neuro-receptors and aging. Mechanisms of Ageing and Development. 1991;61:249–273. doi: 10.1016/0047-6374(91)90059-9. [DOI] [PubMed] [Google Scholar]
- Anders S, Huber W. Differential expression analysis for sequence count data. Genome Biology. 2010;11:R106. doi: 10.1186/gb-2010-11-10-r106. [DOI] [PMC free article] [PubMed] [Google Scholar]
- Asmann YW, Klee EW, Thompson EA, Perez EA, Middha S, Oberg AL, et al. 3′ tag digital gene expression profiling of human brain and universal reference RNA using Illumina Genome Analyzer. BMC Genomics. 2009;10:531. doi: 10.1186/1471-2164-10-531. [DOI] [PMC free article] [PubMed] [Google Scholar]
- Bakker SL, de Leeuw FE, de Groot JC, Hofman A, Koudstaal PJ, Breteler MM. Cerebral vasomotor reactivity and cerebral white matter lesions in the elderly. Neurology. 1999;52:578–583. doi: 10.1212/wnl.52.3.578. [DOI] [PubMed] [Google Scholar]
- Band GPH, Ridderinkhof KR, Segalowitz S. Explaining of neurocognitive aging: Is one factor enough? Brain and Cognition. 2002;49:259–267. doi: 10.1006/brcg.2001.1499. [DOI] [PubMed] [Google Scholar]
- Barresi BA, Nicholas M, Tabor Connor L, Obler LK, Albert ML. Semantic degradation and lexical access in age-related naming failures. Aging, Neuropsychology, and Cognition. 2000;7:169–178. [Google Scholar]
- Barresi BA, Obler LK, Au R, Albert ML. Language-related factors influencing naming in adulthood. In: Hamilton H, editor. Language and communication in old age and language: Multidisciplinary perspectives. New York: Garland Publishing; 1999. pp. 77–90. [Google Scholar]
- Barton AJL, Pearson RCA, Najlerahim A, Harrison PJ. Pre- and postmortem influences on brain RNA. Journal of Neurochemistry. 1993;61:1–11. doi: 10.1111/j.1471-4159.1993.tb03532.x. [DOI] [PubMed] [Google Scholar]
- Borovecki F, Lovrecic L, Zhou J, Jeong H, Then F, Rosas HD, et al. Genome-wide expression profiling of human blood reveals biomarkers for Huntington’s disease. Proceedings of the National Academy of Sciences. 2005;102:11023–11028. doi: 10.1073/pnas.0504921102. [DOI] [PMC free article] [PubMed] [Google Scholar]
- Buechel HM, Popovic J, Searcy JL, Porter NM, Thibault O, Blalock EM. Deep sleep and parietal cortex gene expression changes are related to cognitive deficits with age. PLoS One. 2011;6:e18387. doi: 10.1371/journal.pone.0018387. [DOI] [PMC free article] [PubMed] [Google Scholar]
- Burke SN, Barnes CA. Neural plasticity in the ageing brain. Nature Reviews Neuroscience. 2006;7:30–40. doi: 10.1038/nrn1809. [DOI] [PubMed] [Google Scholar]
- Catts VS, Catts SV, Fernandez HR, Taylor JM, Coulson EJ, Lutze-Mann LH. A microarray study of post-mortem mRNA degradation in mouse brain tissue. Molecular Brain Research. 2005;138:164–177. doi: 10.1016/j.molbrainres.2005.04.017. [DOI] [PubMed] [Google Scholar]
- Chodroff RA, Goodstadt L, Sirey TM, Oliver PL, Davies KE, Green ED, et al. Long noncoding RNA genes: Conservation of sequence and brain expression among diverse amniotes. Genome Biology. 2010;11:R72. doi: 10.1186/gb-2010-11-7-r72. [DOI] [PMC free article] [PubMed] [Google Scholar]
- Cipriano C, Malavolta M, Costarelli L, Giacconi R, Muti E, Gasparini N, et al. Polymorphisms in MT1a gene coding region are associated with longevity in Italian Central female population. Biogerontology. 2006;7:357–365. doi: 10.1007/s10522-006-9050-x. [DOI] [PubMed] [Google Scholar]
- Colantuoni C, Lipska BK, Ye T, Hyde TM, Tao R, Leek JT, et al. Temporal dynamics and genetic control of transcription in the human prefrontal cortex. Nature. 2011;478:519–524. doi: 10.1038/nature10524. [DOI] [PMC free article] [PubMed] [Google Scholar]
- Colantuoni C, Purcell AE, Bouton CML, Pevsner J. High throughput analysis of gene expression in the human brain. Journal of Neuroscience Research. 2000;59:1–10. doi: 10.1002/(sici)1097-4547(20000101)59:1<1::aid-jnr1>3.0.co;2-2. [DOI] [PubMed] [Google Scholar]
- Deary IJ, Leaper S, Murray AD, Staff RT, Whalley LJ. Cerebral white matter abnormalities and lifetime cognitive change: A 67-year follow-up of the Scottish Mental Survey of 1932. Psychology & Aging. 2003;18:140–148. doi: 10.1037/0882-7974.18.1.140. [DOI] [PubMed] [Google Scholar]
- Dekaban AS, Sadowsky D. Changes in brain weights during the span of human life: Relation of brain weights to body heights and body weights. Annals of Neurology. 1978;4:345–356. doi: 10.1002/ana.410040410. [DOI] [PubMed] [Google Scholar]
- de la Grange P, Gratadou L, Delord M, Dutertre M, Auboeuf D. Splicing factor and exon profiling across human tissues. Nucleic Acids Research. 2010;38:2825–2838. doi: 10.1093/nar/gkq008. [DOI] [PMC free article] [PubMed] [Google Scholar]
- Diaz E. From microarraysto mechanisms of brain development and function. Biochemical & Biophysical Research Communications. 2009;385:129–131. doi: 10.1016/j.bbrc.2009.05.057. [DOI] [PubMed] [Google Scholar]
- Gilfillan GD, Selmer KK, Roxrud I, Smith R, Kyllerman M, Eiklid K, et al. SLC9A6 mutations cause X-linked mental retardation, microcephaly, epilepsy, and ataxia, a phenotype mimicking Angelman syndrome. American Journal of Human Genetics. 2008;82:1003–1010. doi: 10.1016/j.ajhg.2008.01.013. [DOI] [PMC free article] [PubMed] [Google Scholar]
- Harrison PJ, Heath PR, Eastwood SL, Burnet PWJ, McDonald B, Pearson RCA. The relative importance of premortem acidosis and postmortem interval for human brain gene expression studies: Selective mRNA vulnerability and comparison with their encoded proteins. Neuroscience Letters. 1995;200:151–154. doi: 10.1016/0304-3940(95)12102-a. [DOI] [PubMed] [Google Scholar]
- Harrow J, Denoeud F, Frankish A, Reymond A, Chen C, Chrast J, et al. GENCODE: Producing a reference annotation for ENCODE. Genome Biology. 2006;7:S4. doi: 10.1186/gb-2006-7-s1-s4. [DOI] [PMC free article] [PubMed] [Google Scholar]
- Hof PR, Morrison JH. The aging brain: Morphomolecular senescence of cortical circuits. Trends in Neurosciences. 2004;27:607–613. doi: 10.1016/j.tins.2004.07.013. [DOI] [PubMed] [Google Scholar]
- Huang DW, Sherman BT, Lempicki RA. Bioinformatics enrichment tools: Paths toward the comprehensive functional analysis of large gene lists. Nucleic Acids Research. 2009;37:1–13. doi: 10.1093/nar/gkn923. [DOI] [PMC free article] [PubMed] [Google Scholar]
- International Human Genome Sequencing Consortium. Finishing the euchromatic sequence of the human genome. Nature. 2004;431:931–945. doi: 10.1038/nature03001. [DOI] [PubMed] [Google Scholar]
- Irizarry RA, Warren D, Spencer F, Kim IF, Biswal S, Frank BC, et al. Multiple-laboratory comparison of microarray platforms. Nature Methods. 2005;2:345–350. doi: 10.1038/nmeth756. [DOI] [PubMed] [Google Scholar]
- Johnson MB, Kawasawa YI, Mason CE, Krsnik Z, Coppola G, Bogdanovic D, et al. Functional and evolutionary insights into human brain development through global transcriptome analysis. Neuron. 2009;62:494–509. doi: 10.1016/j.neuron.2009.03.027. [DOI] [PMC free article] [PubMed] [Google Scholar]
- Kabaso D, Coskren PJ, Henry BI, Hof PR, Wearn SL. The electronic structure of pyramidal neurons contributing to prefrontal cortical circuits in macaque monkeys is significantly altered in aging. Cerebral Cortex. 2009;19:2248–2268. doi: 10.1093/cercor/bhn242. [DOI] [PMC free article] [PubMed] [Google Scholar]
- Kaiser LG, Schuff N, Cashdollar N, Weiner MW. Age-related glutamate and glutamine concentration changes in normal human brain: 1H MR spectroscopy study at 4T. Neurobiology of Aging. 2005;26:665–672. doi: 10.1016/j.neurobiolaging.2004.07.001. [DOI] [PMC free article] [PubMed] [Google Scholar]
- Kang HJ, Kawasawa YI, Cheng F, Zhu Y, Xu X, Li M, et al. Spatio-temporal transcriptome of the human brain. Nature. 2011;478:483–489. doi: 10.1038/nature10523. [DOI] [PMC free article] [PubMed] [Google Scholar]
- Kawasaki ES. The end of the microarray Tower of Babel: Will universal standards lead the way? Journal of Biomolecular Techniques. 2006;17:200–206. [PMC free article] [PubMed] [Google Scholar]
- Khaitovich P, Muetzel B, She X, Lachmann M, Hellmann I, Dietzsch J, et al. Regional patterns of gene expression in human and chimpanzee brains. Genome Research. 2004;14:1462–1473. doi: 10.1101/gr.2538704. [DOI] [PMC free article] [PubMed] [Google Scholar]
- Kinter J, Zeis T, Schaeren-Wiemers N. RNA profiling of MS brain tissues. International MS Journal. 2008;15:51–58. [PubMed] [Google Scholar]
- Kluger A, Gianutsos JG, Golomb J, Ferris SH, George AE, Franssen E, et al. Patterns of motor impairement in normal aging, mild cognitive decline, and early Alzheimer’s disease. Journal of Gerontology. 1997;52B:28–39. doi: 10.1093/geronb/52b.1.p28. [DOI] [PubMed] [Google Scholar]
- Kolb B, Whishaw I. Brain plasticity and behaviour. Annual Review of Psychology. 1988;49:43–64. doi: 10.1146/annurev.psych.49.1.43. [DOI] [PubMed] [Google Scholar]
- Kuss AW, Chen W. MicroRNAs in brain function and disease. Current Neurology and Neuroscience Reports. 2008;8:190–197. doi: 10.1007/s11910-008-0031-0. [DOI] [PubMed] [Google Scholar]
- Lambert N, Lambot MA, Bilheu A, Albert V, Englert Y, Libert F, et al. Genes expressed in specific areas of the human fetal cerebral cortex display distinct patterns of evolution. PLoS One. 2011;6:e17753. doi: 10.1371/journal.pone.0017753. [DOI] [PMC free article] [PubMed] [Google Scholar]
- Langmead B, Trapnell C, Pop M, Salzberg SL. Ultrafast and memory-efficient alignment of short DNA sequences to the human genome. Genome Biology. 2009;10:R25. doi: 10.1186/gb-2009-10-3-r25. [DOI] [PMC free article] [PubMed] [Google Scholar]
- Landgraf P, Rusu M, Sheridan R, Sewer A, Iovino N, Aravin A, et al. A mammalian microRNA expression atlas based on small RNA library sequencing. Cell. 2007;129:1401–1414. doi: 10.1016/j.cell.2007.04.040. [DOI] [PMC free article] [PubMed] [Google Scholar]
- Liu S, Lin L, Jiang P, Wang D, Xing Y. A comparison of RNA-Seq and high-density exon array for detecting differential gene expression between closely related spicies. Nucleic Acids Research. 2011;39:78–588. doi: 10.1093/nar/gkq817. [DOI] [PMC free article] [PubMed] [Google Scholar]
- Lockhart DJ, Barlow C. DNA arrays and gene expression analysis in the brain. In: Chin HR, Moldin SO, editors. Methods in genomic neuroscience. New York: CRC Press; 2001. pp. 109–140. [Google Scholar]
- Lu T, Pan Y, Kao SY, Li C, Kohane I, Chan J, et al. Gene regulation and DNA damage in the ageing human brain. Nature. 2004;429:883–891. doi: 10.1038/nature02661. [DOI] [PubMed] [Google Scholar]
- Magnusson KR. The aging of NMDA receptor complex. Frontiers in Bioscience. 1998;3:e70. doi: 10.2741/a368. [DOI] [PubMed] [Google Scholar]
- Malmgren R. Epidemiology of aging. In: Coffey CE, Cummings JL, editors. Textbook of geriatric neuropsychiatry. Washington, DC: American Psychiatric Press; 2000. pp. 17–31. [Google Scholar]
- Marioni JC, Mason CE, Mane SM, Stephens M, Gilad Y. RNA-seq: An assessment of technical reproducibility and comparison with gene expression arrays. Genome Research. 2008;18:1509–1517. doi: 10.1101/gr.079558.108. [DOI] [PMC free article] [PubMed] [Google Scholar]
- Masliah E, Mallory M, Hansen L, DeTeresa R, Terry RD. Quantitative synaptic alterations in the human neocortex during normal aging. Neurology. 1993;43:192–197. doi: 10.1212/wnl.43.1_part_1.192. [DOI] [PubMed] [Google Scholar]
- McShea A, Marlatt MW, Lee HG, Tarkowsky SM, Smit M, Smith MA. The application of microarray technology to neuropathology: Cutting edge tool with clinical diagnostics potential or too much information? Journal of Neuropathology and Experimental Neurology. 2006;65:1031–1039. doi: 10.1097/01.jnen.0000240471.04920.3c. [DOI] [PubMed] [Google Scholar]
- Mexal S, Berger R, Adams CE, Ross RG, Freedman R, Leonard S. Brain pH has a significant impact on human postmortem hippocampal gene expression profiles. Brain Research. 2006;1106:1–11. doi: 10.1016/j.brainres.2006.05.043. [DOI] [PubMed] [Google Scholar]
- Miller DB, O’Callaghan JP. Effect of aging and stress on hippocampal structure and function. Metabolism. 2003;52:17–21. doi: 10.1016/s0026-0495(03)00296-8. [DOI] [PubMed] [Google Scholar]
- Miller RM, Federoff HJ. Microarrays in Parkinson’s disease: A systematic approach. Journal of the American Society for Experimental NeuroTherapeutics. 2006;3:319–326. doi: 10.1016/j.nurx.2006.05.008. [DOI] [PMC free article] [PubMed] [Google Scholar]
- Mirnics K, Pevsner J. Progress in the use of microarray technology to study the neurobiology of disease. Nature Neuroscience. 2004;7:434–439. doi: 10.1038/nn1230. [DOI] [PubMed] [Google Scholar]
- Molyneaux BJ, Arlotta P, Menezes JR, Macklis JD. Neuronal subtype specification in the cerebral cortex. Nature Reviews Neuroscience. 2007;8:427–437. doi: 10.1038/nrn2151. [DOI] [PubMed] [Google Scholar]
- Moreau MP, Bruse SE, David-Rus R, Buyske S, Brzustowicz LM. Altered microRNA expression profiles in postmortem brain samples from individuals with schizophrenia and bipolar disorder. Biological Psychiatry. 2011;69:188–193. doi: 10.1016/j.biopsych.2010.09.039. [DOI] [PMC free article] [PubMed] [Google Scholar]
- Mortazavi A, Williams BA, McCue K, Schaeffer L, Wold B. Mapping and quantifying mammalian transcriptomes by RNA-Seq. Nature Methods. 2008;5:621–628. doi: 10.1038/nmeth.1226. [DOI] [PubMed] [Google Scholar]
- Mudge J, Miller NA, Khrebtukova I, Lindquist IE, May GD, Huntley JJ, et al. Genomic convergence analysis of Schizophrenia: mRNA sequencing reveals altered synaptic vesicular transport in postmortem cerebellum. PLoS One. 2007;3:e3625. doi: 10.1371/journal.pone.0003625. [DOI] [PMC free article] [PubMed] [Google Scholar]
- Munakata M, Watanabe M, Otsuki T, Nakama H, Arima K, Itoh M, et al. Altered distribution of KCC2 in cortical dysplasia in patients with intractable epilepsy. Epilepsia. 2007;48:837–844. doi: 10.1111/j.1528-1167.2006.00954.x. [DOI] [PubMed] [Google Scholar]
- Myers AJ, Gibbs JR, Webster JA, Rohrer K, Zhao A, Marlowe L, et al. A survey of genetic human cortical gene expression. Nature Genetics. 2007;39:1494–1499. doi: 10.1038/ng.2007.16. [DOI] [PubMed] [Google Scholar]
- Nadler JJ, Zou F, Huang H, Moy SS, Lauder J, Crawley JN, et al. Large-scale gene expression differences across brain regions and inbred strains correlate with a behavioral phenotype. Genetics. 2006;174:1229–1336. doi: 10.1534/genetics.106.061481. [DOI] [PMC free article] [PubMed] [Google Scholar]
- Nicholas M, Connor LT, Obler LK, Albert ML. Aging, language, and language disorders. In: Sarno MT, editor. Acquired aphasia. San Diego, CA: Academic Press; 1998. pp. 413–449. [Google Scholar]
- Nicholas M, Obler LK, Albert ML, Goodglass H. Lexical retrieval in helathy aging. Cortex. 1985;21:595–606. doi: 10.1016/s0010-9452(58)80007-6. [DOI] [PubMed] [Google Scholar]
- Ota M, Yasuno F, Ito H, Seki C, Kozaki S, Asada T, et al. Age-related decline of dopamine synthesis in the living human brain measured by positron emission tomography with L-[β-11 C]DOPA. Life Sciences. 2006;79:730–736. doi: 10.1016/j.lfs.2006.02.017. [DOI] [PubMed] [Google Scholar]
- Peters A, Sethares C, Luebke JI. Synapses are lost during aging in the primate prefrontal cortex. Neuroscience. 2008;152:970–981. doi: 10.1016/j.neuroscience.2007.07.014. [DOI] [PMC free article] [PubMed] [Google Scholar]
- Ponjavic J, Oliver PL, Lunter G, Ponting CP. Genomic and transcriptional co-localization of protein-coding and long non-coding RNA pairs in the developing brain. PLoS Genetics. 2009;5:e1000617. doi: 10.1371/journal.pgen.1000617. [DOI] [PMC free article] [PubMed] [Google Scholar]
- Rabbit P. Methodology of frontal and executive function. Hove: Taylor & Francis; 1997. [Google Scholar]
- Ramskold D, Wang ET, Burge CB, Sandberg R. An abundance of ubiquitously expressed genes revealed by tissue transcriptome sequence data. PLoS Computational Biology. 2009;5:e1000598. doi: 10.1371/journal.pcbi.1000598. [DOI] [PMC free article] [PubMed] [Google Scholar]
- Raz N, Rodrigue KM, Head D, Kennedy KM, Acker JD. Differential aging of the medial temporal lobe: a study of a five-year change. Neurology. 2004;62:433–438. doi: 10.1212/01.wnl.0000106466.09835.46. [DOI] [PubMed] [Google Scholar]
- Roth RB, Hevezi P, Lee J, Willhite D, Lechner SM, Foster AC, et al. Gene expression analyses reveal molecular relationships among 20 regions of the human CNS. Neurogenetics. 2006;7:67–80. doi: 10.1007/s10048-006-0032-6. [DOI] [PubMed] [Google Scholar]
- Sequeira A, Morgan L, Walsh DM, Cartagena PM, Choudary P, Li J, et al. Gene expression changes in the prefrontal cortex, anterior cingulate cortex and nucleus accumbens of mood disorders subjects that committed suicide. PLoS One. 2012;7:e35367. doi: 10.1371/journal.pone.0035367. [DOI] [PMC free article] [PubMed] [Google Scholar]
- Scherzer CR. Chipping away at diagnostics for neurodegenerative diseases. Neurobiology of Disease. 2009;35:148–156. doi: 10.1016/j.nbd.2009.02.016. [DOI] [PMC free article] [PubMed] [Google Scholar]
- Skullerud K. Variations in the size of the human brain. Influence of age, sex, body length, body mass index, alcoholism, Alzheimer changes, and cerebral atherosclerosis. Acta Neurologica Scandinavica Supplementum. 1985;102:1–94. [PubMed] [Google Scholar]
- Somel M, Franz H, Yan Z, Lorenc A, Guo S, Giger T, et al. Transcriptional neoteny in the human brain. Proceedings of the National Academy of Sciences. 2009;106:5743–5757. doi: 10.1073/pnas.0900544106. [DOI] [PMC free article] [PubMed] [Google Scholar]
- Somel M, Guo S, Fu N, Yan Z, Hu HY, Xu Y, et al. Micro-RNA, mRNA, and protein expression link development and aging in human and macaque brain. Genome Research. 2010;20:1207–1218. doi: 10.1101/gr.106849.110. [DOI] [PMC free article] [PubMed] [Google Scholar]
- Somel M, Khaitovich P, Bahn S, Paabo S, Lachmann M. Gene expression becomes heterogeneous with age. Current Biology. 2006;16:R359–R360. doi: 10.1016/j.cub.2006.04.024. [DOI] [PubMed] [Google Scholar]
- St Laurent G, Faghihi MA, Wahlestedt C. Non-coding RNA transcripts: Sensors of neuronal stress, modulators of synaptic plasticity, and agents of change in the onset of Alzheimer’s disease. Neuroscience Letters. 2009;466:81–88. doi: 10.1016/j.neulet.2009.08.032. [DOI] [PMC free article] [PubMed] [Google Scholar]
- Strand AD, Aragaki AK, Baquet ZC, Hodges A, Cunningham P, Holmans P, et al. Conservation of regional gene expression in mouse and human brain. PLoS Genetics. 2007;3:e59. doi: 10.1371/journal.pgen.0030059. [DOI] [PMC free article] [PubMed] [Google Scholar]
- Stuart-Hamilton I. The psychology of ageing: An introduction. 4. London: Jessica Kingsley; 2006. [Google Scholar]
- Swindell WR. Metallothionein and the biology of aging. Ageing Research Reviews. 2011;10:132–145. doi: 10.1016/j.arr.2010.09.007. [DOI] [PMC free article] [PubMed] [Google Scholar]
- Terry RD, DeTeresa R, Hansen LA. Neocortical cell counts in normal human adult aging. Annals of Neurology. 1987;21:530–539. doi: 10.1002/ana.410210603. [DOI] [PubMed] [Google Scholar]
- ‘t Hoen PA, Ariyurek Y, Thygesen HH, Vreugdenhil E, Vossen RH, de Menezes RX, et al. Deep sequencing-based expression analysis shows major advances in robustness, resolution and inter-lab portability over five microarray platforms. Nucleic Acids Research. 2008;36:e141. doi: 10.1093/nar/gkn705. [DOI] [PMC free article] [PubMed] [Google Scholar]
- Toescu EC. Altered calcium homeostasis in old neurons. In: Riddle DR, editor. Brain aging: Models, methods, and mechanisms. Boca Raton, FL: CRC Press; 2007. [Google Scholar]
- Trapnell C, Pachter L, Salzberg SL. TopHat: Discovering splice junctions with RNA-Seq. Bioinformatics. 2009;25:1105–1111. doi: 10.1093/bioinformatics/btp120. [DOI] [PMC free article] [PubMed] [Google Scholar]
- Trapnell C, Williams BA, Pertea G, Mortazavi AM, Kwan G, van Baren MJ, et al. Transcript assembly and quantification by RNA-Seq reveals unannotated transcripts and isoform switching during cell differentiation. Nature Biotechnology. 2010;28:511–515. doi: 10.1038/nbt.1621. [DOI] [PMC free article] [PubMed] [Google Scholar]
- van der Brug M, Nalls MA, Cookson MR. Deep sequencing of coding and non-coding RNA in the CNS. Brain Research. 2010;1338:146–154. doi: 10.1016/j.brainres.2010.03.039. [DOI] [PMC free article] [PubMed] [Google Scholar]
- Von Bernhardi R, Tichauer JE, Eugenín J. Aging-dependent changes of microglial cells and their relevance for neurodegenerative disorders. Journal Neurochemistry. 2010;112:1099–1114. doi: 10.1111/j.1471-4159.2009.06537.x. [DOI] [PubMed] [Google Scholar]
- Wang Z, Gerstein M, Snyder M. RNA-Seq: A revolutionary tool for transcriptomics. Nature Reviews Genetics. 2009;10:57–63. doi: 10.1038/nrg2484. [DOI] [PMC free article] [PubMed] [Google Scholar]
- Wang ET, Sandberg R, Luo S, Khrebtukova I, Zhang L, Mayr C, et al. Alternative isoform regulation in human tissue transcriptomes. Nature. 2008;456:470–476. doi: 10.1038/nature07509. [DOI] [PMC free article] [PubMed] [Google Scholar]
- Wang J, Williams RW, Manly KF. WebQTL: Web-based complex trait analysis. Neuroinformatics. 2003;1:299–308. doi: 10.1385/NI:1:4:299. [DOI] [PubMed] [Google Scholar]
- Woodruff-Pak DS. The neuropsychology of aging. Oxford: Blackwell; 1997. [Google Scholar]
- Wong DF, Wagner HN, Jr, Dannals RF, Links JM, Frost JJ, Ravert HT, et al. Effects of age on dopamine and serotonin receptors measured by positron tomography in the living human brain. Science. 1984;226:1393–1396. doi: 10.1126/science.6334363. [DOI] [PubMed] [Google Scholar]
- Yang X, Doser TA, Fang CX, Nunn JM, Janardhanan R, Zhu M, et al. Metallothionein prolongs survival and antagonizes senescence-associated cardiomyocyte diastolic dysfunction: Role of oxidative stress. FASEB Journal. 2006;20:1024–1026. doi: 10.1096/fj.05-5288fje. [DOI] [PubMed] [Google Scholar]
- Ziats MN, Rennert OM. Expression profiling of autism candidate genes during human brain development implicates central immune signaling pathways. PLoS ONE. 2011;6:e24691. doi: 10.1371/journal.pone.0024691. [DOI] [PMC free article] [PubMed] [Google Scholar]
Associated Data
This section collects any data citations, data availability statements, or supplementary materials included in this article.