Abstract
Altered brain connectivity has emerged as a central feature of schizophrenia. Low frequency oscillations and connectivity strength (CS) of resting state brain networks are altered in patients with schizophrenia (SZs). However, the relationship between these two measures has not yet been studied. Such work may be helpful in understanding the so-called “rich club” organization (i.e. high-CS nodes are more densely connected among themselves than are nodes of a lower CS in the human brain) in healthy controls (HCs) and SZs. Here we present a study of HCs and SZs examining low frequency oscillations and CS by first decomposing resting state fMRI (R-fMRI) data into independent components (ICs) using group independent component analysis (ICA) and computing the low frequency power ratio (LFPR) of each ICA time course. Weighted brain graphs consisting of ICs were built based on correlations between ICA time courses. Positive CS and negative CS of each node in the brain graphs were then examined. The correlations between LFPR and CSs as well as “rich club” coefficients of group mean brain graphs were assessed. Results demonstrate that the LFPR of some ICs were lower in SZs compared to HCs. In addition, LFPR was correlated with positive CS in HCs, but to a lesser extent in SZs. HCs showed higher normalized rich club parameter than SZs. The findings provide new insight into disordered intrinsic brain graphs in schizophrenia.
Keywords: Low frequency, Connectivity strength, Rich club, R-fMRI, Schizophrenia, Brain graph
1. Introduction
Schizophrenia is a severe mental illness characterized by symptoms including delusions, hallucinations, apathy, social withdrawal, and deficits in cognitive functions such as attention and working memory (American, 2000; Marin, 2012). Resting-state fMRI (R-fMRI) has emerged as a powerful tool to explore the underlying intrinsic neuromechanism of schizophrenia. In R-fMRI studies, low frequency (0.01–0.10 Hz) blood oxygen level dependent (BOLD) signals are believed to reflect underlying neuronal activity (Damoiseaux et al., 2006; van den Heuvel and Hulshoff Pol, 2010). Recent studies have found aberrant spontaneous low frequency fluctuations in patients with schizophrenia (SZs) which may form the basis of some resting state deficits in the condition (Hoptman et al., 2010).
Abnormal brain network connectivity in SZs is also revealed using R-fMRI data which support the hypothesis that schizophrenia is a dysconnection (Stephan et al., 2006) syndrome (Friston and Frith, 1995; Volkow et al., 1988; Weinberger et al., 1992). Graph theory-based analysis is a popular technique to examine brain connectivity in R-fMRI data. In such work, connectivity strength (CS) is an important measure to assess the centrality or functional importance of a node (Zuo et al., In Press). Brain regions with high CS are hubs which often interact with many other regions, facilitating integration (Rubinov and Sporns, 2010). Rich club coefficient is another graph measure which is closely related with CS, describes the tightness and completeness of connections within a subset of high-CS nodes. A recent study has demonstrated the so-called “rich-club” (the hubs tend to be more densely connected among themselves than nodes of a lower degree) phenomenon is present in structural brain networks (van den Heuvel and Sporns, 2011). Though multiple studies have reported altered CS and/or other graph metrics in schizophrenia (Bassett et al., 2012; Liang et al., 2006; Liu et al., 2008; Lynall et al., 2010; Pettersson-Yeo et al., 2011; Yu et al., 2012; Yu et al., 2011), the rich club organization of functional brain graph has not been explored in HCs or SZs.
Another limitation of previous studies is that they explored the alteration of CS or low frequency BOLD fluctuations of brain network in SZs separately. It is also important to consider whether the relationship between low frequency BOLD signals and CS is altered in SZs compare with HCs, because it has been thought that correlation of low frequency fluctuations during resting state is a manifestation of functional connectivity in human brain (Biswal et al., 1995; Cordes et al., 2001; Cordes et al., 2000). Such information with rich club analysis may contribute to understand the intrinsic organization of the functional brain graph and provide new insights into the relationship between univariate and bivariate properties of brain graph in which to discuss the neuropathology of schizophrenia (Bassett et al., 2012; Zalesky et al., 2011). In this study, after building weighted brain graphs consisting of independent brain components assessed by group independent component analysis (ICA) using R-fMRI data, correlations between low frequency power ratio (LFPR) and CS, as well as rich club parameters of the brain network are evaluated. Based on the findings of dysconnectivity and altered topological properties of brain networks in schizophrenia reported by previous studies, we hypothesize that: I) low frequency fluctuations are associated with CS in HCs; II) this association is disrupted in SZs coincident with altered rich club phenomena.
2. Materials and methods
2.1. Participants
24 (8 females) HCs (mean age: 31.7 ± 9.2; range: 23–50) and 24 (5 females) SZs (mean age: 35.9 ± 12.1; range: 21–52) participated in this study. Age of the subjects showed no significant group difference (two-sample t-test, P = 0.18). All participants provided written, informed, IRB-approved consent from Hartford Hospital and Yale University and were compensated for their participation. Schizophrenia was diagnosed according to DSM-IV-TR criteria on the basis of a structured clinical interview (First et al., 1995) administered by a research nurse and by review of the medical records. All patients had chronic schizophrenia [Positive and Negative Syndrome Scale, PANSS, (Kay et al., 1987); positive score 16 ± 6, range 7–28; negative score 15 ± 6, range 7–27] and all were taking medication (including the atypical antipsychotic medications aripiprazole, clozapine, risperidone, quetiapine and olanzapine, first-generation antipsychotics including fluphenazine, and miscellaneous mood-stabilizing, hypnotic and anti-cholinergic medications including zolpidem, zaleplon, lorazepam, benztropine, divalproex, trazodone, clonazepam). All participants except 1 HC and 3 SZs were right-handed. Healthy participants were free of any DSM-IV TR Axis I disorder or psychotropic medication and had no family history of Axis I disorders.
2.2. Image acquisition
One 5-min resting state run for each subject was acquired at the Olin Neuropsychiatry Research Center at the Institute of Living/Hartford Hospital on a Siemens Allegra 3T dedicated head scanner equipped with 40 mT/m gradients and a standard quadrature head coil. Functional scans were acquired transaxially using gradient-echo echo-planar-imaging with the following parameters: repeat time (TR) 1.50 s, echo time (TE) 27 ms, field of view 24 cm, acquisition matrix 64 × 64, flip angle 70°, voxel size 3.75 × 3.75 × 4 mm3, slice thickness 4 mm, gap 1 mm, 29 slices, ascending acquisition. Six “dummy” scans were acquired at the beginning to allow for longitudinal equilibrium, after which the paradigm was automatically triggered to start by the scanner.
2.3. Preprocessing
FMRI Data were preprocessed using the SPM5 software package (http://www.fil.ion.ucl.ac.uk/spm/software/spm5/). Data were motion corrected using INRIalign—a motion correction algorithm unbiased by local signal changes (Freire et al., 2002), spatially normalized into the standard Montreal Neurological Institute (MNI) space, and spatially smoothed with a 10 × 10 × 10 mm3 full width at half-maximum Gaussian kernel. Following spatial normalization, the data (originally acquired at 3.75 × 3.75 × 4 mm3) were resliced to 3 × 3 × 3 mm3, resulting in 53 × 63 × 46 voxels.
2.4 Group ICA
Group spatial ICA (Calhoun et al., 2001; Calhoun et al., 2009) was performed using the GIFT software (http://mialab.mrn.org/software/gift/). Subject-specific data reduction by principal component analysis (PCA) retained 100 principal components (PCs) using a standard economy-size decomposition. Reduced data for all 48 participants were then decomposed into 75 aggregate components. We chose the relatively high model order ICA as previous studies demonstrated that such models yield refined components which correspond to known anatomical and functional segmentations (Abou-Elseoud et al., 2010; Allen et al., 2011; Kiviniemi et al., 2009; Smith et al., 2009). The Infomax ICA algorithm (Bell and Sejnowski, 1995) was repeated 10 times in ICASSO (http://research.ics.tkk.fi/ica/icasso/) and resulting components were clustered to estimate the reliability of the decomposition. Following the group decomposition, single subject time courses and spatial maps were back-reconstructed (Calhoun et al., 2001; Erhardt et al., 2011). Fifty-seven independent components (ICs) which did not contain large edge effects or ventricles by visual inspection were selected to compute power spectra.
2.5. Computation of low frequency power ratio and CS
Firstly, translations and rotations of the head estimated in the preprocessing of image realignment were regressed out from the time courses of each of the fifty-seven ICs in each subject. Time courses corrected for the effect of head motion were used for further analysis.
Spectra of ICs were estimated on time courses using fast Fourier transforms (FFTs). Then low frequency power ratio [LFPR, the ratio of the integral of spectral power between 0.01 and 0.10 Hz to the integral of power between 0.15 and 0.33 Hz (Allen et al., 2011)] of each component in each subject was computed. Group mean LFPRs were also assessed based on the group mean (average across 24 HCs and 24 SZs separately in HC group and SZ group) spectra.
ICs with time courses dominated by low frequency fluctuations often considered as resting state networks (Allen et al., 2011; Robinson et al., 2009). Following these studies, fifty-three ICs which have high (> 0.6) group mean LFPR in both HC group and SZ group were considered as of interest to do further analysis.
For each subject, a 53 × 53 fully connected, undirected, positively and negatively weighted brain graph in which nodes are the 53 ICs of interest was built by the Pearson correlations between band pass filtered (0.01–0.10 Hz) ICA time courses (Auer, 2008; Cordes et al., 2001). Following (Rubinov and Sporns, 2011), if the correlation between node i and node j, rij is positive, we denote the weight of this connection with
| (1) |
| (2) |
Equivalently, if rij is negative, we denote the weight of this connection with
| (3) |
| (4) |
Then the positive and negative CSs of node i were computed as
| (5) |
Finally, groups mean CSs of each node were estimated (averaged across 24 individuals in each group).
2.6. Correlation between LFPR and CSs and statistical analysis
Statistical differences between HCs and SZs of LFPR and CSs for individual nodes were assessed with two-tailed two-sample t-tests. False discovery rate (FDR) (Benjamini and Hochberg, 1995) was used to correct for multiple comparisons.
Pearson correlations between LFPR and positive CS, negative CS were computed in three analyses. i) correlation across 53 ICs estimated by group mean values. Each IC has the group mean LFPR and group mean (positive and negative) CSs. The correlations between 53 values of group mean LFPR and 53 values of group mean (positive and negative) CSs were computed in each group. ii) correlation across 53 ICs estimated in each subject. iii) correlation across subjects at a single IC (node). For each IC, correlations between LFPR and (positive and negative) CSs across 24 subjects in each group were estimated.
2.7 Rich club organization
A weighted rich club parameter Φreal of the 53 × 53 group averaged brain graphs was computed. The rich club coefficient was usually calculated as a function of k (degree or CS) in previous studies (Opsahl et al., 2008; van den Heuvel and Sporns, 2011). However, in the present study, in order to compare the rich club coefficient between the two groups, it was computed as the function of n (the top n nodes with high positive CS). Firstly, the 53 nodes were ranked according to the positive CS, resulting in a vector Nranked. Then all connections of the examined graph G were also ranked in respect by weight, resulting in a vector wranked. Next, within G, for each value of n (n = 3,4,5,…50 in this study), a weighted n × n sub-graph consisting of the top n nodes in Nranked was generated. Subsequently, the collective weight Wn was computed as the sum of the weights of the resulting n(n-1)/2 connections in the sub-graph. The weighted rich club parameter Φreal(n) was then computed as the ratio between Wn and the sum of the weights of the strongest n(n-1)/2 connections of the whole network which was evaluated based on the top n(n-1)/2 number of connections in wranked.
| (6) |
The rich club coefficient Φreal is typically normalized relative to a (set of) comparable random network(s), giving a normalized rich club coefficient Φnorm (Colizza et al., 2006; McAuley et al., 2007; van den Heuvel and Sporns, 2011). Φnorm > 1over a range of n reflects the existence of rich club organization in a graph. In this study, for each examined graph, the rich club curve was compared with the rich club curve of a set (m = 100) of random graphs, created by the Brute-Force Mean/Variance Matching algorithm [for details of this approach see (Zalesky et al., 2012)]. For each of the randomized graphs, at each level of n, the rich club coefficient Φrand was computed. Next, the overall Φrand(n) was computed as the average rich club coefficient over the m random graphs. The normalized rich club coefficient Φnorm(n) was computed as below.
| (7) |
3. Results
3.1. Group ICA and weighted graph
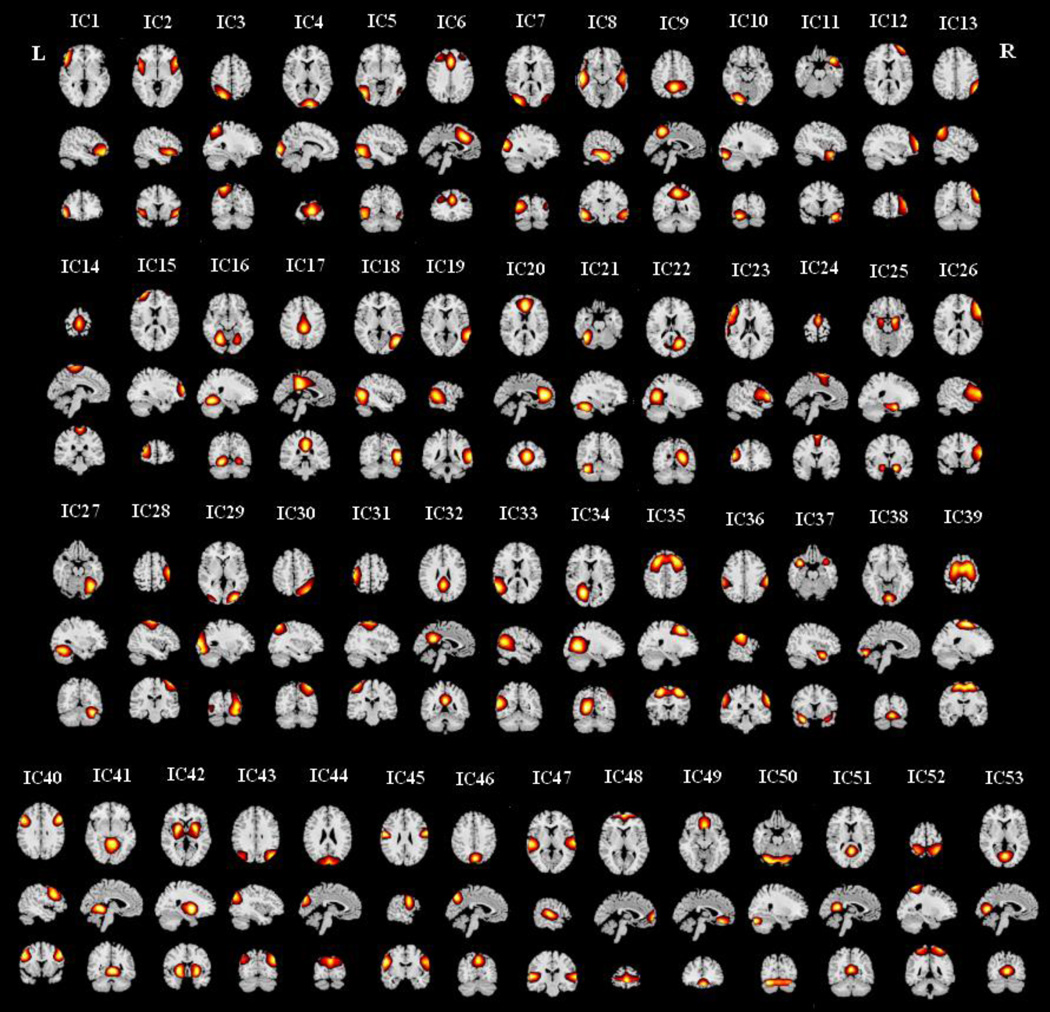
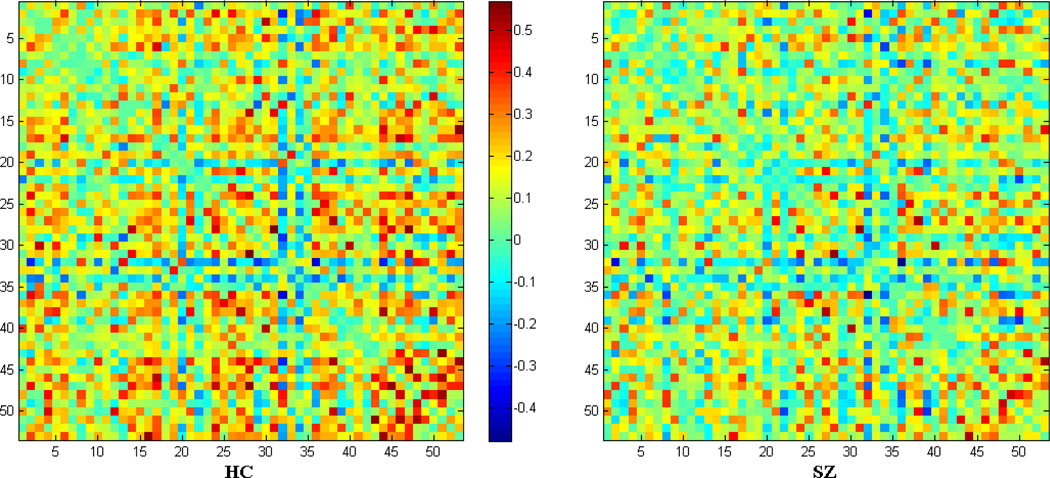
Brain components indentified by group ICA are similar to the resting state networks observed in previous studies (Abou-Elseoud et al., 2010; Allen et al., 2011). Spatial maps of the selected 53 components of interest are shown in Figure 1. ICs are indexed based on the sequence of output from GIFT. Figure 2 shows the structure of the group mean weighted graphs which were calculated by averaging the 53 × 53 correlation matrix across 24 subjects in HC group or SZ group.
Figure 1.
Spatial maps (z-score maps) of the 53 brain components identified by group ICA. Each component is shown in one column in axial, sagittal, and coronal views. ICs are indexed based on the sequence of output from GIFT. L: left; R: right.
Figure 2.
Structure of the mean correlation matrix in each group. Nodes are indexed the same as Figure 1.
3.2. LFPR and CSs of individual nodes
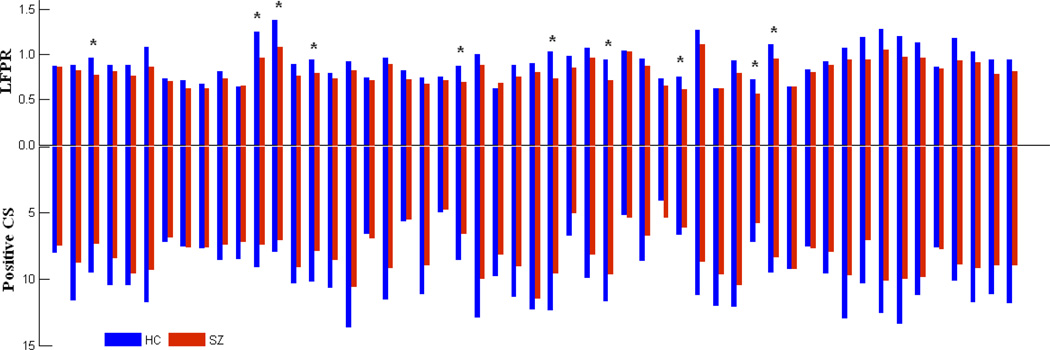
For CSs of individual ICs, although HCs showing higher positive CS and SZs showing higher negative CS in most ICs, group differences are not statistically significant (two sample t-tests on both positive and negative CS, P > 0.05, FDR correction).
LFPRs of individual ICs are higher in HCs and group differences are statistically significant (two sample t-tests, P < 0.05, FDR corrected) in 10 ICs. See Figure 3 for the group mean values of positive CS and LFPR for each IC.
Figure 3.
Group mean values of low frequency power ratio (LFPR, up side) and positive connectivity strength (CS, down side) for each IC. Height of the bar indicates the mean value of the relative measurement for the two groups and the color of the bar indicates the group. ICs are indexed (from left to right) same to Figure 1. Star indicates that IC (IC3 IC12 IC13 IC15 IC23 IC28 IC31 IC35 IC39 IC40) show significant group difference in LFPR.
3.3. Correlation between LFPR and CSs
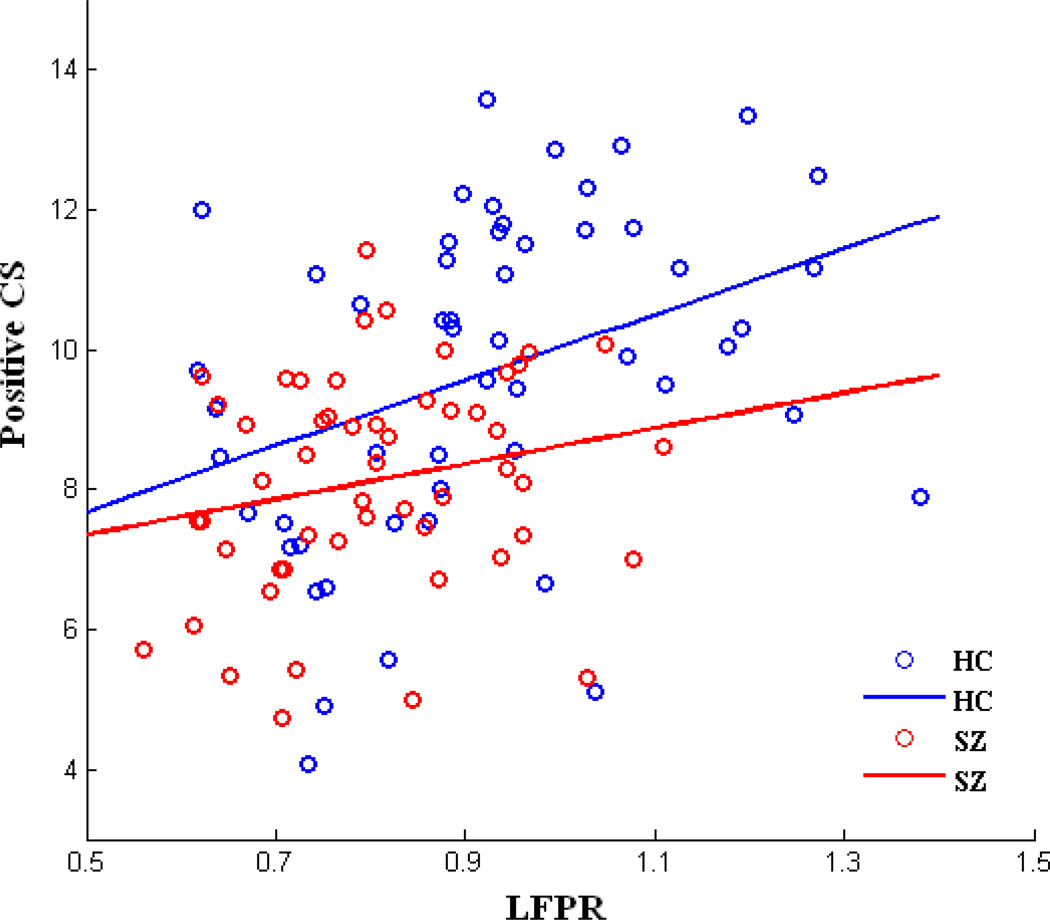
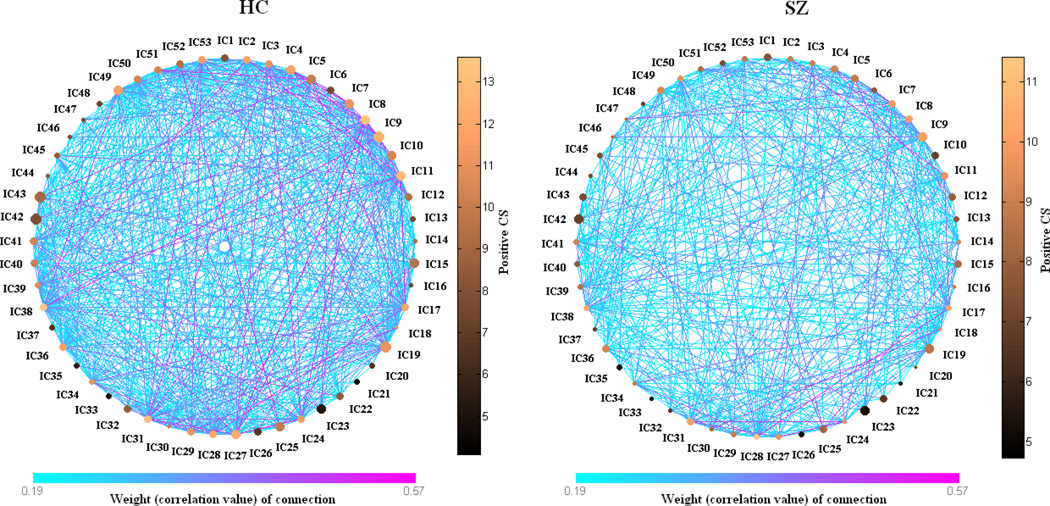
We didn’t find any correlation between LFPR and negative CS. Based on the correlation across 53 ICs between group mean LFPR and group mean positive CS, LFPR is significantly positively correlated with positive CS in HCs (r = 0.3672; P = 0.0068) and the two measures are not significantly correlated in SZs (r = 0.2126; P = 0.1264). Patterns of the correlation in both groups are shown in Figure 4. Weighted graphs about the relationship between LFPR and positive CS plotted based on the group mean values in HCs and SZs are shown in Figure 5.
Figure 4.
Scatter plots with trend lines showing group mean positive connectivity strength (CS) as a function of group mean low frequency power ratio (LFPR) in HCs and SZs. Each dot denotes a brain component. Pearson correlation coefficient for HCs (r = 0.367, P = 0.007), for SZs (r = 0.213, P = 0.126).
Figure 5.
Schematic weighted graphs showing the relationship between low frequency power ratio (LFPR) and positive connectivity strength (CS) plotted based on group mean values. Each node is a brain component. Color of a single line indicates the weight (correlation value) of that connection; size of the nodes indicates LFPR; color of nodes indicates positive CS.
For the correlation between LFPR and positive CS in individual subjects, LFPR is significantly positively correlated with positive CS (P < 0.05, FDR corrected) in 15 HCs and 9 SZs. Based on the correlations computed across 24 subjects in each group between LFPR and positive CS at individual nodes, LFPR and positive CS are positively correlated in 19 ICs in HCs and 3 ICs in SZs (P < 0.05, FDR corrected).
3.4 Rich club
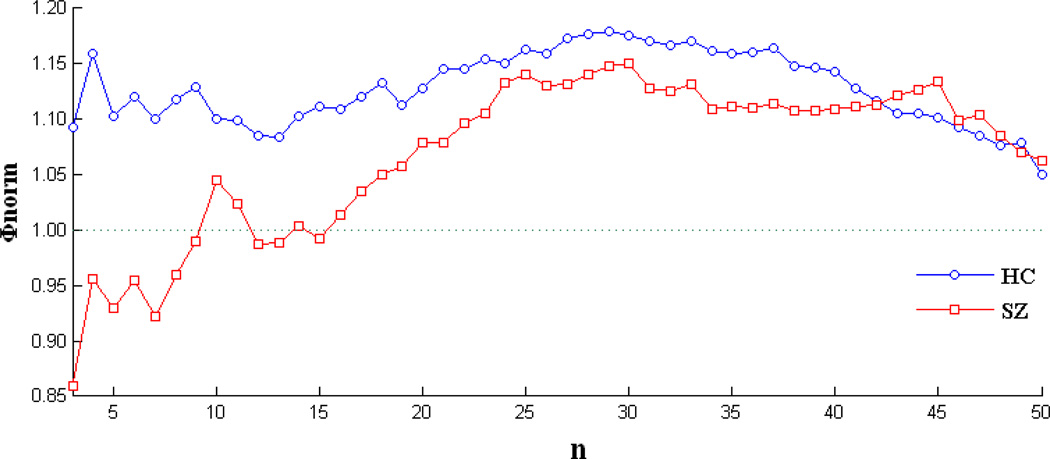
Figure 6 shows the normalized rich club coefficient curve Φnorm for the weighted group averaged graphs. The figure shows rich club organization (Φnorm > 1) over a range of n in both HCs (3 – 50) and SZs (10 – 11, 16 – 50). However, HCs showing higher Φnorm (HCs: 1.128 ± 0.033; SZs: 1.068 ± 0.071; two sample t-test: P < 1.0 × 10⁻⁶, df = 94).
Figure 6.
Normalized rich club coefficient (Φnorm) as a function of n (top n nodes with high positive CS) for the group mean weighted graphs. HCs showing higher Φnorm over the range 3 – 50 (HCs:1.128 ± 0.033; SZs: 1.068 ± 0.071; two sample t-test: P < 1.0 × 10⁻⁶, df = 94).
4. Discussion
In the present study, relationship between LFPR and CSs, as well as rich club coefficient of resting state brain networks were estimated in HCs and SZs. Firstly, R-fMRI data of 24 HCs and 24 SZs were decomposed into spatially independent brain components by group ICA. 53 × 53 weighted brain graphs were built based on the correlations between ICA time courses. LFPR, negative CS, and positive CS of the 53 ICs of interest were assessed. Then the correlations between LFPR and CSs were examined. Some individual ICs showing statistically higher LFPR in HCs compared with SZs which is in line with previous study (Garrity et al., 2007). Most of the connections in the weighted brain graphs are positive (see Figure 2). Although the group difference is not statistically significant, most of the ICs showing higher positive CS in HCs (see Figure 3). That is consistent with previous studies which also found decreased connectivity in SZs (Bassett et al., 2012; Lynall et al., 2010; Skudlarski et al., 2010; Zalesky et al., 2011). LFPR is significantly positively correlated with positive CS in HCs while this relationship is disrupted in SZs which may play a role in the altered rich club parameter in SZs. The findings supply new evidence for the deficits of resting state brain network in schizophrenia.
It is notable that LFPR is positively correlated with positive CS in HCs which suggests that the low frequency oscillations from an individual brain component are related to the functional connectivity to the rest of the brain components. This finding supports the hypothesis that correlation of low frequency fluctuations during resting state is a manifestation of functional connectivity in human brain (Cordes et al., 2001; Cordes et al., 2000). Importantly, the correlation between LFPR and positive CS is decreased in SZs which is consistent with our hypothesis.
Rich club analysis demonstrates that the brain graph is showing rich club organization in both HCs and SZs in a range of n (top n nodes with high positive CS, see Figure 6) which means high-CS nodes are more densely connected among themselves than nodes of a lower CS in both groups. However, the normalized rich club coefficient is significantly decreased in SZs. The rich-club regions play a central role in overall brain communication (van den Heuvel et al., 2012; van den Heuvel and Sporns, 2011). In HCs, LFPR is correlated with positive CS which suggests high-CS nodes have relatively higher LFPR than other nodes. Hence, the brain graph in HCs is dominated by nodes with more low frequency BOLD fluctuations which is consistent with the hypothesis that the low frequency oscillations of BOLD signals are underlying neuronal activation whereas high frequency oscillations are contaminated by artifacts including those of respiratory and cardiac origin (Fornito et al., 2011; van den Heuvel and Hulshoff Pol, 2010). Whereas, in SZs, the association between LFPR and positive CS is decreased, which implies the high-CS nodes in SZs are more severely contaminated by noise, hence they less connected to each other than in HCs. Thus, the disrupted correlation between LFPR and positive CS in SZs may be one cause of the altered rich club parameter. The observations of this study suggest that schizophrenia affects the rich club organization in resting state brain and increase our knowledge about the disordered intrinsic brain graph in this disease.
There are several methodological limitations to this study. Our approach uses visual inspection to choose ICs; although this process is relatively quick, as we only need inspect the group average components and followed by the use of LFPR which is a very good differentiator of artifactual and interesting components (Allen et al., 2011). Also, it has been argued that group-mean graphs often do not adequately represent the topological organization of the individuals (Simpson et al., 2012). To test this, two sample t-tests were performed both on the correlation values between LFPR and positive CS and the normalized rich club coefficients of the individual graphs. SZs showed decreased correlation between LFPR and positive CS, with the group difference being marginally significant (HCs: 0.3248 ± 0.1668; SZs: 0.2120 ± 0.2613; P = 0.0812). For the normalized rich club parameter, HCs show higher values over a range of n (on n = 30, 31,…41; P < 0.05 uncorrected). The directions of group differences are consistent with the results of group-mean graphs. Another concern regards the potential of spatial smoothing to influence the results. Spatial smoothing may introduce spurious short-range connections in high-resolution networks where individual voxels represent distinct nodes (van den Heuvel et al., 2008; Zalesky et al., 2011). However, in this study, intrinsic networks represent graph nodes and reduce resolution of the graph; the connectivity is computed by cross-correlating time courses of ICA components. Hence we are less concerned about spurious connections related to smoothing. Finally, all patients were taking psychotropic medications, thus drug impact cannot be disambiguated.
5. Conclusions
To our knowledge, this is the first study to explore the relationship between LFPR and CS, as well as rich club parameter of resting state brain graphs of brain components in both HCs and SZs using R-fMRI data. Several ICs showing significantly decreased LFPR in SZs. Most interestingly, the correlation between LFPR and positive CS is decreased in SZs compared with HCs, which may be one cause of the altered rich club organization in SZs. The findings support the hypothesis that low frequency BOLD signals are important in R-fMRI, increase our knowledge about the disordered intrinsic brain graph in SZs and provide a new framework to explore the rich club organization of brain graphs in which to discuss the neuromechanisms of this mental illness.
Acknowledgements
Role of the funding source
Funding for this study is provided by the National Institutes of Health (NIH) grants (R01 EB000840 and 5P20RR021938 PI: Calhoun; R37 MH43775 PI: Pearlson; and R01 MH072681-01 PI: Kiehl). The NIH has no further role in the study design, subject recruitment, data acquisition or analysis. The NIH is also not involved in writing of the report or the decision to submit this article for publication.
Footnotes
Publisher's Disclaimer: This is a PDF file of an unedited manuscript that has been accepted for publication. As a service to our customers we are providing this early version of the manuscript. The manuscript will undergo copyediting, typesetting, and review of the resulting proof before it is published in its final citable form. Please note that during the production process errors may be discovered which could affect the content, and all legal disclaimers that apply to the journal pertain.
Contributors
Qingbao Yu and Vince Calhoun designed the study; Kent Kiehl, Godfrey Pearlson and Vince Calhoun contributed to data acquisition; Qingbao Yu, Jing Sui, Jingyu Liu and Sergey Plis contributed to data analysis; all authors wrote the manuscript.
Conflict of interest
All authors declare that they have no conflicts of interest.
References
- Abou-Elseoud A, Starck T, Remes J, Nikkinen J, Tervonen O, Kiviniemi V. The effect of model order selection in group PICA. Hum Brain Mapp. 2010;31(8):1207–1216. doi: 10.1002/hbm.20929. [DOI] [PMC free article] [PubMed] [Google Scholar]
- Allen EA, Erhardt EB, Damaraju E, Gruner W, Segall JM, Silva RF, Havlicek M, Rachakonda S, Fries J, Kalyanam R, Michael AM, Caprihan A, Turner JA, Eichele T, Adelsheim S, Bryan AD, Bustillo J, Clark VP, Feldstein Ewing SW, Filbey F, Ford CC, Hutchison K, Jung RE, Kiehl KA, Kodituwakku P, Komesu YM, Mayer AR, Pearlson GD, Phillips JP, Sadek JR, Stevens M, Teuscher U, Thoma RJ, Calhoun VD. A baseline for the multivariate comparison of restingstate networks. Front Syst Neurosci. 2011;5:2. doi: 10.3389/fnsys.2011.00002. [DOI] [PMC free article] [PubMed] [Google Scholar]
- American, A.P.A. Diagnostic and Statistical Manual of Mental Disorders. 4th ed, Text Revision. Washington, DC: American Psychiatric Association; 2000. [Google Scholar]
- Auer DP. Spontaneous low-frequency blood oxygenation level-dependent fluctuations and functional connectivity analysis of the 'resting' brain. Magn Reson Imaging. 2008;26(7):1055–1064. doi: 10.1016/j.mri.2008.05.008. [DOI] [PubMed] [Google Scholar]
- Bassett DS, Nelson BG, Mueller BA, Camchong J, Lim KO. Altered resting state complexity in schizophrenia. Neuroimage. 2012;59(3):2196–2207. doi: 10.1016/j.neuroimage.2011.10.002. [DOI] [PMC free article] [PubMed] [Google Scholar]
- Bell AJ, Sejnowski TJ. An information-maximization approach to blind separation and blind deconvolution. Neural Comput. 1995;7(6):1129–1159. doi: 10.1162/neco.1995.7.6.1129. [DOI] [PubMed] [Google Scholar]
- Benjamini Y, Hochberg Y. Controlling the false discovery rate: a practical and powerful approach to multiple testing. Journal of the Royal Statistical Society, Series B (Methodological) 1995;57(1):289–300. [Google Scholar]
- Biswal B, Yetkin FZ, Haughton VM, Hyde JS. Functional connectivity in the motor cortex of resting human brain using echo-planar MRI. Magn Reson Med. 1995;34(4):537–541. doi: 10.1002/mrm.1910340409. [DOI] [PubMed] [Google Scholar]
- Calhoun VD, Adali T, Pearlson GD, Pekar JJ. A method for making group inferences from functional MRI data using independent component analysis. Hum Brain Mapp. 2001;14(3):140–151. doi: 10.1002/hbm.1048. [DOI] [PMC free article] [PubMed] [Google Scholar]
- Calhoun VD, Liu J, Adali T. A review of group ICA for fMRI data and ICA for joint inference of imaging, genetic, and ERP data. Neuroimage. 2009;45(1 Suppl):S163–S172. doi: 10.1016/j.neuroimage.2008.10.057. [DOI] [PMC free article] [PubMed] [Google Scholar]
- Colizza V, Flammini A, Serrano MA, Vespignani A. Detecting rich-club ordering in complex networks. Nat Phys. 2006;2(2):110–115. [Google Scholar]
- Cordes D, Haughton VM, Arfanakis K, Carew JD, Turski PA, Moritz CH, Quigley MA, Meyerand ME. Frequencies contributing to functional connectivity in the cerebral cortex in"resting-state" data. AJNR Am J Neuroradiol. 2001;22(7):1326–1333. [PMC free article] [PubMed] [Google Scholar]
- Cordes D, Haughton VM, Arfanakis K, Wendt GJ, Turski PA, Moritz CH, Quigley MA, Meyerand ME. Mapping functionally related regions of brain with functional connectivity MR imaging. AJNR Am J Neuroradiol. 2000;21(9):1636–1644. [PMC free article] [PubMed] [Google Scholar]
- Damoiseaux JS, Rombouts SA, Barkhof F, Scheltens P, Stam CJ, Smith SM, Beckmann CF. Consistent resting-state networks across healthy subjects. Proc Natl Acad Sci U S A. 2006;103(37):13848–13853. doi: 10.1073/pnas.0601417103. [DOI] [PMC free article] [PubMed] [Google Scholar]
- Erhardt EB, Rachakonda S, Bedrick EJ, Allen EA, Adali T, Calhoun VD. Comparison of multi-subject ICA methods for analysis of fMRI data. Hum Brain Mapp. 2011;32(12):2075–2095. doi: 10.1002/hbm.21170. [DOI] [PMC free article] [PubMed] [Google Scholar]
- First MB, Spitzer RL, Gibbon M, Williams JBW. Structured Clinical Interview for DSM-IV Axis I Disorders-Patient Edition (SCID-I/P, Version 2.0) New York: New York State Psychiatry Institute; 1995. [Google Scholar]
- Fornito A, Zalesky A, Bassett DS, Meunier D, Ellison-Wright I, Yucel M, Wood SJ, Shaw K, O'Connor J, Nertney D, Mowry BJ, Pantelis C, Bullmore ET. Genetic influences on cost-efficient organization of human cortical functional networks. The Journal of neuroscience : the official journal of the Society for Neuroscience. 2011;31(9):3261–3270. doi: 10.1523/JNEUROSCI.4858-10.2011. [DOI] [PMC free article] [PubMed] [Google Scholar]
- Freire L, Roche A, Mangin JF. What is the best similarity measure for motion correction in fMRI time series? IEEE Trans Med Imaging. 2002;21(5):470–484. doi: 10.1109/TMI.2002.1009383. [DOI] [PubMed] [Google Scholar]
- Friston KJ, Frith CD. Schizophrenia: a disconnection syndrome? Clin Neurosci. 1995;3(2):89–97. [PubMed] [Google Scholar]
- Garrity AG, Pearlson GD, McKiernan K, Lloyd D, Kiehl KA, Calhoun VD. Aberrant"default mode" functional connectivity in schizophrenia. Am J Psychiatry. 2007;164(3):450–457. doi: 10.1176/ajp.2007.164.3.450. [DOI] [PubMed] [Google Scholar]
- Hoptman MJ, Zuo XN, Butler PD, Javitt DC, D'Angelo D, Mauro CJ, Milham MP. Amplitude of low-frequency oscillations in schizophrenia: a resting state fMRI study. Schizophr Res. 2010;117(1):13–20. doi: 10.1016/j.schres.2009.09.030. [DOI] [PMC free article] [PubMed] [Google Scholar]
- Kay SR, Fiszbein A, Opler LA. The positive and negative syndrome scale (PANSS) for schizophrenia. Schizophr Bull. 1987;13(2):261–276. doi: 10.1093/schbul/13.2.261. [DOI] [PubMed] [Google Scholar]
- Kiviniemi V, Starck T, Remes J, Long X, Nikkinen J, Haapea M, Veijola J, Moilanen I, Isohanni M, Zang YF, Tervonen O. Functional segmentation of the brain cortex using high model order group PICA. Hum Brain Mapp. 2009;30(12):3865–3886. doi: 10.1002/hbm.20813. [DOI] [PMC free article] [PubMed] [Google Scholar]
- Liang M, Zhou Y, Jiang T, Liu Z, Tian L, Liu H, Hao Y. Widespread functional disconnectivity in schizophrenia with resting-state functional magnetic resonance imaging. Neuroreport. 2006;17(2):209–213. doi: 10.1097/01.wnr.0000198434.06518.b8. [DOI] [PubMed] [Google Scholar]
- Liu Y, Liang M, Zhou Y, He Y, Hao Y, Song M, Yu C, Liu H, Liu Z, Jiang T. Disrupted small-world networks in schizophrenia. Brain. 2008;131(Pt 4):945–961. doi: 10.1093/brain/awn018. [DOI] [PubMed] [Google Scholar]
- Lynall ME, Bassett DS, Kerwin R, McKenna PJ, Kitzbichler M, Muller U, Bullmore E. Functional connectivity and brain networks in schizophrenia. J Neurosci. 2010;30(28):9477–9487. doi: 10.1523/JNEUROSCI.0333-10.2010. [DOI] [PMC free article] [PubMed] [Google Scholar]
- Marin O. Interneuron dysfunction in psychiatric disorders. Nat Rev Neurosci. 2012;13(2):107–120. doi: 10.1038/nrn3155. [DOI] [PubMed] [Google Scholar]
- McAuley JJ, Costa LDF, Caetano TS. Rich-club phenomenon across complex network hierarchies. Appl Phys Lett. 2007;91(8) [Google Scholar]
- Opsahl T, Colizza V, Panzarasa P, Ramasco JJ. Prominence and Control: The Weighted Rich-Club Effect. Physical Review Letters. 2008;101(16) doi: 10.1103/PhysRevLett.101.168702. [DOI] [PubMed] [Google Scholar]
- Pettersson-Yeo W, Allen P, Benetti S, McGuire P, Mechelli A. Dysconnectivity in schizophrenia: where are we now? Neurosci Biobehav Rev. 2011;35(5):1110–1124. doi: 10.1016/j.neubiorev.2010.11.004. [DOI] [PubMed] [Google Scholar]
- Robinson S, Basso G, Soldati N, Sailer U, Jovicich J, Bruzzone L, Kryspin-Exner I, Bauer H, Moser E. A resting state network in the motor control circuit of the basal ganglia. BMC Neurosci. 2009;10:137. doi: 10.1186/1471-2202-10-137. [DOI] [PMC free article] [PubMed] [Google Scholar]
- Rubinov M, Sporns O. Complex network measures of brain connectivity: uses and interpretations. Neuroimage. 2010;52(3):1059–1069. doi: 10.1016/j.neuroimage.2009.10.003. [DOI] [PubMed] [Google Scholar]
- Rubinov M, Sporns O. Weight-conserving characterization of complex functional brain networks. Neuroimage. 2011;56(4):2068–2079. doi: 10.1016/j.neuroimage.2011.03.069. [DOI] [PubMed] [Google Scholar]
- Simpson SL, Moussa MN, Laurienti PJ. An exponential random graph modeling approach to creating group-based representative whole-brain connectivity networks. Neuroimage. 2012;60(2):1117–1126. doi: 10.1016/j.neuroimage.2012.01.071. [DOI] [PMC free article] [PubMed] [Google Scholar]
- Skudlarski P, Jagannathan K, Anderson K, Stevens MC, Calhoun VD, Skudlarska BA, Pearlson G. Brain connectivity is not only lower but different in schizophrenia: a combined anatomical and functional approach. Biol Psychiat. 2010;68(1):61–69. doi: 10.1016/j.biopsych.2010.03.035. [DOI] [PMC free article] [PubMed] [Google Scholar]
- Smith SM, Fox PT, Miller KL, Glahn DC, Fox PM, Mackay CE, Filippini N, Watkins KE, Toro R, Laird AR, Beckmann CF. Correspondence of the brain's functional architecture during activation and rest. Proc Natl Acad Sci U S A. 2009;106(31):13040–13045. doi: 10.1073/pnas.0905267106. [DOI] [PMC free article] [PubMed] [Google Scholar]
- Stephan KE, Baldeweg T, Friston KJ. Synaptic plasticity and dysconnection in schizophrenia. Biol Psychiatry. 2006;59(10):929–939. doi: 10.1016/j.biopsych.2005.10.005. [DOI] [PubMed] [Google Scholar]
- van den Heuvel MP, Hulshoff Pol HE. Exploring the brain network: a review on resting-state fMRI functional connectivity. Eur Neuropsychopharmacol. 2010;20(8):519–534. doi: 10.1016/j.euroneuro.2010.03.008. [DOI] [PubMed] [Google Scholar]
- van den Heuvel MP, Kahn RS, Goni J, Sporns O. High-cost, high-capacity backbone for global brain communication. P Natl Acad Sci USA. 2012;109(28):11372–11377. doi: 10.1073/pnas.1203593109. [DOI] [PMC free article] [PubMed] [Google Scholar]
- van den Heuvel MP, Sporns O. Rich-club organization of the human connectome. The Journal of neuroscience : the official journal of the Society for Neuroscience. 2011;31(44):15775–15786. doi: 10.1523/JNEUROSCI.3539-11.2011. [DOI] [PMC free article] [PubMed] [Google Scholar]
- van den Heuvel MP, Stam CJ, Boersma M, Hulshoff Pol HE. Small-world and scale-free organization of voxel-based resting-state functional connectivity in the human brain. Neuroimage. 2008;43(3):528–539. doi: 10.1016/j.neuroimage.2008.08.010. [DOI] [PubMed] [Google Scholar]
- Volkow ND, Wolf AP, Brodie JD, Cancro R, Overall JE, Rhoades H, Van Gelder P. Brain interactions in chronic schizophrenics under resting and activation conditions. Schizophrenia research. 1988;1(1):47–53. doi: 10.1016/0920-9964(88)90039-4. [DOI] [PubMed] [Google Scholar]
- Weinberger DR, Berman KF, Suddath R, Torrey EF. Evidence of dysfunction of a prefrontal-limbic network in schizophrenia: a magnetic resonance imaging and regional cerebral blood flow study of discordant monozygotic twins. The American journal of psychiatry. 1992;149(7):890–897. doi: 10.1176/ajp.149.7.890. [DOI] [PubMed] [Google Scholar]
- Yu Q, Plis SM, Erhardt EB, Allen EA, Sui J, Kiehl KA, Pearlson G, Calhoun VD. Modular Organization of Functional Network Connectivity in Healthy Controls and Patients with Schizophrenia during the Resting State. Front Syst Neurosci. 2012;5:103. doi: 10.3389/fnsys.2011.00103. [DOI] [PMC free article] [PubMed] [Google Scholar]
- Yu Q, Sui J, Rachakonda S, He H, Gruner W, Pearlson G, Kiehl KA, Calhoun VD. Altered topological properties of functional network connectivity in schizophrenia during resting state: a small-world brain network study. PLoS One. 2011;6(9):e25423. doi: 10.1371/journal.pone.0025423. [DOI] [PMC free article] [PubMed] [Google Scholar]
- Zalesky A, Fornito A, Bullmore E. On the use of correlation as a measure of network connectivity. Neuroimage. 2012;60(4):2096–2106. doi: 10.1016/j.neuroimage.2012.02.001. [DOI] [PubMed] [Google Scholar]
- Zalesky A, Fornito A, Egan GF, Pantelis C, Bullmore ET. The relationship between regional and inter-regional functional connectivity deficits in schizophrenia. Human brain mapping. 2011 doi: 10.1002/hbm.21379. [DOI] [PMC free article] [PubMed] [Google Scholar]
- Zuo XN, Ehmke R, Mennes M, Imperati D, Castellanos FX, Sporns O, Milham MP. Network Centrality in the Human Functional Connectome. Cereb Cortex. doi: 10.1093/cercor/bhr269. In Press. [DOI] [PubMed] [Google Scholar]


