

Abstract
Epigenetic alterations such as aberrant DNA methylation and histone modifications contribute substantially to both the cause and maintenance of drug resistance. These epigenetic changes lead to silencing of tumor suppressor genes involved in key DNA damage-response pathways, making drug-resistant cancer cells nonresponsive to conventional anticancer drug therapies. Our hypothesis is that treating drug-resistant cells with epigenetic drugs could restore the sensitivity to anticancer drugs by reactivating previously silenced genes. To test our hypothesis, we used drug-resistant breast cancer cells (MCF-7/ADR) and two epigenetic drugs that act via different mechanisms—5-aza-2′ deoxycytidine (Decitabine, DAC), a demethylating agent and suberoylanilide hydroxamic acid (SAHA), a histone deacetylase inhibitor—in combination with doxorubicin. We show that the sequential treatment of resistant cells, first with an epigenetic drug (DAC), and then with doxorubicin, induces a highly synergistic effect, thus reducing the IC50 of doxorubicin by several thousand folds. The sequential treatment caused over 90% resistant cells to undergo G2/M cell cycle arrest, determined to be due to upregulation of p21WAF1/CIP1 expression, which is responsible for cell-cycle regulation. The induction of p21WAF1/CIP1 correlated well with the depletion of DNA methyltransferase1 (DNMT1), an enzyme that promotes methylation of DNA, suggesting that the p21WAF1/CIP1 gene may have been methylated and hence is inactive in MCF-7/ADR cells. Microarray analysis shows expression of several tumor suppressor genes and downregulation of tumor promoter genes, particularly in sequentially treated resistant cells. Sequential treatment was found to be significantly more effective than simultaneous treatment, and DAC was more effective than SAHA in overcoming doxorubicin resistance. Synergistic effect with sequential treatment was also seen in drug-sensitive breast cancer cells, but the effect was significantly more pronounced in resistant cells. In conclusion, the sequential treatment of an epigenetic drug in combination with doxorubicin induces a highly synergistic effect that overcomes doxorubicin resistance in breast cancer cells.
Keywords: Epigenetic drugs, Drug resistance, Breast cancer, Combination therapy, Cell-cycle analysis, Gene expression
INTRODUCTION
Epigenetic aberrations play a crucial role in cancer initiation and progression.1, 2 The most common epigenetic alterations in cancer are DNA methylation and histone modifications.3, 4 These epigenetic changes lead to silencing of tumor suppressor genes involved in key DNA damage-response pathways, such as cell-cycle control, apoptosis and DNA repair.5, 6 Epigenetic silencing of genes influences tumorigenesis and tumor response to drug therapy and is also the main cause of drug resistance.7, 8 The prevalence of epigenetic gene silencing in cancer initiation and drug resistance makes this characteristic an attractive target for epigenetic drug therapy.3, 9 Since epigenetic modifications do not mutate the DNA sequence of a gene;2 strategies to reverse epigenetic abnormalities are considered useful in reversing drug resistance in cancer therapy.
Anthracyclines (doxorubicin, daunorubicin, epirubicin, etc.) are the most important class of anticancer drugs used in treating breast cancer patients.10, 11 However, the therapeutic advantages of these drugs are significantly impaired by potentially life-threatening cardiotoxicity and other lethal side effects.12 Cardiotoxicity caused by doxorubicin, the most commonly used drug in breast cancer therapy, is dose dependent and cumulative;13 and the repeated administration of doxorubicin results in the selection of drug-resistant cells within the tumor.14 Once cancer cells develop drug resistance, these drugs are rendered ineffective at the usual tolerable doses. These concerns have led investigators to explore new approaches to reducing doses of doxorubicin while enhancing its efficacy.
One strategy currently being explored is to formulate doxorubicin in nanocarriers that can alter the pharmacodynamics of drug distribution to reduce its accumulation in the heart.15 Doxil, a liposomal formulation of doxorubicin used to treat breast cancer patients, is an example of such an approach. However, Doxil is not effective in treating drug-resistant breast cancer because of the impaired endocytic function that inhibits effective intracellular drug delivery.16 Several actively targeted nanocarrier systems are being investigated to enhance drug uptake and retention in tumor tissue to address the above problem of drug delivery and efficacy using nanocarrier systems.17
Resistance against doxorubicin at the cellular level might arise due to epigenetic abnormalities of genes, which results in alteration of the drug's target and response. Doxorubicin mediates its cytotoxicity by inhibiting topoisomerase II (Topo II), a nuclear enzyme essential for DNA replication.18 Topo II levels are reported to be lower in doxorubicin-resistant tumors from breast cancer patients, unlike drug-sensitive tumors, which express high levels of the enzyme.19 It has been shown that this enzyme is methylation silenced in drug-resistant cells to gain a survival advantage.20, 21 Methylation silencing of genes also limits intracellular drug levels by increasing drug efflux and decreasing drug influx.22–24 One or all of these events lead to impaired drug delivery and hence efficacy in resistant cells.
Therapeutic strategies without addressing the root cause of drug resistance in breast cancer cells, (i.e., epigenetic dysregulation) may not be effective. Certain compounds, such as 5-aza-2′-deoxycytidine (DAC), a DNA hypomethylating agent, and suberoylanilide hydroxamic acid (SAHA), a histone deacetylase inhibitor, can reactivate the expression of transcriptionally silenced genes.25, 26 By reversing the hypermethylation state of DNA, DAC can reduce DNA methyl transferase (DNMT) activity and the expression of multidrug resistance-1 (mdr1) efflux protein, thus enhancing intracellular doxorubicin levels.22, 23 Doxorubicin sensitivity could also depend on the state of the cell's chromatin. Highly condensed chromatin, a form observed in many cancers, restricts the toxicity of doxorubicin by limiting the accessibility of both the drug and its substrate (Topo II) to DNA.27
Our hypothesis is that treating drug-resistant cells with epigenetic drugs could restore sensitivity to doxorubicin by reactivating previously silenced genes and could thereby overcome drug resistance. Here we show that the sequential treatment of resistant cells, first with epigenetic drug (DAC or SAHA) followed by doxorubicin, demonstrates a highly synergistic effect in overcoming drug resistance in breast cancer cells.
EXPERIMENTAL SECTION
Materials
5-aza-2′-deoxycytidine (DAC, generic name decitabine) and suberoylanilide hydroxamic acid (SAHA, generic name vorinostat) were purchased from Sigma-Aldrich Chemical Company (St. Louis, MO). Doxorubicin hydrochloride was purchased from Drug Source Co. LLC (Westchester, IL). Cell culture media, DPBS, penicillin and streptomycin were purchased from the Central Cell Services' Media Laboratory of our institution. MTS reagent was purchased from Promega (Madison, WI).
Cell Culture
MCF-7/ADR cells were maintained in Dulbecco's modified Eagle's medium (DMEM) supplemented with 15% fetal bovine serum (Gibco BRL, Grand Island, NY) and 100 μg/mL penicillin G and 100 μg/mL streptomycin. MCF-7, MDA-MB 231 and BT-459 were grown in DMEM supplemented with 10% fetal bovine serum and antibiotics at 37 °C in a humidified and 5% CO2 atmosphere. To maintain drug resistance, MCF-7/ADR cells were cultured in a medium containing 100 ng/mL of doxorubicin. Resistant cells were maintained in drug-free media in the last two passages prior to any experiments. Sensitive cell lines were cultured in drug-free cell culture media. Culturing conditions for resistant cells were optimized; resistant cells require a higher serum concentration than sensitive cells for proper cell growth.
Cell Viability
Cell viability following different treatments was determined using a standard MTS assay (CellTiter 96 Aqueous, Promega, Madison, WI). In brief, to each well, 20 μL of reagent was added, and the plates were incubated for 2 h at 37 °C in cell culture incubator. Color intensity was measured at 490 nm using a microplate reader (Bio-Tek Instrument, Winooski, VT). The effect of the drug on cell proliferation was calculated as percentage growth of cells relative to respective controls.
Sequential versus Simultaneous Treatments
We first tested the efficacy of pretreatment of DAC and SAHA in MCF-7/ADR in time- and dose-response studies for each drug's ability to sensitize cells to the cytotoxic effect of doxorubicin. For this step, drug-resistant cells were seeded at 3,000 cells per well/0.1 mL culture medium in 96-well plates (BD Biosciences, San Jose, CA). At 24 h post seeding, cells were treated with different concentrations of DAC for 24 h or 48 h; then cells were washed with 1× DPBS prior to measuring cell viability using an MTS assay.
The cells pretreated with DAC or SAHA at different doses were tested with doxorubicin in a dose-response study. For this, the DAC- or SAHA-treated cells were incubated with different doses of doxorubicin for 48 h. Cells were washed with 1× DPBS, and then replaced with drug-free cell culture media and incubated for an additional 48 h.
To determine the efficacy of simultaneous treatment of DAC and doxorubicin vs. sequential treatment as described above, cells were treated with DAC at the dose (50 ng/mL) that demonstrated a highly synergistic effect in sequential treatment; that dose was mixed with different doses of doxorubicin. Cells were incubated with the combination of DAC and doxorubicin for 72 h and cell viability was determined using MTS assay as mentioned above. Identical protocol was followed for sequential treatment of SAHA in combination with doxorubicin, except that SAHA was incubated with cells for a shorter time than with DAC. This step was necessary because with long-term treatment, SAHA is known to induce cell-cycle arrest in cancer cells. Doxorubicin requires dividing cells to execute its cytotoxicity, and hence it may not be effective in cells that are in the cell-cycle arrest phase. To find an optimal time point for SAHA pretreatment and to increase the synergy between SAHA and doxorubicin, cells were incubated with SAHA for different time points. Doses of DAC or SAHA for pretreatment were selected in such a way that they did not have their own significant antiproliferative effect at that concentration.
In addition to the studies in drug-resistant cells, the efficacy of sequential therapy of DAC and doxorubicin was tested in drug sensitive breast cancer cells (MCF-7, MDA-MB 231 and BT-459). Since DAC at its half the IC50 dose (50 ng/mL) showed synergy with all the doses of doxorubicin tested in resistant cells, sensitive cells were first treated with the above dose of DAC followed by different doses of doxorubicin.
Calculation of Combination Index
The synergistic or antagonistic effects of the various drug combinations (DAC + doxorubicin or SAHA + doxorubicin) and the treatment protocols were analyzed using the CalcuSyn software program (Biosoft, Ferguson, MO). The MTS data from the above experiments were entered into the software to calculate the combination index value (CI). From the CI values, the synergistic action of drugs can be analyzed. A CI of 1 indicates an additive effect, CI <1, a synergistic effect, and CI >1, antagonistic activity.28
Cell-Cycle Analysis
To understand the mechanism of efficacy of the combination treatments, cells were analyzed for cell cycle via flow cytometry using the optimized protocol from the above set of experiments. For this, cells were seeded at 300,000 cells/3 mL culture medium/well in 6-well plates (BD Biosciences) and allowed to attach for 24 h. Cells following different treatments were trypsinized and centrifuged at 1,300 rpm (Sorvall Legend RT centrifuge, Thermo Electron Corp., Waltham, MA) for 3 min at 4 °C. The cell pellet was washed twice with ice cold 1× DPBS (pH 7.4) and then resuspended in propidium iodide-(PI) solution (12.5 mg PI, 250 mg sodium-citrate and 250 μL Triton X-100 in 250 mL of water). Cells were then incubated in an ice bucket, kept in a cold room for 2 h, and the DNA content was determined by flow cytometry using a FACScan flow cytometer (Becton Dickinson, San Jose, CA). ModFit LT software (Verity Software House, Inc., Topsham, ME) was used for data analysis.
Microarray Analysis and Validation of p21 Expression
Gene array was carried out to determine the genes that may have been activated and involved in G2/M arrest following treatment of resistant cells with DAC alone or sequentially DAC (50 ng/mL) and doxorubicin (1 ng/mL). Briefly, cells were seeded and treated as mentioned above for the flow cytometry protocol. Following treatment, total RNA was isolated from cells using the SV Total RNA Isolation System (Promega, Madison, WI). The isolated RNA was stored at −80 °C in nuclease free water at the concentration of 100 ng/μL until used for gene array analysis. Approximately 5 μg of total RNA was subjected to gene expression array study using an Illumina human 6v2 chip (Illumina, Inc. San Diego, CA). The array-hybridization and scanning of array images were performed at the Cleveland Clinic Genomics Core.
Statistical and functional analyses of gene expression data were performed by the Cleveland Clinic Bioinformatics Core facility. The raw gene expression datasets were log2 transformed and processed with background correction and quantile normalization. Quality control analyses were applied to detect the outlier samples. No outliers were observed. The expression signals with an Illumina detection threshold < 0.05 across all the samples were used. To detect changes in expression between sensitive and resistant cells at two time points, the differential P value (Diff Pval) and false discovery rate (FDR) p value29 were calculated using the Illumina custom error model (Genome Studio Gene Expression Module v3.3 software, Illumina Inc.).
To show the differentially expressed genes that satisfy both the statistical (negative log p-values) and biological (fold change) criteria, volcano plots were generated using R statistical package. Hierarchical clustering and heat maps were also generated using the same statistical package. Genes that satisfied the FDR p-value threshold of < 0.05 or raw p-value of <0.001 and absolute fold change threshold of 2.0 were identified as significant for the functional pathway and network analyses.
Functional profiling of differentially affected biological processes, functions, and pathways in resistant cells treated with DAC or sequentially with DAC followed by doxorubicin either for 48 h and 72 h were evaluated using a suite of publicly available tools (such as GO∷TermFinder, GO Term Mapper, Reactome) and commercial pathway analysis databases such as Ingenuity Pathway Analysis (IPA., from Ingenuity Systems, Inc., Redwood city, CA) and Metacore™ (GeneGo, Inc., St. Joseph, MI). Direct interaction network of genes was generated using Metacore™ analytical suite version 5.2 build 17389 (GeneGo, Inc.)30, 31
Quantitative polymerase chain reaction (qPCR) was carried out to validate p21 gene expression. Briefly, RNA isolated from cell treated with either drugs alone (DAC or doxorubicin) or in combination (DAC + doxorubicin) and untreated cells were converted into cDNA using Mo-MLV reverse transcriptase (Promega Inc., Madison, WI) according to manufacturers' instructions. Taqman expression primers (Applied Biosystems Inc., Carlsbad, CA) and ABI PRISM Sequence Detection Instrument 7700 (Applied Biosystems Inc.) were used for real-time reverse transcription-PCR (RT-PCR). Since housekeeping genes remain unaltered following DAC treatment in resistant cells (Supporting Information), the fold change in target genes was calculated about the human glyceraldehyde 3-phosphate dehydrogenase (GAPDH).
Western blot
Resistant cells were seeded (5 × 10⁶ cells/dish) in 100-cm2 cell culture dishes (BD Biosciences) and incubated for 24 h in CO2 incubator for attachment. Cells were treated as mentioned above for the flow cytometry protocol to analyze p21 expression. To determine the effect of DAC treatment on DNMT levels, cells were cultured in cell culture dishes as above and treated with DAC (50 ng/mL) for 1, 2, 3 or 5 days. Following treatment, cell lysates were prepared by lysing 1×10⁶ cells with RIPA buffer (Sigma-Aldrich) containing 1× protease inhibitor cocktail (Calbiochem, Gibbstown, NJ). Each cell lysate was centrifuged at 14,000 rpm for 15 min. Protein concentration in cell lysates was determined using bicinchoninic acid (BCA) assay kit (Pierce, Rockford, IL). About 20–40 μg proteins of cell lysates were electrophoresed through 13.5% SDS-polyacrylamide gel or 4–15 % linear precast polyacrylamide gradient gel (Bio-Rad Laboratories, Hercules, CA) and transferred to polyvinylidene difluoride (PVDF) membranes (GE Healthcare Biosciences, Piscataway, NJ). The blots were probed for mouse monoclonal p21 (Cell Signaling Technology, Inc., Danvers, MA), mouse monoclonal DNA methyltransferase1 (DNMT1; Abcam Inc., Cambridge, MA) and mouse monoclonal anti-actin (Sigma-Aldrich). For detection of bound antibody, PVDF membrane was incubated with horseradish-tagged goat anti-mouse antibody. After incubation, membrane was washed Tris-buffered saline with 0.5% Tween 20 (TBST) and stained with enhanced chemiluminescence (ECL) reagent or ECL plus reagent (GE Healthcare Biosciences, Piscataway, NJ) according to the manufacturer's protocol.
Statistical Analysis
Data are expressed as mean ± standard error of mean (s.e.m.). Statistical analyses were performed using Student's t test. Differences were considered significant for p ≤ 0.05.
RESULTS
Cytotoxic Effect of DAC in Combination with Doxorubicin
Doxorubicin demonstrated sigmoidal dose-dependent antiproliferative activity in both drug-resistant (MCF-7/ADR) and drug-sensitive (MCF-7) cells; however the IC50 dose of doxorubicin for resistant cells was significantly greater than for sensitive cells (7,385 ng/mL vs. 21 ng/mL; Table 1). Resistant cells treated with DAC showed a dose-response antiproliferative effect with IC50 = 108 ng/mL (Figure 1a); however, sensitive cells (MCF-7) did not show the same dose-dependent antiproliferative effect (Figure 2a). Pretreatment of resistant cells with DAC followed by with doxorubicin at all the combinations tested demonstrated a synergistic effect (Figure 1b and c). For example, resistant cells pretreated with half the IC50 dose of DAC (50 ng/mL) showed significant cytotoxicity following doxorubicin treatment; even a 1 ng/mL doxorubicin concentration caused over 50% cell death, which otherwise without pretreatment requires 7,385 ng/mL doxorubicin to induce 50% cell killing (Figure 1a; Table 1). This is an almost 7,000-fold enhancement in drug efficacy of doxorubicin based on IC50, with a highly synergistic effect (CI = 0.2; Table 1). We also demonstrated that the sequential treatment showed greater synergistic effect than simultaneous treatment, which was mostly an additive effect (Figure 1b and c).
Table 1.
Cytotoxicity of doxorubicin and combination treatment with decitabine and Doxorubicin.
| Human breast cancer cell line | IC50 (ng/mL) | Combination Index | |||
|---|---|---|---|---|---|
|
| |||||
| Dox | DAC + Dox | ||||
|
| |||||
| Sequential | Simultaneous | Sequential | Simultaneous | ||
| MCF-7/ADR | 7385.2 ± 698 | <1 | 1825.8 ± 62.8 | 0.2 ± 0.1 | 0.8 ± 0.1 |
| MCF-7 | 20.7 ± 0.8 | 7.4 ± 1.3 | ND | 0.8 ± 0.1 | ND |
| MDAMB -231 | 19.3 ± 1.9 | 4.4 ± 0.1 | ND | 0.3 ± 0.1 | ND |
| BT 459 | 102.2 ± 4.7 | 25.0 ± 5.5 | ND | 0.6 ± 0.1 | ND |
Data are expressed as mean ± s.e.m. from three individual experiments.
Decitabine concentration in sequential and simultaneous treatment = 50 ng/mL.
ND = Not done, Dox=Doxorubicin, DAC=Decitabine.
Figure 1. Synergistic effect of sequential treatment with DAC and Dox in drug-resistant breast cancer cells.
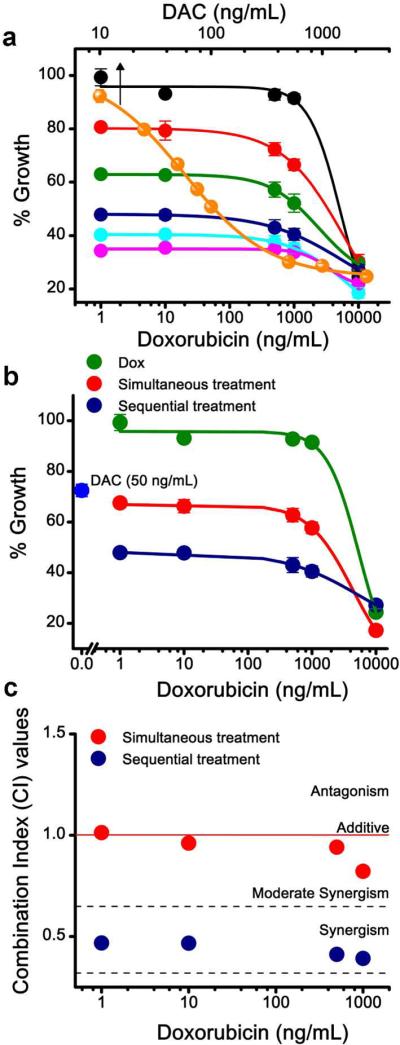
a) Effect of DAC alone treatment and sequential treatment with different doses of DAC and Dox on cell growth in resistant breast cancer (MCF-7/ADR) cells. For sequential treatment, resistant cells were treated with different doses of DAC for 24 h prior to treatment with different doses of Dox. Data points in Figure 1a: Black, Dox alone; Orange, DAC alone (arrow). Sequential treatments: Red; cytotoxicity of Dox at different doses in cells pretreated with DAC at 10 ng/mL; Green 25 ng/mL; Blue 50 ng/mL, Sky blue 75 ng/mL and Magenta 100 ng/mL. b) Comparison of sequential and simultaneous treatment of DAC and Dox in MCF-7/ADR cells. For sequential treatment, cells were pretreated with DAC (50 ng/mL) for 24 h and then with varying doses of Dox for 48 h. For simultaneous treatment, cells were treated with DAC (50 ng/mL) and different doses of Dox mixed together. c) Combination index (CI) for sequential and simultaneous treatments in MCF-7/ADR cells. CI Value: < 1 Synergistic; = 1 Additive; and > 1 Antagonistic. Data are expressed as mean ± s.e.m., n = 6. Error bars are within symbols for certain data points.
Figure 2. Synergistic effect of sequential treatment with DAC and Dox in drug-sensitive breast cancer cells.

Effect of sequential treatment in a) MDA-MB 231; b) BT-459; c) MCF-7. d) Combination index for sequentially treated drug-sensitive breast cancer cells. The sequential treatment DAC and Dox demonstrates the synergistic effect in MDA-MB 231 and MCF-7 cells, but additive to moderate synergism in BT-459 cells. Data are expressed as mean ± s.e.m., n = 6. For certain data points, error bars are smaller than symbol size, hence are not visible.
Sequential treatment using DAC and doxorubicin also showed a synergistic effect in sensitive breast cancer cells, but the extent of this synergistic effect was cell-line dependent. Based on the IC50 values, cytotoxicity of doxorubicin increased by 2.8 fold in MCF-7, 4.4 fold in MDA-MB-231 and 4 fold in BT-459 cells (Figure 2a–c). MCF-7 and MDA-MB 231 cells showed a highly synergistic effect at lower doses of doxorubicin, whereas BT-459 cells only showed this effect at higher doses of doxorubicin. The synergistic effect of sequential treatment was significantly more pronounced in resistant cells than in sensitive cells which is evident from relative CI values (Table 1).
Effect of SAHA and Doxorubicin
Unlike DAC treatment, which showed significantly higher sensitivity in resistant cells (MCF-7/ADR) than in sensitive cells (MCF-7), the response of SAHA treatment was almost similar in both the cell lines (Figure 3a). Although sequential treatment with SAHA and doxorubicin showed synergistic activity in both the resistant and sensitive cells, the synergistic effect of SAHA was highly dependent on pretreatment time. Resistant cells pretreated with SAHA for 4 and 8 hrs followed by doxorubicin showed a synergistic effect; in contrast, the cells pretreated with SAHA for 24 h showed a highly antagonistic effect (Figure 3b). This result is evident from the CI values, which showed reduced synergism in resistant cells with increased incubation time of SAHA with cells prior to doxorubicin treatment (Figure 3c). In sensitive cells, SAHA showed a synergistic effect at all the pretreatment times tested, but the synergic effect diminished with increased pretreatment time (Figure 3d and e).
Figure 3. Synergistic effect of sequential therapy with SAHA and Dox in drug-resistant and -sensitive breast cancer cells.

a) Dose-response effect of cytotoxicity of SAHA in drug-resistant (MCF-7/ADR) and -sensitive (MCF-7) cells. IC50 of SAHA in MCF-7/ADR and MCF-7 was 2 μM and 0.75 μM, respectively b) Effect of pretreatment time with SAHA on IC50 of Dox in MCF-7/ADR cells. Cells were pretreated with SAHA (0.5 μM) for different time points prior to Dox treatment. c) Combination index for sequential treatment with SAHA and Dox in MCF-7/ADR cells. c) Effect of pretreatment time with SAHA on IC50 of doxorubicin in MCF-7. Cells were pretreated with SAHA (0.25 μM) for different time points prior to Dox treatment e) Combination index for sequential treatment with SAHA and Dox in MCF-7 cells. Data are expressed as mean ± s.e.m., n = 6.
Cell-Cycle Analysis
Since cells pretreated with 50 ng/ml of DAC for 24 h and then with 1 ng/ml of doxorubicin showed a highly synergistic effect in sequential treatment in breast cancer cells, the above protocol was used to evaluate cells for cell-cycle analysis. Resistant (MCF-7/ADR) and sensitive cells (MCF-7) cells treated with doxorubicin alone at 1 ng/ml dose showed no significant effect on the number of cells going into the G2/M cell-cycle phase. However, treating cells with DAC alone increased the number of cells going into cell-cycle arrest phase with respect to control (Figure 4). Interestingly, DAC treatment had no effect on the number of resistant cells going into cell-cycle arrest phase with treatment time (48 h vs. 72 h; Figure 4b), whereas sensitive cells showed more cells going into the cell-cycle arrest phase with treatment time (Figure 4d). The sequential treatment of both resistant and sensitive cells caused over 90% cells going into the cell-cycle arrest phase, but the difference was that resistant cells required 72 h treatment time to reach this level of cell-cycle arrest phase, whereas sensitive cells required only 48 h treatment time (Figure 4b and d).
Figure 4. Cell-cycle analysis of sequentially treated drug-resistant and -sensitive cells.

a) Cell-cycle analysis of MCF-7/ADR cells treated with DAC alone, Dox alone, and sequentially treated, first with DAC for 24 h followed by with doxorubicin for 48 or 72 hrs. DAC alone or its combination with Dox showed an increase in cells arrested at the G2/M phase as compared to cells left untreated or treated with Dox alone. Dose of DAC= 50 ng/mL, dose of Dox = 1 ng/mL. b) Quantification of MCF-7/ADR cells arrested in the G2/M phase of the cell cycle using ModFit LT software. c) Cell-cycle analysis of MCF-7 cells treated with DAC alone, Dox alone and sequentially with DAC and Dox. d) Quantification of MCF-7 cells arrested at the G2/M phase using ModFit LT software. Representative histograms from three independent experiments.
Microarray Analysis
The results of microarray analysis showed marked changes in gene expression (≥ or ≤ 2 ×) in resistant cells following treatment with DAC alone or sequential with DAC and doxorubicin (Figure 5a–e). The number genes either overexpressed or repressed increased with increased treatment time (48 h vs. 72 h) (Fig 5a and b). Several genes including p19, p21 and PAK3, involved in cell-cycle regulation, were upregulated. In addition, transcription factors activating p21 expression such as EGR1, HES6 and SMAD3 were also upregulated following DAC treatment (Figure 5f, Table 2). Further, several tumor suppressor genes were activated following DAC treatment (Table 3). The pathway analysis shows direct and indirect interaction of transcription factors and tumor suppressor genes with p21 (Figure 5f). Treating cells with doxorubicin alone did not cause significant changes in gene expression pattern (Figure 5e). Further, treatment time (48 h vs. 72 h) influence differential gene expression in DAC alone or sequentially treated cells with DAC and doxorubicin (Figure 5). Most noticeable observation was that in sequential treated cells for 72 h, more number of tumor promoter genes were downregulated in comparison to cells treated with DAC alone (Table 4).
Figure 5. Microarray analysis of sequentially treated drug-resistant MCF-7/ADR cells.


The RNA isolated from cells sequentially treated with DAC (50 ng/mL) and doxorubicin (Dox) (1 ng/mL) or from its respective controls treated for 48 or 72 h were subjected to microarray analysis. Volcano plots for each contrast was computed using R statistical package. Volcano plots show significantly expressed genes vs. fold change of the pair-wise comparisons made between different groups. Negative log10 p value on y axis indicates the significance of each gene and the fold change (log base2) mean expression difference on x axis. The dashed and solid lines is the significance threshold for selecting the differentially expressed genes at FDR p of 0.05 and raw p value of 0.001. In each volcano plot, genes downregulated were plotted on negative x axis scale and the upregulated genes were plotted on the positive side of the x axis scale. Genes that satisfy the statistical significance is shown in red, rest of the genes were shown as blue circles. a) Volcano plot showing differentially expressed genes in resistant cells treated with DAC in comparison to untreated cells for a) 48 h b) 72 h. Comparison of gene expression in resistant cells treated with DAC or DAC + Dox for d) 48 h. d) 72 h. e) The heat map shows the effect of DAC alone, Dox alone and sequentially treated with DAC and Dox for 48 h or 72 h on global gene expression in resistant breast cancer cells. Intensity of red indicates relatively high expression relative to the sample mean and blue indicates relatively low expression. Comparison of DAC vs. DAC + Dox shows similar gene expression pattern. Dox and untreated cells shows similar expression pattern. f) Network showing the direct and indirect interaction of p21, DNMT1 with other tumor suppressor genes. Network also shows downregulation of some of the genes which could positively play a role in cell proliferation. Red and blue color circles indicate genes upregulated and downregulated, respectively.
Table 2.
Differentially expressed genes involved in key pathways/processes in resistant breast cancer (MCF-7/DR) cells following treatment with decitabine for different time periods.

|

|
Table 3.
Tumor suppressor genes upregulated following decitabine treatment for 48 or 72 h in resistant breast cancer (MCF-7/ADR) cells.
| No | Gene Symbol | Entrez Gene I.D | Description | Sub cellular location | Function | Comments |
|---|---|---|---|---|---|---|
| 1 | CD19 | 930 | CD19 molecule | Plasma Membrane | Assembles with antigen receptor of B Lymphocytes | Expression leads to growth inhibition and reduced tumorigenicity in human multiple myeloma29 |
| 2 | CSRP2 | 1466 | Cysteine and glycine rich protein-2 | Nucleus | Development and cell differentiation | Acts as a repressor for NF-kappa B to suppress tumorigenesis and angiogenesis30 |
| 3 | CST6 | 1474 | Cystatin E/M | Extracellular, secreted protein | Physiological inhibitors of lysosomal cysteine proteases | Significantly reduces cell proliferation and migration31,32 |
| 4 | CRMP3 | 10570 | Dihydropyrimidi-nase-like 4 | Cytoplasm | Cell signaling and cytoskeleton remodeling | Direct downstream target of p53 on apoptosis. Apoptosis inducible factor in response to DNA damage33 |
| 5 | DUSP4/MKP2 | 1846 | Dual specificity phosphatase 4 | Nucleus | Negatively regulates Mitogen activated protein (MAP) kinase | Inhibits MAP kinase signaling and thereby cell proliferation. Tumor suppressor in gliomas34 |
| 6 | DUSP5 | 1847 | Dual specificity phosphatase 5 | Nucleus | Negatively regulates Mitogen activated protein (MAP) kinase | Direct transcriptional target of p53 to deactivate MAP - kinase pathway and thereby inhibits cell proliferation35 |
| 7 | ECRG4/C2orf 40 | 84417 | Chromosome 2 open reading frame 40 | Secreted protein | Probable hormone | Putative tumor suppressor gene in various cancers including breast cancer36 |
| 8 | EGR1 | 1958 | Early growth response 1 | Nucleus | Transcriptional regulator | Functions as tumor suppressor via regulation of p53 in skin carcinoma (ref). Direct regulator of multiple tumor suppressors including TGFbeta1, p53, p21 and PTEN37 |
| 9 | HES6 | 55502 | Hairy and enhancer of split 6 | Nucleus | cell differentiation | Inhibits cell proliferation through induction of p2138 |
| 10 | H19 | 283120 | HI9, imprinted maternally expressed transcript (non-protein coding) | Nucleus and Cytoplasm | Acts as translational repressor | Functions as a tumor suppressor in various cancers39 |
| 11 | IBP6 | 3489 | Insulin like growth factor binding protein 6 | Secreted | Binds to IGF-I and -II with high affinity and specificity | Activates programmed cell death in non-small cell lung cancer cells both in vitro and in vivo40 |
| 12 | IF127 | 3429 | Interferon, alpha-inducible protein 27 | Plasma membrane and mitochondria | Promotes cell death | Mediates interferon induced apoptosis characterized by release of cytochrome c, and activation of BAX and caspases - 2,3,6,8 and 9. Also sensitizes cells to other stimulus such as etopside41 |
| 13 | LGALS7 | 3963 | Lectin, galactoside-binding, soluble, 7 | Cytoplasm and nucleus | Involved in cell- cell and/or cell-matrix interactions | Suppresses angiogenesis and tumor growth42 |
| 14 | LXN | 56925 | Latexin | Cytoplasm | Endogenous carboxypeptidase inhibitor | Inhibits lymphoma cell proliferation and proliferation of gastric carcinoma in vitro and in vivo43,44 |
| 15 | MT1F | 4494 | Metallothionein 1F | Cytoplasm and nucleus | Binds various heavy metals | Putative tumor suppressor gene in colon carcinogenesis45 |
| 16 | MT1G | 4495 | Metallothionein 1G | Cytoplasm and nucleus | Binds various heavy metals | Reported as tumor suppressor gene in hepatocellular carcinoma46 |
| 17 | p21 | 1026 | Cyclin-dependent kinase inhibitor 1A | Cytoplasm and nucleus | Binds to and inhibits cyclin-dependent kinase activity | Tumor suppressor, induces cell cycle arrest in cancer cells47 |
| 18 | RASD1 | 51655 | RAS, dexamethasone-induced 1 | Plasma membrane | Regulates cell growth and cell differentiation | Inhibits cell proliferation of G418 resistant MCF 7 breast cancer cells, lung adenocarcinoma A549 and murine fibroblasts (NIH 3T3) cells in vitro48 |
| 19 | SMAD3 | 4088 | SMAD family member 3 | Cytoplasm and nucleus | Signal transducer and transcriptional regulator | In gastric cancer cells, SMAD3 expression restored the expression of TGF-b, p21 and p15, thereby inhibits cancer growth49 |
| 20 | SOCS1 | 8651 | suppressor of cytokine signaling 1 | Intracellular, nucleus | Protein kinase inhibitor, negative regulator of JAK/STAT pathway | Functions as tumor suppressor gene in various cancers including breast carcinomas50–52 |
| 21 | THY1 | 7070 | Thy-1 cell surface antigen | Plasma membrane | Cell- cell adhesion and cytoskeletal organization | Suppresses the growth of human ovarian cancer and nasopharyngeal carcinoma53,54 |
Table 4.
Tumor promoter genes downregulated in resistant breast cancer (MCF-7/ADR) cells following sequential treatment with decitabine and doxorubicin with reference to decitabine alone treated cells for 72 h.
| No | Gene Symbol | Entrez Gene I.D | Description | Sub cellular location | Function | Comments |
|---|---|---|---|---|---|---|
| 1 | CCL20 | 6364 | Chemokine (C-C motif) ligand 20 | Secreted | Chemoattractant of CCR6 bearing dendritic cells | Promote cell proliferation and metastasis. Also plays a role in organ specific metastasis of colorectal cancer55 |
| 2 | CTSL | 1514 | Cathepsin L1 | Lysosome and extracellular | Protein degradation and extracellular matrix (ECM) degradation | Due its ability to degrade ECM over a wide range of pH, it plays a key role in metastasis of tumor cells56 |
| 3 | HDGFL1 | 154150 | Hepatoma derived growth factor like 1 | Secreted | Exogenous mitogen | Involved in anchorage independent growth, invasion and angiogenesis of non-small cell lung cancer cells57 |
| 4 | HSPA2 | 3306 | Heat shock 70kDa protein 2 | Cytoplasm and nucleus | Molecular chaperone for CDC2 | Promotes tumor promotion, migration and invasion58 |
| 5 | LOC342897 | 342897 | Non- specific cytotoxic cell receptor protein 1 homolog (zebra fish) | Intracellular | Ubiquitin ligase | Enhances cell proliferation of various cancers59 |
| 6 | MAP7 | 9053 | Microtubule-associated protein 7 | Cytoplasm | Stabilize microtubules | Higher expression of MAP7 was associated with poor prognosis. Plays a role in cell division, motility and cell shape60 |
| 7 | MMP9 | 4318 | Matrix metallopeptidase 9 | Extracellular, secreted protein | Proteolysis of ECM | Tumor invasion and metastasis61 |
| 8 | NNAT | 4826 | Neuronatin | Endoplasmic reticulum | Regulates intracellular calcium levels in dendrites | Increases cell proliferation and decreases patient survival in Glioblastoma Multiforme62 |
| 9 | NMB | 4828 | Neuromedin B | Extracellular, secreted protein | Involved in various physiological functions: exocrine and endocrine secretions, smooth muscle contraction | Angiogenesis and growth of malignant tumor cells63 |
| 10 | RPL10L | 140801 | Ribosomal protein L10-like | Intracellular, cytoplasm and ribosome | Could play a role in sperm differentiation and maturation | Possibly enhance ribosomal activity and/or translational activity in ovarian cancer64 |
| 11 | STMN3 | 100174566 | Stathmin-like 3 | Golgi apparatus | Microtubule depolymerization | Induce cell proliferation, migration and matrix invasion of adenocarcinoma and squamous cell carcinoma65 |
| 12 | TKTL1 | 8277 | Transketolase-like 1 | Cytoplasm and nucleus | Transketolase metabolism | Enhances oxygen independent glucose metabolism and lactate based matrix degradation to favor tumor invasion and metastasis66 |
Western Blot and Gene Expression
To validate our microarray results and to confirm the induction of p21, a critical regulator of the cell cycle, semiquantitative RT-PCR analyses were carried out using TaqMan probes. The expression level of p16, another cell-cycle regulator, whose expression is not altered by DAC, was used as a negative control. Consistent with our microarray results, DAC alone or its combination with doxorubicin in sequential treatment markedly increased the expression of p21 by >4 fold at 48 h and >10 fold at 72 h. Under these conditions, the expression of p16 was unaltered (Figure 6a). Furthermore, our immunoblotting results showed a significant increase in p21 protein expression in both DAC alone and in combination with doxorubicin in sequential treatment (Figure 6b and c).
Figure 6. Semiquantitative RT-PCR analyses of p21.

Expression of p16 was used as a negative control. a) DAC alone or its combination with Dox increased the expression of p21 mRNA. Data are expressed as mean ± s.e.m, n = 4 **p < 0.0005, *p < 0.005 untreated vs. DAC or DAC + Dox. b) Expression of p21 protein analyzed by western blot in drug-resistant cells in different treatment groups. p21 showed increased expression in cells treated with DAC alone and sequentially with DAC and Dox. Actin served as a loading control. Representative results from two separate experiments. c) Quantification of western blot data using Image J analysis software.
DNMT1 Depletion
Treating drug-resistant cells with DAC caused depletion of DNMT1 at 24 h post treatment, but the effect was transient; the DNMT1 level returned to the level present in untreated cells at 2 days post treatment (Figure 7).
Figure 7. Effect of DAC treatment on DNMT1 protein expression in drug-resistant cells.

a) Analysis of DNMT1 protein expression by western blot in MCF-7/ADR cells treated with DAC. b) Quantification of western blot data using Image J analysis software. DAC depleted DNMT1 for 24 h. No difference in DNMT1 levels was observed with respect to untreated cells in the samples collected at 2, 3 and 5 days post treatment with DAC.
DISCUSSION
Chemotherapeutic strategies using a combination of anthracyclines with other cytotoxic anticancer drugs, acting via different pathways – so-called drug cocktails– have widely been used in clinical settings for cancer therapy. However, most such combination therapies produce additive rather than synergistic effects and also increase toxicity.70, 71 In addition, the risk that tumors will develop drug resistance and the difficulty in treating them once they do so remain pressing issues in cancer chemotherapy. Therefore, new and effective strategies to overcome drug resistance and to reduce drug-induced side effects are urgently needed. In this study, we show that epigenetic drugs, when used sequentially in combination with doxorubicin, induce a highly synergistic effect and overcome drug resistance of cells to a significant extent.
An interesting observation was the selective response of DAC to resistant MCF-7/ADR cells rather than sensitive MCF-7 cells. The resistant cells demonstrated a dose-response antiproliferative effect, but the sensitive cells were not significantly responsive to DAC treatment (Figure 1a vs. Figure 2a). This difference in response could be due to the hypermethylated state of DNA in resistant cells, suppressing the expression of tumor suppressor genes, which control many cellular functions, including proliferation. Following treatment with the epigenetic drug, these genes are re-expressed in resistant cells, and hence the effect of the epigenetic drug is more selective in resistant cells than in sensitive cells. For the same reason, the synergistic effect was much more pronounced in resistant cells than in sensitive cells (Table 1), signifying the role of epigenetic alternations in resistant cells and response to cancer chemotherapy.
The sequential treatment of DAC and doxorubicin was more effective than simultaneous treatment in resistant cells (Figure 1b and c). This difference could be due to the interference of doxorubicin on DNA polymerase activity72 when cells are treated simultaneously, thus inhibiting the incorporation of DAC into the DNA25 and hence re-expression of tumor suppressor genes. This may not happen when DAC and doxorubicin are given sequentially. Recently, we demonstrated that DAC treatment alters the resistant cell membrane lipid composition and biophysical properties to favor increased doxorubicin influx and a cytotoxic effect.73 For such an effect, resistant cells require pretreatment with DAC to induce changes in lipid biosynthesis, which may not occur in simultaneous treatment due to interference of doxorubicin in re-expression of genes, some of which may be responsible for the altered lipid biosynthesis.
Unlike DAC, which demonstrated a greater antiproliferative effect in resistant cells than in sensitive cells, SAHA treatment caused almost the same antiproliferative effect in both the resistant (MCF-7/ADR) and sensitive (MCF-7 cells; Figure 1a vs. 3a). The selective action of DAC in resistant cells thus indicates the role of DNA methylation in drug resistance.
A second interesting observation was the synergistic effect seen in resistant cells which had undergone sequential treatment, with SAHA first, followed by doxorubicin. In this case, treating resistant cells with SAHA for a shorter period of time (4 h) prior to doxorubicin treatment was more effective than prolonged pretreatment of cells with SAHA (Figure 3b and c). It is known that through histone acetylation, SAHA induces p21 expression and causes cells to undergo cell-cycle arrest.74 Incubation of cells with SAHA for a brief period of time could have relaxed the chromatin so that doxorubicin and its substrate Topo II might have better access to DNA than when increasing number cells undergo cell-cycle arrest with prolonged incubation time with SAHA. The other possibility could be that the chromatin relaxation could increase the accessibility of Topo I to the DNA to induce DNA replication27, 75, thus counteracting the effect of doxorubicin. Sensitive cells demonstrated a synergistic effect, but the effect diminished with increased pretreatment time with SAHA. The resistant and sensitive cells thus showed the same pattern of reduced synergistic effect with increased pretreatment time with SAHA, but the effect was much more pronounced in resistant cells than in sensitive cells (Figure 3 d and e). It is clear that further studies are needed to understand the above difference in SAHA pretreatment in resistant and sensitive cells, particularly the difference in the histone acetylation patterns and genes reactivated following SAHA treatment in these cells.
DAC pretreatment overcomes drug resistance in breast cancer cells by depleting DNMT1 protein which is reported to relive transcriptional repression of p21, thereby increasing its expression76(Figure 7). DNMT1 depletion also indirectly plays a role in activation of p21 via re-expression of methylation silenced transcription factors such as EGR1, SMAD3 and HES6 in resistant cells that directly interact with p21 promoter41, 52, 76 and increase its expression in cancer cells. This suggests that p21 might be a methylation- suppressed gene in drug-resistant cells. In addition to reactivation of p21, EGR1 and SMAD3 were also found to transcriptionally activate various genes which could negatively regulate the growth of cancer cells (Figure 5f). Induction of p21 expression in cells treated with DAC (Figure 6a–c) cause cells to undergo G2/M arrest (Figure 4a–d). Topo IIα levels are reported to be high in the G2/M phase,77 therefore the arrest of cells in G2/M might result in increased accumulation of Topo IIα. Doxorubicin utilizes Topo IIα to induce DNA damage and achieve its cytotoxic effect.78, 79 This may explain the synergistic effect seen in our study following sequential treatment with DAC and doxorubicin. In addition, our data show sequential treatment causes downregulation of several tumor promoter genes (Table 4).
Despite the synergistic efficacy of sequential treatment of DAC and doxorubicin, we found that about 20% of resistant cells were not responsive to the sequential treatment even at higher doses of DAC and doxorubicin (Figure 1a). It is possible that these cells may be at different stages of the cell cycle than the proliferative phase (S-phase). DAC is a cytosine analog; hence it is recognized as a nucleotide by DNA polymerase and is incorporated in DNA strands during S-phase.25 We intentionally did not synchronize cells to S-phase because in tumors, cells are at different stages of the cell cycle. The other possibility could be the instability of DAC in culture medium (half-life in culture medium = 17.5 h80), which may have prevented a fraction of the slowly dividing cells from being exposed to DAC at doses and for the time period that is effective to cause epigenetic alterations.
The western blot results demonstrate that DNMT1 levels revert back to normal levels at day 2 post treatment with DAC solution (Figure 7), suggesting its transient effect due to its rapid degradation in culture medium, as mentioned above.80 This reversion also raises the issue of translation of such epigenetic drugs for the treatment of solid tumors. Because of their short half-life, DAC and SAHA are not effective in providing enough of a therapeutic dose to solid tumors to induce expression of epigenetically silenced tumor suppressor genes. In addition to addressing the issue of their stability in vivo without causing toxicity,81, 82 the other key issue would be how to achieve precise sequential delivery of the drugs used. Although investigators are working on developing more stable analogs of the currently used epigenetic drugs or developing new epigenetic drugs that are more stable in vivo, the other option could be to develop an appropriate nanocarrier system that can target epigenetic drugs directly to the tumor. One could also potentially develop a nanocarrier system that can deliver the epigenetic drug and an anticancer agent in sequential order to achieve a synergistic effect. We have previously shown that resistant cells treated with DAC restore endocytic functions,73 which is critical for the efficacy of nanoparticle-based drug delivery system in resistant cells.
Despite the challenges, sequential treatment with an epigenetic drug followed by doxorubicin provides a highly promising approach for the treatment of breast cancer. Another advantage of the highly synergistic effect achieved is that one may need significantly lower doses of doxorubicin that can reduce its cardiac toxicity. More importantly, the sequential treatment can provide effective therapy for treating doxorubicin-resistant breast cancer.
It would be interesting to further analyze the effect of SAHA in resistant and sensitive cells, particularly the changes in gene expression profile and determine whether two epigenetic drugs in combination (DAC and SAHA) for pretreatment could be more effective in overcoming doxorubicin resistance than either DAC or SAHA. We have tested the efficacy of sequential treatment in drug-resistant breast cancer, but the issue also exists in other cancers that develop drug resistance. Drug resistance could be due to other reasons including genetic changes in cells, hence it is necessary to analyze tumors to ascertain that the drug resistance is due to epigenetic alterations and accordingly design a therapeutic strategy of sequential treatment to overcome drug resistance. This method may mean developing personalized therapy to effectively treat cancer patients.
CONCLUSIONS
The sequential treatment of epigenetic drug plus doxorubicin shows a highly synergistic effect in overcoming drug resistance in tumor cells. The synergistic effect depends on the epigenetic drug as well as duration of treatment and cell line. In general, the synergistic effect was more pronounced in resistant cells than in sensitive cells and DAC was more effective than SAHA in overcoming drug resistance. The combination therapy with the epigenetic drug and doxorubicin, when given in sequential order at optimal doses and duration, could provide and effective therapeutic strategy to overcome drug resistance that can potentially minimize doxorubicin-induced cardiotoxicity because lower doses of doxorubicin may be needed to achieve tumor regression.
Supplementary Material
ACKNOWLEDGMENT
This study was funded by grant R01 CA149359-01 (to VL) from the National Cancer Institute of the National Institutes of Health. We thank Na Jie, Biostatistician and Banu Gopalan, Core manager, Bio-informatics core, Lerner Research Institute, Cleveland Clinic, Ohio for carrying out statistical and functional analysis of gene expression data.
ABBREVIATIONS
- BCA
Bicinchoninic acid
- CI
Combination Index
- DAC
Decitabine (trade name Dacogen)
- DMEM
Dulbecco's Modified Eagle's Medium
- DNMT
DNA methyl transferase
- Dox
Doxorubicin in solution
- Doxil
Trade name of a liposome form of doxorubicin
- DPBS
Dulbecco's phosphate-buffered saline
- ECL
Electrochemiluminescence
- GAPDH
Glyceraldehyde 3-phosphate dehydrogenase
- IC50
Inhibitory concentration required for 50% cell death
- PBS
Phosphate-buffered saline
- PI
Propidium Iodide
- PVDF
Polyvinylidene difluoride
- SAHA
Suberoylanilide hydroxamic acid (generic name vorinostat)
- TBST
Tris-buffered saline with 0.5% Tween 20
- Topo I
Topoisomerase I
- Topo II
Topoisomerase II
Footnotes
SUPPORTING INFORMATION (SI) Heat map showing the expression of house keeping genes following treatment of MCF-7/ADR cells with DAC alone, doxorubicin alone, and sequentially with DAC and doxorubicin for 48 h and 72 h. Red indicates relatively high expression relative to the sample mean and blue indicates relatively low expression. Results show that the expression of housekeeping genes is not significantly altered following different treatments. This material is available free of charge via the Internet at http://pubs.acs.org
REFERENCES
- 1.Song SH, Han SW, Bang YJ. Epigenetic-based therapies in cancer: progress to date. Drugs. 2011;71:2391–2403. doi: 10.2165/11596690-000000000-00000. [DOI] [PubMed] [Google Scholar]
- 2.Boumber Y, Issa JP. Epigenetics in cancer: what's the future? Oncology (Williston Park) 2011;25:220–226. [PubMed] [Google Scholar]
- 3.Ellis L, Atadja PW, Johnstone RW. Epigenetics in cancer: targeting chromatin modifications. Mol. Cancer Ther. 2009;8:1409–1420. doi: 10.1158/1535-7163.MCT-08-0860. [DOI] [PubMed] [Google Scholar]
- 4.Mund C, Lyko F. Epigenetic cancer therapy: Proof of concept and remaining challenges. Bioessays. 2010;32:949–957. doi: 10.1002/bies.201000061. [DOI] [PubMed] [Google Scholar]
- 5.Teodoridis JM, Strathdee G, Brown R. Epigenetic silencing mediated by CpG island methylation: potential as a therapeutic target and as a biomarker. Drug Resist. Update. 2004;7:267–278. doi: 10.1016/j.drup.2004.06.005. [DOI] [PubMed] [Google Scholar]
- 6.Martinez R. Beyond Genetics in Glioma Pathways: The Ever-Increasing Crosstalk between Epigenomic and Genomic Events. J. Signal Transduct. 2012 Jun 18; doi: 10.1155/2012/519807. Epub ahead of print. [DOI] [PMC free article] [PubMed] [Google Scholar]
- 7.Lo PK, Sukumar S. Epigenomics and breast cancer. Pharmacogenomics. 2008;9:1879–1902. doi: 10.2217/14622416.9.12.1879. [DOI] [PMC free article] [PubMed] [Google Scholar]
- 8.Alelu-Paz R, Ashour N, Gonzalez-Corpas A, Ropero S. DNA Methylation, Histone Modifications, and Signal Transduction Pathways: A Close Relationship in Malignant Gliomas Pathophysiology. J. Signal Transduct. 2012 Jul 17; doi: 10.1155/2012/956958. Epub ahead of print. [DOI] [PMC free article] [PubMed] [Google Scholar]
- 9.Kristensen LS, Nielsen HM, Hansen LL. Epigenetics and cancer treatment. Eur. J. Pharmacol. 2009;625:131–142. doi: 10.1016/j.ejphar.2009.10.011. [DOI] [PubMed] [Google Scholar]
- 10.Gianni L, Norton L, Wolmark N, Suter TM, Bonadonna G, Hortobagyi GN. Role of anthracyclines in the treatment of early breast cancer. J. Clin. Oncol. 2009;27:4798–4808. doi: 10.1200/JCO.2008.21.4791. [DOI] [PubMed] [Google Scholar]
- 11.Khasraw M, Bell R, Dang C. Epirubicin: is it like doxorubicin in breast cancer? A clinical review. Breast. 2012;21:142–149. doi: 10.1016/j.breast.2011.12.012. [DOI] [PubMed] [Google Scholar]
- 12.Menna P, Paz OG, Chello M, Covino E, Salvatorelli E, Minotti G. Anthracycline cardiotoxicity. Expert Opin. Drug Saf. 2012;11(Suppl 1):S21–36. doi: 10.1517/14740338.2011.589834. [DOI] [PubMed] [Google Scholar]
- 13.Octavia Y, Tocchetti CG, Gabrielson KL, Janssens S, Crijns HJ, Moens AL. Doxorubicin-induced cardiomyopathy: from molecular mechanisms to therapeutic strategies. J. Mol. Cell. Cardiol. 2012;52:1213–1225. doi: 10.1016/j.yjmcc.2012.03.006. [DOI] [PubMed] [Google Scholar]
- 14.Dusre L, Mimnaugh EG, Myers CE, Sinha BK. Potentiation of doxorubicin cytotoxicity by buthionine sulfoximine in multidrug-resistant human breast tumor cells. Cancer Res. 1989;49:511–515. [PubMed] [Google Scholar]
- 15.Patil RR, Guhagarkar SA, Devarajan PV. Engineered nanocarriers of doxorubicin: a current update. Crit. Rev. Ther. Drug Carrier Syst. 2008;25:1–61. doi: 10.1615/critrevtherdrugcarriersyst.v25.i1.10. [DOI] [PubMed] [Google Scholar]
- 16.Peetla C, Bhave R, Vijayaraghavalu S, Stine A, Kooijman E, Labhasetwar V. Drug resistance in breast cancer cells: biophysical characterization of and doxorubicin interactions with membrane lipids. Mol. Pharmaceutics. 2010;7:2334–2348. doi: 10.1021/mp100308n. [DOI] [PMC free article] [PubMed] [Google Scholar]
- 17.Basile L, Pignatello R, Passirani C. Active targeting strategies for anticancer drug nanocarriers. Curr. Drug Deliv. 2012;9:255–268. doi: 10.2174/156720112800389089. [DOI] [PubMed] [Google Scholar]
- 18.Tewey KM, Rowe TC, Yang L, Halligan BD, Liu LF. Adriamycin-induced DNA damage mediated by mammalian DNA topoisomerase II. Science. 1984;226:466–468. doi: 10.1126/science.6093249. [DOI] [PubMed] [Google Scholar]
- 19.Kim R, Hirabayashi N, Nishiyama M, Saeki S, Toge T, Okada K. Expression of MDR1, GST-pi and topoisomerase II as an indicator of clinical response to adriamycin. Anticancer Res. 1991;11:429–431. [PubMed] [Google Scholar]
- 20.Tan KB, Mattern MR, Eng WK, McCabe FL, Johnson RK. Nonproductive rearrangement of DNA topoisomerase I and II genes: correlation with resistance to topoisomerase inhibitors. J. Natl. Cancer Inst. 1989;81:1732–1735. doi: 10.1093/jnci/81.22.1732. [DOI] [PubMed] [Google Scholar]
- 21.Kang MR, Chung IK. Down-regulation of DNA topoisomerase IIalpha in human colorectal carcinoma cells resistant to a protoberberine alkaloid, berberrubine. Mol. Pharmacol. 2002;61:879–884. doi: 10.1124/mol.61.4.879. [DOI] [PubMed] [Google Scholar]
- 22.Ando T, Nishimura M, Oka Y. Decitabine (5-Aza-2'-deoxycytidine) decreased DNA methylation and expression of MDR-1 gene in K562/ADM cells. Leukemia. 2000;14:1915–1920. doi: 10.1038/sj.leu.2401914. [DOI] [PubMed] [Google Scholar]
- 23.Segura-Pacheco B, Perez-Cardenas E, Taja-Chayeb L, Chavez-Blanco A, Revilla-Vazquez A, Benitez-Bribiesca L, Duenas-Gonzalez A. Global DNA hypermethylation-associated cancer chemotherapy resistance and its reversion with the demethylating agent hydralazine. J. Transl. Med. 2006;4:32. doi: 10.1186/1479-5876-4-32. [DOI] [PMC free article] [PubMed] [Google Scholar]
- 24.Demircan B, Dyer LM, Gerace M, Lobenhofer EK, Robertson KD, Brown KD. Comparative epigenomics of human and mouse mammary tumors. Gene Chromosome Canc. 2009;48:83–97. doi: 10.1002/gcc.20620. [DOI] [PMC free article] [PubMed] [Google Scholar]
- 25.Daskalakis M, Blagitko-Dorfs N, Hackanson B. Decitabine. Recent Results Cancer Res. 2010;184:131–157. doi: 10.1007/978-3-642-01222-8_10. [DOI] [PubMed] [Google Scholar]
- 26.Sato A. Vorinostat approved in Japan for treatment of cutaneous T-cell lymphomas: status and prospects. Onco Targets Ther. 2012;5:67–75. doi: 10.2147/OTT.S23874. [DOI] [PMC free article] [PubMed] [Google Scholar]
- 27.Thurn KT, Thomas S, Moore A, Munster PN. Rational therapeutic combinations with histone deacetylase inhibitors for the treatment of cancer. Future Oncol. 2011;7:263–283. doi: 10.2217/fon.11.2. [DOI] [PMC free article] [PubMed] [Google Scholar]
- 28.Wehbe-Janek H, Shi Q, Kearney CM. Cordycepin/Hydroxyurea synergy allows low dosage efficacy of cordycepin in MOLT-4 leukemia cells. Anticancer Res. 2007;27:3143–3146. [PubMed] [Google Scholar]
- 29.Benjamini Y, Hochberg Y. Controlling the false discovery rate - a practical and powerful approach to multiple testing. J. R. Statist. Soc. B. 1995;57:289–300. [Google Scholar]
- 30.Nikolsky Y, Ekins S, Nikolskaya T, Bugrim A. A novel method for generation of signature networks as biomarkers from complex high throughput data. Toxicol. Lett. 2005;158:20–29. doi: 10.1016/j.toxlet.2005.02.004. [DOI] [PubMed] [Google Scholar]
- 31.Mason CW, Swaan PW, Weiner CP. Identification of interactive gene networks: a novel approach in gene array profiling of myometrial events during guinea pig pregnancy. Am. J. Obstet. Gynecol. 2006;194:1513–1523. doi: 10.1016/j.ajog.2005.12.044. [DOI] [PubMed] [Google Scholar]
- 32.Mahmoud MS, Fujii R, Ishikawa H, Kawano MM. Enforced CD19 expression leads to growth inhibition and reduced tumorigenicity. Blood. 1999;94:3551–3558. [PubMed] [Google Scholar]
- 33.Cheung AK, Ko JM, Lung HL, Chan KW, Stanbridge EJ, Zabarovsky E, Tokino T, Kashima L, Suzuki T, Kwong DL, Chua D, Tsao SW, Lung ML. Cysteine-rich intestinal protein 2 (CRIP2) acts as a repressor of NF-kappaB-mediated proangiogenic cytokine transcription to suppress tumorigenesis and angiogenesis. Proc. Natl. Acad. Sci. U. S. A. 2011;108:8390–8395. doi: 10.1073/pnas.1101747108. [DOI] [PMC free article] [PubMed] [Google Scholar]
- 34.Rivenbark AG, Jones WD, Coleman WB. DNA methylation-dependent silencing of CST6 in human breast cancer cell lines. Lab. Invest. 2006;86:1233–1242. doi: 10.1038/labinvest.3700485. [DOI] [PubMed] [Google Scholar]
- 35.Shridhar R, Zhang J, Song J, Booth BA, Kevil CG, Sotiropoulou G, Sloane BF, Keppler D. Cystatin M suppresses the malignant phenotype of human MDA-MB-435S cells. Oncogene. 2004;23:2206–2215. doi: 10.1038/sj.onc.1207340. [DOI] [PubMed] [Google Scholar]
- 36.Kimura J, Kudoh T, Miki Y, Yoshida K. Identification of dihydropyrimidinase-related protein 4 as a novel target of the p53 tumor suppressor in the apoptotic response to DNA damage. Int. J. Cancer. 2011;128:1524–1531. doi: 10.1002/ijc.25475. [DOI] [PubMed] [Google Scholar]
- 37.Waha A, Felsberg J, Hartmann W, von dem Knesebeck A, Mikeska T, Joos S, Wolter M, Koch A, Yan PS, Endl E, Wiestler OD, Reifenberger G, Pietsch T, Waha A. Epigenetic downregulation of mitogen-activated protein kinase phosphatase MKP-2 relieves its growth suppressive activity in glioma cells. Cancer Res. 2010;70:1689–1699. doi: 10.1158/0008-5472.CAN-09-3218. [DOI] [PubMed] [Google Scholar]
- 38.Ueda K, Arakawa H, Nakamura Y. Dual-specificity phosphatase 5 (DUSP5) as a direct transcriptional target of tumor suppressor p53. Oncogene. 2003;22:5586–5591. doi: 10.1038/sj.onc.1206845. [DOI] [PubMed] [Google Scholar]
- 39.Sabatier R, Finetti P, Adelaide J, Guille A, Borg JP, Chaffanet M, Lane L, Birnbaum D, Bertucci F. Down-regulation of ECRG4, a candidate tumor suppressor gene, in human breast cancer. PLoS ONE. 2011;6:e27656. doi: 10.1371/journal.pone.0027656. [DOI] [PMC free article] [PubMed] [Google Scholar]
- 40.Baron V, Adamson ED, Calogero A, Ragona G, Mercola D. The transcription factor Egr1 is a direct regulator of multiple tumor suppressors including TGFbeta1, PTEN, p53, and fibronectin. Cancer Gene Ther. 2006;13:115–124. doi: 10.1038/sj.cgt.7700896. [DOI] [PMC free article] [PubMed] [Google Scholar]
- 41.Drenzek JG, Seiler NL, Jaskula-Sztul R, Rausch MM, Rose SL. Xanthohumol decreases Notch1 expression and cell growth by cell cycle arrest and induction of apoptosis in epithelial ovarian cancer cell lines. Gynecol. Oncol. 2011;122:396–401. doi: 10.1016/j.ygyno.2011.04.027. [DOI] [PubMed] [Google Scholar]
- 42.Yoshimizu T, Miroglio A, Ripoche MA, Gabory A, Vernucci M, Riccio A, Colnot S, Godard C, Terris B, Jammes H, Dandolo L. The H19 locus acts in vivo as a tumor suppressor. Proc. Natl. Acad. Sci. U. S. A. 2008;105:12417–12422. doi: 10.1073/pnas.0801540105. [DOI] [PMC free article] [PubMed] [Google Scholar]
- 43.Sueoka N, Lee HY, Wiehle S, Cristiano RJ, Fang B, Ji L, Roth JA, Hong WK, Cohen P, Kurie JM. Insulin-like growth factor binding protein-6 activates programmed cell death in non-small cell lung cancer cells. Oncogene. 2000;19:4432–4436. doi: 10.1038/sj.onc.1203813. [DOI] [PubMed] [Google Scholar]
- 44.Rosebeck S, Leaman DW. Mitochondrial localization and pro-apoptotic effects of the interferon-inducible protein ISG12a. Apoptosis. 2008;13:562–572. doi: 10.1007/s10495-008-0190-0. [DOI] [PubMed] [Google Scholar]
- 45.Ueda S, Kuwabara I, Liu FT. Suppression of tumor growth by galectin-7 gene transfer. Cancer Res. 2004;64:5672–5676. doi: 10.1158/0008-5472.CAN-04-0985. [DOI] [PubMed] [Google Scholar]
- 46.Li Y, Basang Z, Ding H, Lu Z, Ning T, Wei H, Cai H, Ke Y. Latexin expression is downregulated in human gastric carcinomas and exhibits tumor suppressor potential. BMC Cancer. 2011;11:121. doi: 10.1186/1471-2407-11-121. [DOI] [PMC free article] [PubMed] [Google Scholar]
- 47.Liang Y, Van Zant G. Aging stem cells, latexin, and longevity. Exp. Cell Res. 2008;314:1962–1972. doi: 10.1016/j.yexcr.2008.01.032. [DOI] [PMC free article] [PubMed] [Google Scholar]
- 48.Yan DW, Fan JW, Yu ZH, Li MX, Wen YG, Li DW, Zhou CZ, Wang XL, Wang Q, Tang HM, Peng ZH. Downregulation of metallothionein 1F, a putative oncosuppressor, by loss of heterozygosity in colon cancer tissue. Biochim. Biophys. Acta. 2012;1822:918–926. doi: 10.1016/j.bbadis.2012.02.021. [DOI] [PubMed] [Google Scholar]
- 49.Kanda M, Nomoto S, Okamura Y, Nishikawa Y, Sugimoto H, Kanazumi N, Takeda S, Nakao A. Detection of metallothionein 1G as a methylated tumor suppressor gene in human hepatocellular carcinoma using a novel method of double combination array analysis. Int. J. Oncol. 2009;35:477–483. doi: 10.3892/ijo_00000359. [DOI] [PubMed] [Google Scholar]
- 50.Abbas T, Dutta A. p21 in cancer: intricate networks and multiple activities. Nat. Rev. Cancer. 2009;9:400–414. doi: 10.1038/nrc2657. [DOI] [PMC free article] [PubMed] [Google Scholar]
- 51.Vaidyanathan G, Cismowski MJ, Wang G, Vincent TS, Brown KD, Lanier SM. The Ras-related protein AGS1/RASD1 suppresses cell growth. Oncogene. 2004;23:5858–5863. doi: 10.1038/sj.onc.1207774. [DOI] [PubMed] [Google Scholar]
- 52.Ijichi H, Otsuka M, Tateishi K, Ikenoue T, Kawakami T, Kanai F, Arakawa Y, Seki N, Shimizu K, Miyazono K, Kawabe T, Omata M. Smad4-independent regulation of p21/WAF1 by transforming growth factor-beta. Oncogene. 2004;23:1043–1051. doi: 10.1038/sj.onc.1207222. [DOI] [PubMed] [Google Scholar]
- 53.Rottapel R, Ilangumaran S, Neale C, La Rose J, Ho JM, Nguyen MH, Barber D, Dubreuil P, de Sepulveda P. The tumor suppressor activity of SOCS-1. Oncogene. 2002;21:4351–4362. doi: 10.1038/sj.onc.1205537. [DOI] [PubMed] [Google Scholar]
- 54.Galm O, Yoshikawa H, Esteller M, Osieka R, Herman JG. SOCS-1, a negative regulator of cytokine signaling, is frequently silenced by methylation in multiple myeloma. Blood. 2003;101:2784–2788. doi: 10.1182/blood-2002-06-1735. [DOI] [PubMed] [Google Scholar]
- 55.Sutherland KD, Lindeman GJ, Choong DY, Wittlin S, Brentzell L, Phillips W, Campbell IG, Visvader JE. Differential hypermethylation of SOCS genes in ovarian and breast carcinomas. Oncogene. 2004;23:7726–7733. doi: 10.1038/sj.onc.1207787. [DOI] [PubMed] [Google Scholar]
- 56.Abeysinghe HR, Pollock SJ, Guckert NL, Veyberman Y, Keng P, Halterman M, Federoff HJ, Rosenblatt JP, Wang N. The role of the THY1 gene in human ovarian cancer suppression based on transfection studies. Cancer Genet. Cytogenet. 2004;149:1–10. doi: 10.1016/S0165-4608(03)00234-6. [DOI] [PubMed] [Google Scholar]
- 57.Lung HL, Bangarusamy DK, Xie D, Cheung AK, Cheng Y, Kumaran MK, Miller L, Liu ET, Guan XY, Sham JS, Fang Y, Li L, Wang N, Protopopov AI, Zabarovsky ER, Tsao SW, Stanbridge EJ, Lung ML. THY1 is a candidate tumour suppressor gene with decreased expression in metastatic nasopharyngeal carcinoma. Oncogene. 2005;24:6525–6532. doi: 10.1038/sj.onc.1208812. [DOI] [PubMed] [Google Scholar]
- 58.Ghadjar P, Rubie C, Aebersold DM, Keilholz U. The chemokine CCL20 and its receptor CCR6 in human malignancy with focus on colorectal cancer. Int. J. Cancer. 2009;125:741–745. doi: 10.1002/ijc.24468. [DOI] [PubMed] [Google Scholar]
- 59.Mir RA, Chauhan SS. Down regulation of a matrix degrading cysteine protease cathepsin L, by acetaldehyde: role of C/EBPalpha. PLoS ONE. 2011;6:e20768. doi: 10.1371/journal.pone.0020768. [DOI] [PMC free article] [PubMed] [Google Scholar]
- 60.Zhang J, Ren H, Yuan P, Lang W, Zhang L, Mao L. Down-regulation of hepatoma-derived growth factor inhibits anchorage-independent growth and invasion of non-small cell lung cancer cells. Cancer Res. 2006;66:18–23. doi: 10.1158/0008-5472.CAN-04-3905. [DOI] [PubMed] [Google Scholar]
- 61.Garg M, Kanojia D, Seth A, Kumar R, Gupta A, Surolia A, Suri A. Heat-shock protein 70–2 (HSP70-2) expression in bladder urothelial carcinoma is associated with tumour progression and promotes migration and invasion. Eur. J. Cancer. 2010;46:207–215. doi: 10.1016/j.ejca.2009.10.020. [DOI] [PubMed] [Google Scholar]
- 62.Kallio H, Tolvanen M, Janis J, Pan PW, Laurila E, Kallioniemi A, Kilpinen S, Tuominen VJ, Isola J, Valjakka J, Pastorekova S, Pastorek J, Parkkila S. Characterization of non-specific cytotoxic cell receptor protein 1: a new member of the lectin-type subfamily of F-box proteins. PLoS ONE. 2011;6:e27152. doi: 10.1371/journal.pone.0027152. [DOI] [PMC free article] [PubMed] [Google Scholar]
- 63.Blum C, Graham A, Yousefzadeh M, Shrout J, Benjamin K, Krishna M, Hoda R, Hoda R, Cole DJ, Garrett-Mayer E, Reed C, Wallace M, Mitas M. The expression ratio of Map7/B2M is prognostic for survival in patients with stage II colon cancer. Int. J. Oncol. 2008;33:579–584. [PMC free article] [PubMed] [Google Scholar]
- 64.Li J, Lau G, Chen L, Yuan YF, Huang J, Luk JM, Xie D, Guan XY. Interleukin 23 Promotes Hepatocellular Carcinoma Metastasis via NF-Kappa B Induced Matrix Metalloproteinase 9 Expression. PLoS ONE. 2012;7:e46264. doi: 10.1371/journal.pone.0046264. [DOI] [PMC free article] [PubMed] [Google Scholar]
- 65.Xu DS, Yang C, Proescholdt M, Brundl E, Brawanski A, Fang X, Lee CS, Weil RJ, Zhuang Z, Lonser RR. Neuronatin in a subset of glioblastoma multiforme tumor progenitor cells is associated with increased cell proliferation and shorter patient survival. PLoS ONE. 2012;7:e37811. doi: 10.1371/journal.pone.0037811. [DOI] [PMC free article] [PubMed] [Google Scholar]
- 66.Park HJ, Kim SR, Kim MK, Choi KS, Jang HO, Yun I, Bae SK, Bae MK. Neuromedin B receptor antagonist suppresses tumor angiogenesis and tumor growth in vitro and in vivo. Cancer Lett. 2011;312:117–127. doi: 10.1016/j.canlet.2011.08.014. [DOI] [PubMed] [Google Scholar]
- 67.Rohozinski J, Anderson ML, Broaddus RE, Edwards CL, Bishop CE. Spermatogenesis associated retrogenes are expressed in the human ovary and ovarian cancers. PLoS ONE. 2009;4:e5064. doi: 10.1371/journal.pone.0005064. [DOI] [PMC free article] [PubMed] [Google Scholar]
- 68.Singer S, Malz M, Herpel E, Warth A, Bissinger M, Keith M, Muley T, Meister M, Hoffmann H, Penzel R, Gdynia G, Ehemann V, Schnabel PA, Kuner R, Huber P, Schirmacher P, Breuhahn K. Coordinated expression of stathmin family members by far upstream sequence element-binding protein-1 increases motility in non-small cell lung cancer. Cancer Res. 2009;69:2234–2243. doi: 10.1158/0008-5472.CAN-08-3338. [DOI] [PubMed] [Google Scholar]
- 69.Xu X, Zur Hausen A, Coy JF, Lochelt M. Transketolase-like protein 1 (TKTL1) is required for rapid cell growth and full viability of human tumor cells. Int. J. Cancer. 2009;124:1330–1337. doi: 10.1002/ijc.24078. [DOI] [PubMed] [Google Scholar]
- 70.Bjelogrlic SK, Radic J, Jovic V, Radulovic S. Activity of d,l-alpha-tocopherol (vitamin E) against cardiotoxicity induced by doxorubicin and doxorubicin with cyclophosphamide in mice. Basic Clin. Pharmacol. Toxicol. 2005;97:311–319. doi: 10.1111/j.1742-7843.2005.pto_166.x. [DOI] [PubMed] [Google Scholar]
- 71.Petrelli F, Borgonovo K, Cabiddu M, Lonati V, Barni S. Mortality, leukemic risk, and cardiovascular toxicity of adjuvant anthracycline and taxane chemotherapy in breast cancer: a meta-analysis. Breast Cancer Res. Treat. 2012 doi: 10.1007/s10549-012-2121-6. [DOI] [PubMed] [Google Scholar]
- 72.Efferth T, Giaisi M, Merling A, Krammer PH, Li-Weber M. Artesunate induces ROS9mediated apoptosis in doxorubicin-resistant T leukemia cells. PLoS ONE. 2007;2:e693. doi: 10.1371/journal.pone.0000693. [DOI] [PMC free article] [PubMed] [Google Scholar]
- 73.Vijayaraghavalu S, Peetla C, Lu S, Labhasetwar V. Epigenetic modulation of the biophysical properties of drug-resistant cell lipids to restore drug transport and endocytic functions. Mol. Pharmaceutics. 2012;9:2730–2742. doi: 10.1021/mp300281t. [DOI] [PMC free article] [PubMed] [Google Scholar]
- 74.Gui CY, Ngo L, Xu WS, Richon VM, Marks PA. Histone deacetylase (HDAC) inhibitor activation of p21WAF1 involves changes in promoter-associated proteins, including HDAC1. Proc. Natl. Acad. Sci. U. S. A. 2004;101:1241–1246. doi: 10.1073/pnas.0307708100. [DOI] [PMC free article] [PubMed] [Google Scholar]
- 75.Gray J, Cubitt CL, Zhang S, Chiappori A. Combination of HDAC and topoisomerase inhibitors in small cell lung cancer. Cancer Biol. Ther. 2012;13:614–622. doi: 10.4161/cbt.19848. [DOI] [PMC free article] [PubMed] [Google Scholar]
- 76.Young JI, Sedivy JM, Smith JR. Telomerase expression in normal human fibroblasts stabilizes DNA 5-methylcytosine transferase I. J. Biol. Chem. 2003;278:19904–19908. doi: 10.1074/jbc.M301685200. [DOI] [PubMed] [Google Scholar]
- 77.Melixetian MB, Beryozkina EV, Pavlenko MA, Grinchuk TM. Altered expression of DNA-topoisomerase IIalpha is associated with increased rate of spontaneous polyploidization in etoposide resistant K562 cells. Leuk. Res. 2000;24:831–837. doi: 10.1016/s0145-2126(00)00054-0. [DOI] [PubMed] [Google Scholar]
- 78.Walker JV, Nitiss JL. DNA topoisomerase II as a target for cancer chemotherapy. Cancer Invest. 2002;20:570–589. doi: 10.1081/cnv-120002156. [DOI] [PubMed] [Google Scholar]
- 79.Quan ZW, Yue JN, Li JY, Qin YY, Guo RS, Li SG. Somatostatin elevates topoisomerase II alpha and enhances the cytotoxic effect of doxorubicin on gallbladder cancer cells. Chemotherapy. 2008;54:431–437. doi: 10.1159/000158662. [DOI] [PubMed] [Google Scholar]
- 80.Covey JM, Zaharko DS. Effects of dose and duration of exposure on 5-aza-2'-deoxycytidine cytotoxicity for L1210 leukemia in vitro. Cancer Treat. Rep. 1984;68:1475–1481. [PubMed] [Google Scholar]
- 81.Brown R, Plumb JA. Demethylation of DNA by decitabine in cancer chemotherapy. Expert Rev. Anticancer Ther. 2004;4:501–510. doi: 10.1586/14737140.4.4.501. [DOI] [PubMed] [Google Scholar]
- 82.Parise RA, Holleran JL, Beumer JH, Ramalingam S, Egorin MJ. A liquid chromatography-electrospray ionization tandem mass spectrometric assay for quantitation of the histone deacetylase inhibitor, vorinostat (suberoylanilide hydroxamicacid, SAHA), and its metabolites in human serum. J. Chromatogr. B. Analyt. Technol. Biomed. Life Sci. 2006;840:108–115. doi: 10.1016/j.jchromb.2006.04.044. [DOI] [PubMed] [Google Scholar]
Associated Data
This section collects any data citations, data availability statements, or supplementary materials included in this article.