

Abstract
Studies of actin dynamics at the leading edge of motile cells with single-molecule speckle (SiMS) microscopy have shown a broad distribution of EGFP-actin speckle lifetimes and indicated actin polymerization and depolymerization over an extended region. Other experiments using FRAP with the same EGFP-actin as a probe have suggested, by contrast, that polymerization occurs exclusively at the leading edge. We performed FRAP experiments on XTC cells to compare SiMS to FRAP on the same cell type. We used speckle statistics obtained by SiMS to model the steady-state distribution and kinetics of actin in the lamellipodium. We demonstrate that a model with a single diffuse actin species is in good agreement with FRAP experiments. A model including two species of diffuse actin provides an even better agreement. The second species consists of slowly diffusing oligomers that associate to the F-actin network throughout the lamellipodium or break up into monomers after a characteristic time. Our work motivates studies to test the presence and composition of slowly diffusing actin species that may contribute to local remodeling of the actin network and increase the amount of soluble actin.
Introduction
Lamellipodia are flat protrusions that allow cells to attach, and move across on flat surfaces (see Fig. 1, A and B). This machinery for motility is used by a variety of cells such as white blood cells in the immune system or epithelial cells during wound healing and cell migration (1,2). The lamellipodium is characterized by a brushlike network of actin filaments, with their barbed ends located toward the leading edge of the cell (3). Regulating proteins such as capping protein (CP), Arp2/3 complex, SCAR/WAVE, tropomyosin, and cofilin are also characteristic of lamellipodia. The regulators are controlled through signaling pathways that steer cells from external cues.
Figure 1.
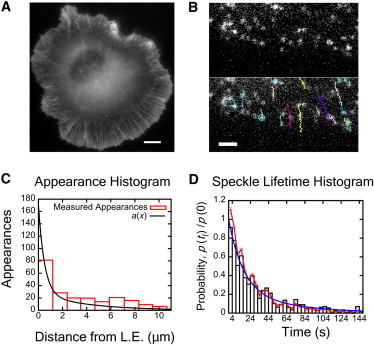
Single-molecule speckle microscopy: actin appearance profile and lifetimes. (A) XTC cell expressing EGFP-actin at high concentrations (29). (Scale bar) 8 μm. (B) Cell expressing EGFP-actin at low concentrations (29). (Top) Individual speckles indicate single actin proteins. (Bottom) Same as top, showing speckle tracks in time. The beginning and end of track (speckle appearance and disappearance) corresponds to polymerization and depolymerization. (Scale bar) 2.65 μm. (C) Appearance events versus distance from the leading edge (9). (Continuous line) Phenomenological double-exponential fit of the data between 0 and 5 μm (appearances beyond 5 μm are in regions of adhesion formation and retrograde-flow-decrease (30) that are not relevant). Fit procedure: Length λ1 was fixed to 0.5 μm and λ2 to 4 μm, values that allowed us to match the intensity profile in Fig. 3; we let the magnitudes A1 and A2 vary. (D) Speckle lifetime distribution (resampled from Smith et al. (29), with and without photobleaching correction) and double-exponential fit. The fit was performed by fixing the long lifetime to be 60 s, a value that does not overrepresent very long-lived speckles, and allowing other parameters to vary.
Many of the actin regulatory proteins have been characterized in vitro, but precisely how they control actin polymerization and depolymerization across the lamellipodium has not been completely resolved. The majority of actin polymerization in lamellipodia occurs near the leading edge. Growing actin filaments push against the lipid membrane while the whole actin network undergoes retrograde flow (1,4). As the network moves toward the body of the cell, F-actin is depolymerized and recycled to be used again. Numerous experiments provide evidence that actin polymerization and depolymerization also occurs throughout the lamellipodium (2): photoactivated labeled actin showed turnover during retrograde flow (5); microinjected fluorescent actin and electron microscopy experiments show barbed ends throughout the lamellipodium (6,7); phalloidin-stabilized neuron growth cones incubated with Alexa-488-G-actin shows incorporation of actin at barbed ends within a 2–3 μm band (8); single-molecule speckle (SiMS) microscopy on XTC cells demonstrates single molecules of actin polymerizing throughout the lamellipodium (9) (Fig. 1 C); quantitative fluorescent speckle microscopy shows turnover of clusters of actin proteins far from the leading edge (10); and cells that are permeabilized and introduced with fluorescent CP demonstrate free barbed ends, or CP binding sites well into (∼5 μm) the lamellipodium (11).
The studies mentioned in the preceding paragraph indicate an extended distribution of barbed-ends across the lamellipodium. However, fluorescent recovery after photobleaching (FRAP) experiments show that significant fluorescence recovery occurs fast near or at the leading edge, while recovery away from the leading edge occurs with a delay followed by a more rapid increase (12–14). A computational model by Lai et al. (12) reproduced the experimental FRAP observations assuming actin polymerization occurs only very close to the leading edge. In this picture, recovery at the back relies on retrograde flow of unbleached monomers from the very front (12,15).
It has been proposed that reassociation of the bleached actin within the bleached area may slow down recovery (2). This has been demonstrated by a reaction diffusion model of actin turnover in a spatially homogenous system without retrograde flow (16–18). However, to our knowledge, the FRAP kinetics in a model that combines actin remodeling throughout the lamellipodium and retrograde flow had not been calculated.
Many previous models of actin in the lamellipodium have considered actin polymerization occurring exclusively at the leading edge (19–22). The G-actin distribution has been studied considering populations of bound or sequestering actin monomers, assuming various combinations of sinks and sources of G-actin (representing polymerization and depolymerization) throughout the lamellipodium (23). Other workers have implemented models that account for well-known reactions at the leading edge, including assembly and disassembly away from leading edge and G-actin diffusion (24–26). However, Novak et al. (23), Huber et al. (24), Ditlev et al. (25), and Stuhrmann et al. (26) did not model FRAP curves. A three-dimensional partial-differential-equation model (20) was used to model FLAP (27), where the fluorescence recovery of one fluorescent species after its photobleaching is measured relative to the other fluorescent species as a reference. This model treated actin monomers and polymers in a solvent but it did not include the effects of actin polymerization away from the leading edge. Another group studied FRAP of CP at the leading edge (28).
In this article, we compare models with actin turnover distributed throughout the lamellipodium to experiments. We performed FRAP experiments on XTC cells, the same cell type used in prior SiMS experiments. While the FRAP recovery in XTC lamellipodia is qualitatively similar to that in other cells (12–14), our models demonstrate that SiMS and FRAP data do not contradict one another.
We compare two different models and show that turnover can occur without causing rapid FRAP recovery away from the leading edge:
The first model uses diffuse actin that polymerizes and depolymerizes as monomers. FRAP curves simulated with this model are good fits to experiments, but have some different qualitative features.
For the second model, we consider two species of diffuse actin that can polymerize and depolymerize throughout the lamellipodium: monomers (G-actin) and oligomers (O-actin). Oligomers are slowly diffusing actin that can anneal to the F-actin network. The presence of a small amount of oligomers further reduces the amount of recovery away from the leading edge in simulated FRAP. The results of this model are in better agreement with both FRAP and SiMS microscopy. We discuss how distributed actin turnover might contribute to the function of the lamellipodium.
The following models use speckle appearance rates and speckle lifetimes from SiMS microscopy (9,29) to compute the steady-state F-actin profile. We consider cells as in Watanabe and Mitchison (9) and Smith et al. (29) that have negligible leading-edge protrusion or retraction (30). The F-actin profile is then used to calculate the steady-state G- and O-actin profiles and the corresponding polymerization rates as function of distance from leading edge. Using these rate constants in a two-dimensional stochastic simulation, we compute the predicted FRAP curves and compare to experimental data.
Results
Two-channel FRAP in XTC cells
We performed FRAP of fluorescently labeled actin in XTC lamellipodia to compare SiMS and FRAP data on the same cell type. For improved accuracy we used two labels, mCherry-actin and EGFP-actin, and bleached the EGFP-actin (Fig. 2 A, and see Movie S1 in the Supporting Material). The recovery was quantified by measuring the channel intensity ratio, as in Zicha et al. (27). This approach gives a better measurement of recovery than single-color FRAP because it allows:
-
1.
Normalization against the intrinsic fluctuations of the system;
-
2.
Monitoring of system behavior for very long times; and
-
3.
Tracking the position of the leading edge in the unbleached channel.
Figure 2.
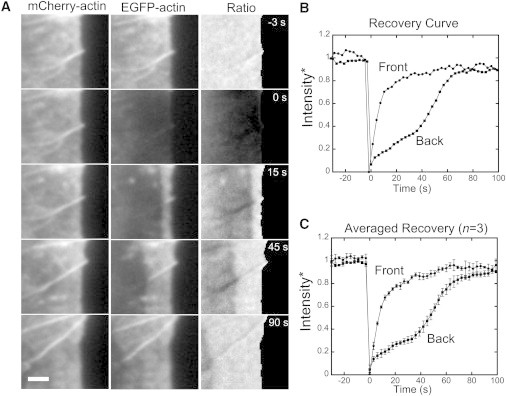
Two-color FRAP experiments on XTC fibroblasts. (A) mCherry-actin and EGFP-actin channels of a lamellipodium segment from Movie S1, and their ratio. EGFP-actin is bleached at t = 0 s. Retrograde flow speed: 0.050 ± 0.005 μm/s. The leading edge of the mCherry channel was tracked using an active contour (30). Image ratio for pixels to the right of the contour set to zero. (Scale bar) 2 μm (B) Recovery of normalized image ratio in the segment of cell in panel A (see Section 4 in the Supporting Material). Front and back measurements are averages over 0–0.5 μm and 2.5–3 μm from the leading edge. (C) Averaged recovery from three separate movies that met our criteria (main text, and see the Supporting Material). Average retrograde flow speed, 0.056 μm/s. (Error bars) SD.
For the analysis, we cropped the bleached region, tracked the leading edge of bleached cells, and measured the retrograde flow (see the Supporting Material). We chose three cells that had retrograde-flow speeds 0.05–0.06 μm/s and a leading edge that moves <0.6 μm during recovery. These retrograde-flow speeds were a bit smaller compared to 0.063 μm/s in prior FRAP experiments (12) but somewhat larger than in prior SiMS experiments: 0.025 μm/s in Watanabe and Mitchison (9) and 0.017 μm/s in Smith et al. (29). The normalized intensity recovery at 0–0.5 μm (front) and 2.5–3.0 μm (back) from the leading edge is shown in Fig. 2 B (single cell) and Fig. 2 C (average of three cells). Similar to FRAP in other cell types (12–14), we find recovery away from the leading edge occurs with a delay followed by a more rapid increase.
F-actin profile based on speckle statistics
We used the statistics of single molecules of labeled actin obtained in previous studies of XTC cells (Fig. 1) (9,29) as an input to our model. The location of speckle-appearance events correspond to polymerization and yield an appearance rate, a(x), as function of distance from leading-edge x (Fig. 1 C) (9). The units of a are μM/s. To obtain an analytical form for a(x), we approximate the appearance curve with a double-exponential:
| (1) |
The shorter length, λ1, corresponds to polymerization at the leading edge while the longer length scale, λ2, corresponds to basal polymerization that occurs throughout the lamellipodium. This equation is a phenomenological fit chosen for two reasons: it captures the experimental data, and it yields analytical results in later calculations. The total rate of appearance is scaled in proportion to the cytoplasmic concentration of labeled actin monomers far from the leading edge, G∞. For convenience, we pick A1+A2 = 1, so K can be used as a parameter that adjusts the total rate of polymerization and the resulting F-actin/G-actin (F/G) ratio. The fit gives A1 = 0.84, A2 = 0.16, λ1= 0.5 μm, and λ2 = 4 μm (Fig. 1 C). While the bin size for appearance data is comparable to λ1, we show later that the distribution of appearance events within the first 0.5 μm of the leading edge is not crucial for this study. What is more important is the total number of speckles in the first bin.
Measurements of the speckle lifetime distribution in Fig. 1 D, p(tl), give the probability distribution of the amount of time tl that each actin subunit spends as F-actin. The lifetime distribution is approximately constant within the first 3-μm from the leading edge (9), which is also true for the data in Smith et al. (29) (not shown here). We approximate the lifetime distribution with a double-exponential,
| (2) |
where C1 = 0.741, C2 = 0.259, τ1= 16 s, and τ2 = 60 s. We chose exponentials because they capture the lifetime distribution well. They are also mathematically convenient because they allow use of exponential statistics in simulations and enable our obtaining analytical results for validating the simulations.
The velocity of retrograde flow vr provides the remaining parameter necessary to construct an F-actin profile represented by the speckle statistics. Using the appearance rate a(x) as a source of F-actin yields the steady-state concentration profile F(x):
| (3) |
The profile Y(x, x′) generated by a point source at x′ is obtained by considering the amount of subunits that have a longer lifetime than the time it took to travel from x′ to x via retrograde flow,
| (4) |
where the prefactor is found by balancing the amount due to retrograde flow out of x′ with the amount created by the point source.
Retrograde flow rate is approximately constant within the first 4-μm from the leading edge of XTC cells (30). Because we are interested in FRAP recovery within the first 3-μm, we do not consider variations in retrograde flow.
G-actin profile considering monomers as the only diffuse actin species
As a first model, we consider that actin exists in two states: F-actin that undergoes retrograde flow, and G-actin with diffusion coefficient D = 4 μm2/s (17,27,31,32) (we also varied the value of D in Fig. S4 in the Supporting Material). G-actin diffuses freely, polymerizing to become F-actin with rate a(x) (Fig. 3 A). At steady state, both retrograde flux of F-actin and diffusive flux of G-actin balance the local exchange between F- and G-actin,
| (5) |
where G(x) is the G-actin concentration. Knowing F(x) from Eq. 3, we can solve Eq. 5 for the G-actin profile:
| (6) |
The resulting steady-state profiles are plotted in Fig. 3 B, normalized to the G-actin concentration far from the leading edge, G∞. The value of parameter K determines the F/G ratio because it changes the magnitude (but not the shape) of the F-actin profile (Eqs. 1–3, and see Section 1 in the Supporting Material). By increasing K, the G-actin depletion near the leading edge is increased (Fig. 3 B). Increasing the value of the retrograde flow velocity causes a greater depletion of G-actin (not shown). The requirement that G(x) remains positive restricts the possible values of K, vr, and G∞ and the maximum possible value of the F/G ratio,
where L is characteristic lamellipodium width. Values of the F/G ratio are in the range 2–10 (2,33–35) and the graphs in Fig. 3 show that the model can account for these measurements.
Figure 3.
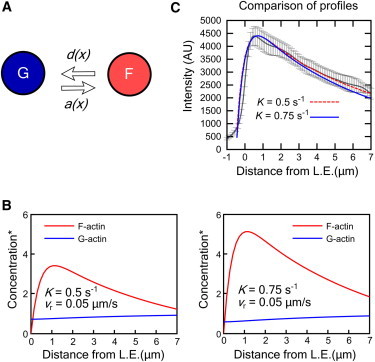
Steady-state profile in model with G-actin monomers as only diffuse actin species. (A) F- and G-actin states and transition rates. (B) Steady-state profiles of F- and G-actin for two different K values, which determine the F/G ratio. The retrograde flow speed 0.05 μm/s was chosen to compare to the profile of the cell in Fig. 2A. Concentration is normalized to G∞. We do not try to capture the exact position of the maximum of the F-actin profile that occurs within the first 1-μm from leading edge; this feature depends on the precise value of parameter λ1. (C) Comparison of simulated total actin concentration profile from panel B to the mCherry-actin intensity profile of Fig. 2A. Distance from leading edge measured by the fitted active contour. Negative distances are to the side of the contour outside the cell. (Error bars) SD over whole movie.
The F- and G-actin profiles in Fig. 3 B show the depletion of G-actin near the leading edge. The total profile is similar to the experimental profile of the mCherry channel in Fig. 2 A, as shown in Fig. 3 C. The profile becomes wider for larger values of the retrograde flow rate. Plots of the disappearance rate d(x), namely the rate with which F-actin becomes G-actin at steady state, show a peak between 1 and 2 μm away from the leading edge (see Fig. S1 C), similar to (24,26). The F-actin profile and d(x) are the same for the two models we consider in this article because they are determined by the measured appearance rate, retrograde flow, and speckle lifetimes.
Particle simulation with monomers as the only diffuse actin species
To calculate FRAP recovery curves in the monomer-only model, we assume that the appearance rate is proportional to the local G-actin concentration. The transition rate at which monomers convert to F-actin is
| (7) |
Fig. 4 A shows the calculated G→F transition rate using the measured a(x) and G(x) from Eqs. 1 and 6. Estimated values for the concentration of barbed ends are [B] ≈ 1 μM (2). In this model we expect the transition rate to be proportional to the local concentration of free barbed ends. Using rG→F = k+[B], we find the rate constant close to the leading edge is k+ ≈ 0.6 μM−1 s−1, consistent with previous estimates (2).
Figure 4.
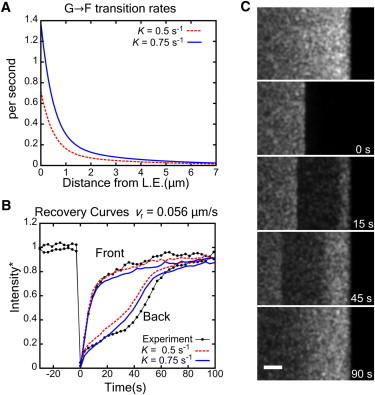
Simulated FRAP results in model with monomers as only diffuse actin species. (A) Calculated monomer transition rate as a function of distance from the leading edge for two different F/G values (vr = 0.056 μm/s as in the average of Fig. 2C). (B) Comparison of simulated recovery curves to experiment of Fig. 2C at 0–0.5 μm (front) and 2.5–3 μm (back) from leading edge, for two K values. Simulated intensities are normalized to the steady-state value at the bleached position and approach 1 at sufficiently long times. (C) Image of simulated FRAP. Size of bleached region 5 × 20 μm and K = 0.5 s−1, vr = 0.056 μm/s. Simulated exposure 500 ms/frame with 2500-ms lag between frames. (Bar) 2 μm.
Equation 7 contains an implicit relationship among polymerization-rate constant, F/G ratio, retrograde flow rate, and G∞. This is a condition required for self-consistency of the model at steady state. It should not be used to infer a dependency between only two variables. For example, reducing cofilin concentration by shRNA decreases the retrograde flow rate (13) but Eq. 7 cannot be used in isolation to infer that this must also change the polymerization rate; such a perturbation may also decrease the G-actin pool and modify the F-actin lifetimes.
We used the transition rate, rG→F(x), in an off-lattice two-dimensional Monte Carlo simulation to simulate the reaction and diffusion of individual actin subunits in the lamellipodium (a rectangle 40-μm-wide, with reflecting boundaries, extending 60-μm into the cell). Each subunit is either diffusing (G-actin) or undergoing retrograde flow (F-actin). Subunits are updated every time-step Δt, chosen to be sufficiently small, 1 ms or smaller. The distance traveled by diffusing monomers within Δt is picked from the two-dimensional Gaussian diffusion propagator. After the monomer is moved, it is checked for association to the F-actin in the lamellipodium, which occurs with probability rG→F(x)Δt. When a monomer transitions to F-actin, its lifetime is picked from the lifetime distribution p(tl), see Section 3 in the Supporting Material. The positions of F-actin subunits are updated by moving them in the direction of retrograde flow by distance vrΔt. If they reach the boundary, they are converted back into G-actin (the size of the system was chosen to be large enough to make this a rare event). After an F-actin subunit is moved, its lifetime is compared to the time elapsed since polymerization, to check if it should depolymerize and become G-actin.
The system was initialized at steady state by using the concentration profiles obtained from the Eqs. 3 and 6. The lifetimes of the particles in the initial distribution were picked by applying Bayes’ rule (see Section 3 in the Supporting Material). The resulting initial distributions of F- and G-actin subunits maintain the calculated steady-state distributions, validating the simulations (see Fig. S2).
To simulate images, the particles are treated as diffraction-limited spots that diffuse during camera exposure (29). The position of each particle is updated and exposed throughout the exposure time, ∼106 times per exposure, to produce a simulated lamellipodium image. Bleached particles are removed from the simulation and do not contribute to intensity.
FRAP recovery in model with monomers as the only diffuse actin species
A simulated FRAP image is shown in Fig. 4 C and Movie S2 where a region of size 5 × 20 μm is bleached near the leading edge. Fig. 4 B shows the recovery of intensity at two strips between 0 and 0.5 μm, and 2.5–3 μm (front and back) from the leading edge. Overall, the recovery curves are similar to the recovery curves seen in experiments (Fig. 2), with fast recovery at the front and slower recovery at the back. The value K = 0.7 s−1 gives the best least-squares fit (Fig. S3).
Recovery at the front involves three stages:
Stage 1. Unbleached G-actin diffusion to the leading edge within ∼2 s, assuming free diffusion (see the discussion on inhibited diffusion below).
Stage 2. The F-actin increases until a balance is established between polymerization of G-actin and removal of F-actin by retrograde flow away from the leading-edge region and depolymerization. Because the time it takes for an F-actin subunit to be carried away from the front region, 0.5 μm/vr = 8.9 s, and because the average speckle lifetime is 27 s (see Eq. S11 in the Supporting Material and Eq. 2), retrograde flow is the dominant removal mechanism of F-actin close to the leading edge. Thus this second stage completes in ∼9 s.
Stage 3. There is a slow recovery due to the algebraic tail of the G-actin diffusion (see also Fig. S4) while the local F/G ratio remains approximately constant.
Recovery at the rear is slower than at the front. There is a small but important qualitative difference between the shapes of the simulated and experimental recovery curves in Fig. 4 B. In the experimental data there is a plateau in the recovery between 20 and 40 s, just before retrograde flow carries fresh monomers from very close to the leading edge into the region. This plateau also occurred in the FRAP results in Lai et al. (12). In the simulations, recovery at the back involves G-actin diffusion into the bleached region, G-actin transitioning to F-actin (that occurs over 1/rG→F ≈ 10 s, see Fig. 4 A), and retrograde flow carrying unbleached subunits to the rear. In the simulations, retrograde flow carries unbleached monomers from the very front to the back in 47 s and causes an abrupt increase in slope. However, the intensity at the back has already started to recover at earlier times due to the basal polymerization.
It has been shown that a high F/G ratio can cause a delay in FRAP because association of G-actin into F-actin hinders the diffusion of G-actin into the bleached region (16). This effect becomes important when the typical distance traveled by G-actin before reassociation to F-actin (23),
becomes comparable to the size of the bleached region. In Fig. 4 A, increasing K increases rG→F. To estimate s, we use rG→F at the midpoint of the bleached region. For K = 0.5 s−1, we find s = 16 μm and for K = 0.75 s−1, s = 12.6 μm, values that are larger than the width of the bleached region. Thus while hindered diffusion has an effect on the recovery in Fig. 4, it cannot fully account for slow recovery at the back in experiments. To explore this concept further, we look at the consequence of changing the diffusion coefficient, D (see Fig. S4). Changing D changes the G-actin distribution, causing a larger G-actin depletion near the leading edge for smaller D values. When D = 6 μm2/s, s = 16 μm and the shapes of the recovery curves in Fig. S4 C are qualitatively similar to Fig. 4 B. When D = 2 μm2/s, s = 4.8 μm and we see a much stronger delay in both front and back recovery. A remarkable feature of the D = 2 μm2/s case is that the recovery at the front is slowed much more than the recovery at the rear. This indicates that hindered diffusion cannot explain both the slow recovery at the rear and the fast recovery at the front in Fig. 2.
We also considered the effects of having a longer lifetime, τ2 (see Fig. S5), and found that it slows recovery, but it would have to increase significantly compared to the measured values (Fig. 1 D). The factor that changed the shape of the back recovery the most was λ2, which determines how far into the lamellipodium polymerization occurs. By reducing λ2 close to λ1 we get recovery curves more similar to a leading-edge-polymerization-only model, but this is equivalent to assuming negligible polymerization away from the leading edge. Further narrowing the polymerization region near the leading edge by reducing λ1 (see Fig. S7) could partially contribute to a sigmoidal back-recovery.
The discrepancy in the back-recovery curves between model and experiment is small, but it illustrates the difference between a treadmilling-type model and a model with remodeling further away from the leading edge. Another small discrepancy is that the simulated recovery at the front has a slower tail compared to experiment.
We did not explicitly account for the fact that G-actin monomers can carry different types of nucleotide (ADP or ATP), or that monomers can be bound to profilin, thymosin, or cofilin. We assumed that the reactions among these different states occur fast enough to be considered quasistatic and also do not modify the diffusion coefficient of bound G-actin (23). Thus, the values of rate constants represent the average behavior of the G-actin pool. If there is a time that must elapse before a depolymerized monomer is able to repolymerize, this delay would not modify the shape of the FRAP curves qualitatively (this would be similar to using a higher K; see Fig. 4 B and Fig. S10).
The results in Fig. 4 indicate that a model which only includes monomers as the diffuse actin species cannot account for some qualitative features of FRAP results. In the next section we examine the possibility that appearance events in SiMS microscopy are caused by both G-actin and slowly diffusing actin oligomers.
Model with both monomers and oligomers contributing to appearance events
Several works suggest actin oligomers are present in the lamellipodium. Cofilin causes severing of actin filaments (36–39) and the Arp2/3 complex nucleates actin filaments that can debranch in vitro (40,41). The short lifetimes of CP speckles in lamellipodia, which depend on cofilin-catalyzed, jasplakinolide-sensitive actin disassembly, indicate severing of capped filaments (11). Oligomer annealing (42,43), possibly involving Aip1-capped filaments (44–46), could be a mechanism for structural reorganization of actin filaments in the lamellipodium (11,46). This could assist the change from a densely branched network near the leading edge to a network of longer filaments further away (3). However, a different picture has been discussed after recent cryoelectron microscopy experiments (47–50).
Oligomer generation and annealing would be consistent with SiMS observations. Oligomers with diffusion coefficient DO ≈ 0.5 μm2/s and a fluorescent subunit would appear as background noise during exposure in SiMS experiments (29). If they anneal to the network, they would contribute to speckle-appearance events in SiMS experiments. When they dissociate from the network (via severing or debranching) they would contribute to speckle disappearances. Because the diffusion coefficient in the cytoplasm decreases with increasing molecular weight of the protein complex (51), such DO values may represent fragments of ∼10 actin subunits or less.
In the model shown in Fig. 5 A, G-actin monomers can associate into F-actin and F-actin subunits depolymerize into O-actin. Subunits of O-actin can become F-actin or disassemble to G-actin with an average lifetime τO. O-actin is a slowly diffusing species of actin with a different appearance profile than G-actin (Fig. 5 B). The total appearance rate is separated into oligomers, aO(x), and monomers, aG(x), with a(x) = aO(x) + aG(x). We assume O-actin accounts for a majority of appearance events away from the leading edge while G-actin polymerization contributes to most events close to the leading edge. Given the evidence for barbed ends throughout the lamellipodium, we expect both O- and G- actin to associate away from the leading edge. Here we examine a limiting case to illustrate how much of an effect oligomer-based remodeling has on FRAP. The relative G- and O-actin contribution to appearances is considered in the Discussion.
Figure 5.
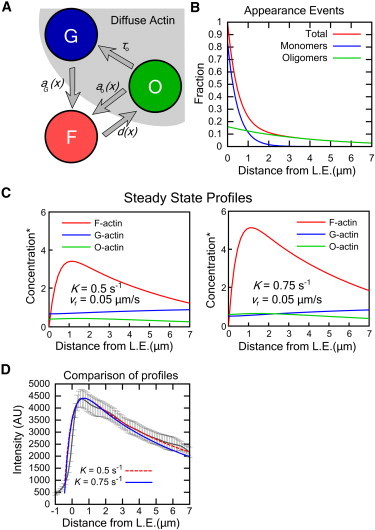
Speckle statistics used to create a steady-state profile in a model with both G-actin and actin oligomers (O-actin) as diffuse species. (A) F-, G-, and O-actin states and transition rates. (B) Appearance-events broken into monomers and oligomers. We consider the limit where speckle appearance events far from the leading edge are primarily due to oligomers while monomers dominate appearances within the first 1 μm. (C) Steady-state profiles for two different K values (τ0 = 20 s, DO = 0.5 μm2/s, vr = 0.05 μm/s). Concentration is normalized to G∞. (D) Comparison of simulated total actin concentration profile from panel C to the mCherry-actin intensity profile as in Fig. 3C.
We use the speckle-appearance rates and lifetime distributions to calculate the steady-state profiles. At steady state, similar to Eq. 5,
| (8) |
| (9) |
| (10) |
where DG = 4 μm2/s and DO are the G- and O-actin diffusion coefficients. The F-actin profile is given by the same expression as in Eq. 3, so we can substitute in Eq. 8 to solve for d(x), which leads to O(x) through Eq. 10,
| (11) |
where . The G-actin profile can then be solved similar to the monomer model, using Eq. 10:
| (12) |
Examples of calculated profiles are shown in Fig. 5 C, where we used DO = 0.5 μm2/s and τO = 20 s. The total amount of O-actin can be quite low compared to the amount of F- and G-actin, while still making a contribution to the total appearance rate.
FRAP simulations using O-, G-, and F-actin
The O- and G-actin binding rates were obtained from the steady-state profiles (Fig. 6 A),
Using these rates, we performed stochastic particle simulations to produce images of simulated FRAP (Fig. 6 C and see Movie S3), as in the monomer-only model. Good fits were obtained for K = 0.4–0.9 s−1, DO < 1 μm2/s, and τO < 60 s (see Fig. S3, Fig. S8, and Fig. S9) without the need to modify the appearance profile or actin lifetimes. The new model captures two features of the experiment in Fig. 2 that the monomer-only model did not:
-
1.
Recovery away from the leading edge (Fig. 6 B) is slower than the recovery in the monomer-only model (Fig. 4 B). The resulting FRAP curve at the back does not show significant recovery until retrograde flow carries monomers from the leading edge into the back region. For the chosen parameters, oligomers do not diffuse into the bleached region before retrograde flow transports monomers from the leading edge into the region. Two factors contribute: The time required to travel a distance of ∼3 μm by free oligomer diffusion is ∼10 s, but this is slowed down by rebinding of O-actin within the bleached region (16) because and the generation of a new O-actin subunit, from unbleached monomers that polymerize at the leading edge, requires times of approximately the average speckle-lifetime.
-
2.
The recovery at the leading edge (Fig. 6 B) does not have a significant long tail and is similar to Fig. 2 C, even with the higher K value. The tail in the front recovery curve in Fig. 4 C for K = 0.75 s−1 was due to hindered diffusion (16). In the model with oligomers, the region of G-actin polymerization is narrow, and this effect is reduced in magnitude.
Figure 6.
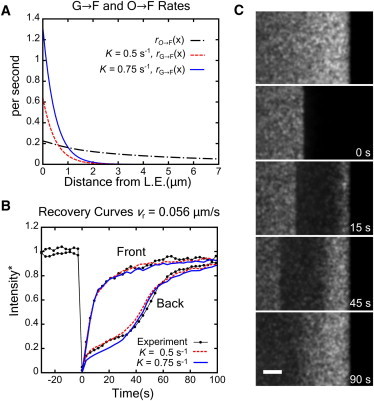
FRAP in model with both G-actin and O-actin as diffuse species (τ0 = 20 s, DO = 0.5 μm2/s, vr = 0.056 μm/s as in the average of Fig. 2C) shows better agreement with experiment. (A) Calculated transition rates as function of distance from the leading edge for two K values. The two O→F curves can be shown to be identical. (B) Comparison of simulated recovery curves to experiment of Fig. 2C at 0–0.5 μm (front) and 2.5–3 μm (back) from leading edge, for two K values. (C) Image of simulated FRAP (as in Fig. 4C) for K = 0.5 s−1. (Bar) 2 μm.
The above results support models that include annealing and severing in the lamellipodium (21,24). They indicate that SiMS results are consistent with FRAP data, and may also reveal the kinetics of a population of actin not previously characterized in cells.
Discussion
We used modeling and performed new experiments to show that SiMS and FRAP experiments are not in contradiction with one another and their combination provides information on the actin-remodeling kinetics at the lamellipodium. A model in which all diffuse actin species are identical and have a single diffusion coefficient predicts a slow, continuous recovery at the back of the lamellipodium—an outcome somewhat different than that depicted in the experiment in Fig. 2, which shows a two-stage recovery process. One possible contributor to this small discrepancy could be the bright illumination required for photobleaching that may change the kinetics of the actin in the lamellipodium (we found that very bright illumination sometimes triggers cell-edge retraction).
Here we showed another possibility: a model with both monomers and oligomers (G- and O-actin) which agrees with both basal remodeling and two-stage FRAP recovery at the back of the lamellipodium. This agreement requires that O-actin has a diffusion coefficient ∼10-times smaller than G-actin, which can occur if oligomers consist of a few actin monomers or if they are associated with proteins such as Arp2/3 complex, Aip1, CP protein, or VASP tetramers, which bind to multiple actin monomers and to the sides of filaments (52,53). In the model, we did not distinguish between lamellipodium and lamella (54) because in lamellipodia of XTC cells, both short-lived and long-lived speckles move with the same retrograde flow-speed (S. Yamashiro, H. Mizuno, M. B. Smith, G. L. Ryan, D. Vavylonis, N. Watanabe, unpublished).
In the model with oligomers, we assumed that the speckle-appearance rate a(x) within 1-μm of the leading edge is mostly coming from monomers (Fig. 5 B). The appearance rate is the sum of the products of the G→F and O→F transition rates with the local G- and O-actin concentrations. For the parameters of Figs. 5 and 6, we found that this leads to O-actin to assemble with smaller rate constants at the very front (Fig. 6 A). This is a reasonable result because it may be harder for O-actin to assemble at barbed ends pushing against the membrane, although a recent experimental study suggests O-actin polymerization occurs at the leading edge (56). In some simulations where the O→F and G→F rate constants at the leading edge were similar, as in Fig. S8 A where τO = 5 s, the resulting FRAP recovery was similar to Fig. 5 B.
In the model with oligomers, we also assumed the speckle-appearance rate a(x) away from the leading edge is primarily due to O-actin (Fig. 5 B). We have explored the contribution of both G- and O-actin to the appearances in the basal region by breaking the second term of Eq. 1 into two parts, A2 = (1−f)A2 + fA2. The (1-f)A2 term is the portion of G-actin appearances while fA2 corresponds to the O-actin contribution. The predicted recovery curves as a function of f are shown in Fig. S10. This figure demonstrates that G-actin appearance events away from the leading edge increase the rate of recovery away from the leading edge. Because both monomers and oligomers would bind to free barbed ends, an intermediate f value could be more realistic.
A possible origin for differences between G- and O-actin association rates might be that O-actin has more binding sites away from the leading edge (e.g., filament sides). Also, free barbed ends of severed filaments located away from the leading edge could be protected by Aip1 that exists at 1.8 μM at the leading edge (46). Experiments using cells permeabilized by CP have demonstrated an abundance of free barbed ends throughout the lamellipodium (11). These experiments might label free barbed ends that were protected by Aip1 that dissociated during preparation. This would be consistent with the live cell observations that show Aip1 speckles dissociating at 1 s−1 (46) and CP in a narrow region close to the leading edge. A maximal estimated rate of Aip1 capping, ∼1.8 μM/s, may, however, fall short of the anticipated oligomer generation rate of order 0.2G∞K ∼ 10 μM/s in the basal region (see Fig. S1 C). Another reason G-actin might associate more slowly in the basal region is the presence of sequestering proteins, such as thymosin-β4.
Distributed turnover within the lamellipodium is expected to influence its mechanical properties such as substrate adherence and force production. Oligomers in the lamellipodium could further serve multiple purposes. Control of actin assembly relies on nucleating proteins activated at the leading edge. This leads to autocatalytic polymerization regulated by capping. While this mechanism allows fast response, it consumes energy and may result in misoriented branches. Instead of disassembling branches into monomers, it may be energetically efficient to recycle these segments. Annealing those segments to filaments growing in the preferred direction may provide a geometrical feedback to turn a random branched structure into a polarized network. Another function could be regulation of soluble actin. Due to their slow diffusion coefficient, oligomers may accumulate near the leading edge (Fig. S9 A and B). Recent experiments showed higher G-actin concentration at the leading edge of growth cones, measured by DNase1 binding (8). Our work suggests a possible explanation for this increase; we offer this idea in addition to that of convective flow, as already put forth in the literature (27,57,58).
Our model motivates experiments to look for the presence of oligomers and measure their characteristics, for example τO and DO. These parameters influence the amount of blurring of the edges at the boundary of the bleached region. This blurring is hard to detect (see Fig. 6 C), however, because oligomers are predicted to be a small fraction of the total actin. Fast acquisition (∼10 ms/frame) SiMS experiments could provide some of these details by tracking actual diffusing particles to measure their lifetime and diffusion coefficient (29).
Acknowledgments
MBS, NW and DV developed the model. MBS performed analytical and numerical calculations with input from DV and NW. TK performed experiments. All authors designed research, analyzed data and wrote the article.
This work was supported by Human Frontiers Science Program grant No. RGP0061/2009-C (to N.W. and D.V.) and NEXT program grant No. LS013 from the Japan Society for the Promotion of Science (to N.W.).
Supporting Material
References
- 1.Pollard T.D., Cooper J.A. Actin, a central player in cell shape and movement. Science. 2009;326:1208–1212. doi: 10.1126/science.1175862. [DOI] [PMC free article] [PubMed] [Google Scholar]
- 2.Watanabe N. Inside view of cell locomotion through single-molecule: fast F-/G-actin cycle and G-actin regulation of polymer restoration. Proc. Jpn. Acad. B. 2010;86:62–83. doi: 10.2183/pjab.86.62. [DOI] [PMC free article] [PubMed] [Google Scholar]
- 3.Svitkina T.M., Verkhovsky A.B., Borisy G.G. Analysis of the actin-myosin II system in fish epidermal keratocytes: mechanism of cell body translocation. J. Cell Biol. 1997;139:397–415. doi: 10.1083/jcb.139.2.397. [DOI] [PMC free article] [PubMed] [Google Scholar]
- 4.Ridley A.J., Schwartz M.A., Horwitz A.R. Cell migration: integrating signals from front to back. Science. 2003;302:1704–1709. doi: 10.1126/science.1092053. [DOI] [PubMed] [Google Scholar]
- 5.Theriot J.A., Mitchison T.J. Actin microfilament dynamics in locomoting cells. Nature. 1991;352:126–131. doi: 10.1038/352126a0. [DOI] [PubMed] [Google Scholar]
- 6.Bailly M., Macaluso F., Condeelis J.S. Relationship between Arp2/3 complex and the barbed ends of actin filaments at the leading edge of carcinoma cells after epidermal growth factor stimulation. J. Cell Biol. 1999;145:331–345. doi: 10.1083/jcb.145.2.331. [DOI] [PMC free article] [PubMed] [Google Scholar]
- 7.Chan A.Y., Raft S., Condeelis J.S. EGF stimulates an increase in actin nucleation and filament number at the leading edge of the lamellipod in mammary adenocarcinoma cells. J. Cell Sci. 1998;111:199–211. doi: 10.1242/jcs.111.2.199. [DOI] [PubMed] [Google Scholar]
- 8.van Goor D., Hyland C., Forscher P. The role of actin turnover in retrograde actin network flow in neuronal growth cones. PLoS ONE. 2012;7:e30959. doi: 10.1371/journal.pone.0030959. [DOI] [PMC free article] [PubMed] [Google Scholar]
- 9.Watanabe N., Mitchison T.J. Single-molecule speckle analysis of actin filament turnover in lamellipodia. Science. 2002;295:1083–1086. doi: 10.1126/science.1067470. [DOI] [PubMed] [Google Scholar]
- 10.Ponti A., Matov A., Danuser G. Periodic patterns of actin turnover in lamellipodia and lamellae of migrating epithelial cells analyzed by quantitative fluorescent speckle microscopy. Biophys. J. 2005;89:3456–3469. doi: 10.1529/biophysj.104.058701. [DOI] [PMC free article] [PubMed] [Google Scholar]
- 11.Miyoshi T., Tsuji T., Watanabe N. Actin turnover-dependent fast dissociation of capping protein in the dendritic nucleation actin network: evidence of frequent filament severing. J. Cell Biol. 2006;175:947–955. doi: 10.1083/jcb.200604176. [DOI] [PMC free article] [PubMed] [Google Scholar]
- 12.Lai F.P., Szczodrak M., Rottner K. Arp2/3 complex interactions and actin network turnover in lamellipodia. EMBO J. 2008;27:982–992. doi: 10.1038/emboj.2008.34. [DOI] [PMC free article] [PubMed] [Google Scholar]
- 13.Ohashi K., Fujiwara S., Mizuno K. LIM kinase has a dual role in regulating lamellipodium extension by decelerating the rate of actin retrograde flow and the rate of actin polymerization. J. Biol. Chem. 2011;286:36340–36351. doi: 10.1074/jbc.M111.259135. [DOI] [PMC free article] [PubMed] [Google Scholar]
- 14.Hotulainen P., Paunola E., Lappalainen P. Actin-depolymerizing factor and cofilin-1 play overlapping roles in promoting rapid F-actin depolymerization in mammalian nonmuscle cells. Mol. Biol. Cell. 2005;16:649–664. doi: 10.1091/mbc.E04-07-0555. [DOI] [PMC free article] [PubMed] [Google Scholar]
- 15.Le Clainche C., Carlier M.F. Regulation of actin assembly associated with protrusion and adhesion in cell migration. Physiol. Rev. 2008;88:489–513. doi: 10.1152/physrev.00021.2007. [DOI] [PubMed] [Google Scholar]
- 16.Tardy Y., McGrath J.L., Dewey C.F. Interpreting photoactivated fluorescence microscopy measurements of steady-state actin dynamics. Biophys. J. 1995;69:1674–1682. doi: 10.1016/S0006-3495(95)80085-8. [DOI] [PMC free article] [PubMed] [Google Scholar]
- 17.McGrath J.L., Tardy Y., Hartwig J.H. Simultaneous measurements of actin filament turnover, filament fraction, and monomer diffusion in endothelial cells. Biophys. J. 1998;75:2070–2078. doi: 10.1016/S0006-3495(98)77649-0. [DOI] [PMC free article] [PubMed] [Google Scholar]
- 18.Carrero G., Crawford E., de Vries G. Characterizing fluorescence recovery curves for nuclear proteins undergoing binding events. Bull. Math. Biol. 2004;66:1515–1545. doi: 10.1016/j.bulm.2004.02.005. [DOI] [PubMed] [Google Scholar]
- 19.Mogilner A., Edelstein-Keshet L. Regulation of actin dynamics in rapidly moving cells: a quantitative analysis. Biophys. J. 2002;83:1237–1258. doi: 10.1016/S0006-3495(02)73897-6. [DOI] [PMC free article] [PubMed] [Google Scholar]
- 20.Kuznetsov I.R., Herant M., Dembo M. Analysis of actin FLAP dynamics in the leading lamella. PLoS ONE. 2010;5:e10082. doi: 10.1371/journal.pone.0010082. [DOI] [PMC free article] [PubMed] [Google Scholar]
- 21.Michalski P.J., Carlsson A.E. The effects of filament aging and annealing on a model lamellipodium undergoing disassembly by severing. Phys. Biol. 2010;7:026004. doi: 10.1088/1478-3975/7/2/026004. [DOI] [PMC free article] [PubMed] [Google Scholar]
- 22.Schreiber C.H., Stewart M., Duke T. Simulation of cell motility that reproduces the force-velocity relationship. Proc. Natl. Acad. Sci. USA. 2010;107:9141–9146. doi: 10.1073/pnas.1002538107. [DOI] [PMC free article] [PubMed] [Google Scholar]
- 23.Novak I.L., Slepchenko B.M., Mogilner A. Quantitative analysis of G-actin transport in motile cells. Biophys. J. 2008;95:1627–1638. doi: 10.1529/biophysj.108.130096. [DOI] [PMC free article] [PubMed] [Google Scholar]
- 24.Huber F., Käs J., Stuhrmann B. Growing actin networks form lamellipodium and lamellum by self-assembly. Biophys. J. 2008;95:5508–5523. doi: 10.1529/biophysj.108.134817. [DOI] [PMC free article] [PubMed] [Google Scholar]
- 25.Ditlev J.A., Vacanti N.M., Loew L.M. An open model of actin dendritic nucleation. Biophys. J. 2009;96:3529–3542. doi: 10.1016/j.bpj.2009.01.037. [DOI] [PMC free article] [PubMed] [Google Scholar]
- 26.Stuhrmann B., Huber F., Käs J. Robust organizational principles of protrusive biopolymer networks in migrating living cells. PLoS ONE. 2011;6:e14471. doi: 10.1371/journal.pone.0014471. [DOI] [PMC free article] [PubMed] [Google Scholar]
- 27.Zicha D., Dobbie I.M., Dunn G.A. Rapid actin transport during cell protrusion. Science. 2003;300:142–145. doi: 10.1126/science.1082026. [DOI] [PubMed] [Google Scholar]
- 28.Kapustina M., Vitriol E., Jacobson K. Modeling capping protein FRAP and CALI experiments reveals in vivo regulation of actin dynamics. Cytoskeleton (Hoboken) 2010;67:519–534. doi: 10.1002/cm.20463. [DOI] [PMC free article] [PubMed] [Google Scholar]
- 29.Smith M.B., Karatekin E., Vavylonis D. Interactive, computer-assisted tracking of speckle trajectories in fluorescence microscopy: application to actin polymerization and membrane fusion. Biophys. J. 2011;101:1794–1804. doi: 10.1016/j.bpj.2011.09.007. [DOI] [PMC free article] [PubMed] [Google Scholar]
- 30.Ryan G.L., Petroccia H.M., Vavylonis D. Excitable actin dynamics in lamellipodial protrusion and retraction. Biophys. J. 2012;102:1493–1502. doi: 10.1016/j.bpj.2012.03.005. [DOI] [PMC free article] [PubMed] [Google Scholar]
- 31.Engelke H., Heinrich D., Rädler J.O. Probing GFP-actin diffusion in living cells using fluorescence correlation spectroscopy. Phys. Biol. 2010;7:046014. doi: 10.1088/1478-3975/7/4/046014. [DOI] [PubMed] [Google Scholar]
- 32.Kiuchi T., Nagai T., Mizuno K. Measurements of spatiotemporal changes in G-actin concentration reveal its effect on stimulus-induced actin assembly and lamellipodium extension. J. Cell Biol. 2011;193:365–380. doi: 10.1083/jcb.201101035. [DOI] [PMC free article] [PubMed] [Google Scholar]
- 33.Abraham V.C., Krishnamurthi V., Lanni F. The actin-based nanomachine at the leading edge of migrating cells. Biophys. J. 1999;77:1721–1732. doi: 10.1016/S0006-3495(99)77018-9. [DOI] [PMC free article] [PubMed] [Google Scholar]
- 34.Koestler S.A., Rottner K., Small J.V. F- and G-actin concentrations in lamellipodia of moving cells. PLoS ONE. 2009;4:e4810. doi: 10.1371/journal.pone.0004810. [DOI] [PMC free article] [PubMed] [Google Scholar]
- 35.Cramer L.P., Briggs L.J., Dawe H.R. Use of fluorescently labeled deoxyribonuclease I to spatially measure G-actin levels in migrating and non-migrating cells. Cell Motil. Cytoskeleton. 2002;51:27–38. doi: 10.1002/cm.10013. [DOI] [PubMed] [Google Scholar]
- 36.Bernstein B.W., Bamburg J.R. ADF/cofilin: a functional node in cell biology. Trends Cell Biol. 2010;20:187–195. doi: 10.1016/j.tcb.2010.01.001. [DOI] [PMC free article] [PubMed] [Google Scholar]
- 37.Chan C., Beltzner C.C., Pollard T.D. Cofilin dissociates Arp2/3 complex and branches from actin filaments. Curr. Biol. 2009;19:537–545. doi: 10.1016/j.cub.2009.02.060. [DOI] [PMC free article] [PubMed] [Google Scholar]
- 38.Henty J.L., Bledsoe S.W., Staiger C.J. Arabidopsis actin depolymerizing factor4 modulates the stochastic dynamic behavior of actin filaments in the cortical array of epidermal cells. Plant Cell. 2011;23:3711–3726. doi: 10.1105/tpc.111.090670. [DOI] [PMC free article] [PubMed] [Google Scholar]
- 39.Kiuchi T., Ohashi K., Mizuno K. Cofilin promotes stimulus-induced lamellipodium formation by generating an abundant supply of actin monomers. J. Cell Biol. 2007;177:465–476. doi: 10.1083/jcb.200610005. [DOI] [PMC free article] [PubMed] [Google Scholar]
- 40.Mahaffy R.E., Pollard T.D. Kinetics of the formation and dissociation of actin filament branches mediated by Arp2/3 complex. Biophys. J. 2006;91:3519–3528. doi: 10.1529/biophysj.106.080937. [DOI] [PMC free article] [PubMed] [Google Scholar]
- 41.Cai L., Makhov A.M., Bear J.E. Coronin 1B antagonizes cortactin and remodels Arp2/3-containing actin branches in lamellipodia. Cell. 2008;134:828–842. doi: 10.1016/j.cell.2008.06.054. [DOI] [PMC free article] [PubMed] [Google Scholar]
- 42.Hill T.L. Length dependence of rate constants for end-to-end association and dissociation of equilibrium linear aggregates. Biophys. J. 1983;44:285–288. doi: 10.1016/S0006-3495(83)84301-X. [DOI] [PMC free article] [PubMed] [Google Scholar]
- 43.Andrianantoandro E., Blanchoin L., Pollard T.D. Kinetic mechanism of end-to-end annealing of actin filaments. J. Mol. Biol. 2001;312:721–730. doi: 10.1006/jmbi.2001.5005. [DOI] [PubMed] [Google Scholar]
- 44.Okada K., Blanchoin L., Bamburg J.R. Xenopus actin-interacting protein 1 (XAip1) enhances cofilin fragmentation of filaments by capping filament ends. J. Biol. Chem. 2002;277:43011–43016. doi: 10.1074/jbc.M203111200. [DOI] [PubMed] [Google Scholar]
- 45.Okreglak V., Drubin D.G. Loss of Aip1 reveals a role in maintaining the actin monomer pool and an in vivo oligomer assembly pathway. J. Cell Biol. 2010;188:769–777. doi: 10.1083/jcb.200909176. [DOI] [PMC free article] [PubMed] [Google Scholar]
- 46.Tsuji T., Miyoshi T., Watanabe N. An order of magnitude faster AIP1-associated actin disruption than nucleation by the Arp2/3 complex in lamellipodia. PLoS ONE. 2009;4:e4921. doi: 10.1371/journal.pone.0004921. [DOI] [PMC free article] [PubMed] [Google Scholar]
- 47.Urban E., Jacob S., Small J.V. Electron tomography reveals unbranched networks of actin filaments in lamellipodia. Nat. Cell Biol. 2010;12:429–435. doi: 10.1038/ncb2044. [DOI] [PubMed] [Google Scholar]
- 48.Yang C., Svitkina T. Visualizing branched actin filaments in lamellipodia by electron tomography. Nat. Cell Biol. 2011;13:1012–1013. doi: 10.1038/ncb2321. author reply 1013–1014. [DOI] [PMC free article] [PubMed] [Google Scholar]
- 49.Vinzenz M., Nemethova M., Small J.V. Actin branching in the initiation and maintenance of lamellipodia. J. Cell Sci. 2012;125:2775–2785. doi: 10.1242/jcs.107623. [DOI] [PubMed] [Google Scholar]
- 50.Ydenberg C.A., Smith B.A., Goode B.L. Cease-fire at the leading edge: new perspectives on actin filament branching, debranching, and cross-linking. Cytoskeleton. 2011;68:596–602. doi: 10.1002/cm.20543. [DOI] [PMC free article] [PubMed] [Google Scholar]
- 51.Pack C., Saito K., Kinjo M. Microenvironment and effect of energy depletion in the nucleus analyzed by mobility of multiple oligomeric EGFPs. Biophys. J. 2006;91:3921–3936. doi: 10.1529/biophysj.105.079467. [DOI] [PMC free article] [PubMed] [Google Scholar]
- 52.Breitsprecher D., Kiesewetter A.K., Faix J. Clustering of VASP actively drives processive, WH2 domain-mediated actin filament elongation. EMBO J. 2008;27:2943–2954. doi: 10.1038/emboj.2008.211. [DOI] [PMC free article] [PubMed] [Google Scholar]
- 53.Hansen S.D., Mullins R.D. VASP is a processive actin polymerase that requires monomeric actin for barbed end association. J. Cell Biol. 2010;191:571–584. doi: 10.1083/jcb.201003014. [DOI] [PMC free article] [PubMed] [Google Scholar]
- 54.Ponti A., Machacek M., Danuser G. Two distinct actin networks drive the protrusion of migrating cells. Science. 2004;305:1782–1786. doi: 10.1126/science.1100533. [DOI] [PubMed] [Google Scholar]
- 55.Reference deleted in proof.
- 56.Amin L., Ercolini E., Torre V. The elementary events underlying force generation in neuronal lamellipodia. Sci. Rep. 2011;1:153. doi: 10.1038/srep00153. [DOI] [PMC free article] [PubMed] [Google Scholar]
- 57.Keren K., Yam P.T., Theriot J.A. Intracellular fluid flow in rapidly moving cells. Nat. Cell Biol. 2009;11:1219–1224. doi: 10.1038/ncb1965. [DOI] [PMC free article] [PubMed] [Google Scholar]
- 58.Craig E.M., van Goor D., Mogilner A. Membrane tension, myosin force, and actin turnover maintain actin treadmill in the nerve growth cone. Biophys. J. 2012;102:1503–1513. doi: 10.1016/j.bpj.2012.03.003. [DOI] [PMC free article] [PubMed] [Google Scholar]
Associated Data
This section collects any data citations, data availability statements, or supplementary materials included in this article.