

Abstract
Small angle x-ray scattering (SAXS) is a versatile and widely used technique for obtaining low-resolution structures of macromolecules and complexes. SAXS experiments measure molecules in solution, without the need for labeling or crystallization. However, radiation damage currently limits the application of SAXS to molecules that can be produced in microgram quantities; for typical proteins, 10–20 μL of solution at 1 mg/mL is required to accumulate adequate signal before irreversible x-ray damage is observed. Here, we show that cryocooled proteins and nucleic acids can withstand doses at least two orders of magnitude larger than room temperature samples. We demonstrate accurate T = 100 K particle envelope reconstructions from sample volumes as small as 15 nL, a factor of 1000 smaller than in current practice. Cryo-SAXS will thus enable structure determination of difficult-to-express proteins and biologically important, highly radiation-sensitive proteins including light-activated switches and metalloenzymes.
Introduction
In the last decade, small angle x-ray scattering (SAXS) has been developed into a reliable experimental technique for rapidly obtaining low-resolution structures of biological macromolecules. The greatest strength of biological SAXS (BioSAXS) is its ability to report structures from macromolecules in solution, without the need for crystallization or labeling; the macromolecules need only be soluble and in a homogeneous, monodisperse phase. Most synchrotron x-ray sources have dedicated BioSAXS beamlines, including high throughput stations with automated data collection (1–5). Analysis suites such as ATSAS from the European Molecular Biology Laboratory (EMBL) (6) enable rapid and comprehensive interpretation of SAXS data, yielding information ranging from radius of gyration to structural envelopes. This information complements that from atomic resolution techniques and leads to biologically relevant conclusions. SAXS data have been used to validate crystallographic structures and molecular dynamics predictions, to probe conformational switching, to characterize flexibility and folding, and to assemble complexes from atomic structures of subunits (7).
The most important challenges in BioSAXS are to obtain monodisperse, aggregate-free samples, and to maintain this monodispersity throughout x-ray data collection. Radiation damage, which causes aggregation, unfolding, and fragmentation, is thus a critical bottleneck. The maximum tolerable x-ray dose (energy per unit mass) is generally orders of magnitude smaller than in x-ray crystallography. For example, lysozyme crystals can withstand ∼500 kGy at room temperature (8), whereas lysozyme solutions show excessive aggregation for x-ray doses above ∼400 Gy (or ∼1 kGy if glycerol is used to modify protein-protein interactions) (9). Biologically important targets such as metalloproteins and sensors can also exhibit fast damage at specific sites, e.g., at the enzymatically important metal site, that perturb ligand interactions and associated conformation changes. To minimize radiation doses and achieve adequate signal to noise, large sample volumes must be irradiated either by defocusing the x-ray beam (1) or by flowing (2–4) or translating (10) the sample through the beam. For a typical protein at 1 mg/mL concentration, the minimum sample consumption is roughly 12 μL (1). Further complicating matters, optimal sample volumes and allowable doses are highly sample-dependent, and must be determined on a case-by-case basis. For example, in SAXS studies of the light-sensing protein VVD, structures of the light-activated and dark states were obtained using a novel coaxial flow cell designed to provide exceptionally short residence times in the x-ray beam, at the cost of increased sample consumption (11).
Radiation damage is also a problem in macromolecular x-ray crystallography (MX) (12–16) and electron microscopy (EM) (17). In those techniques, radiation damage and minimum sample volumes required for structure determination are dramatically reduced by cooling samples to temperatures near 100 K. Solvent and radical diffusion are all but eliminated, and scaffolding by the frozen solvent network prevents large radiation-induced structural relaxations. In cryo-MX, crystals can withstand a molecule-independent maximum dose of ∼30 MGy, 20 to 150 times larger than at room temperature (8,18–24).
For successful cryocooling, macromolecular structure must be preserved and ice nucleation and growth must be prevented. Solvent vitrification can be achieved by rapid cooling (e.g., by plunging the sample into liquid nitrogen or propane or by inserting in a cold gas stream) (12–16) or by cooling under high pressure (25). Required cooling rates for complete vitrification can be reduced using chemical cryoprotectants such as glycerol (15,26,27). Although initially developed to reduce radiation damage, sample cryocooling also greatly simplifies storage and dramatically increases shelf life. It has transformed protein crystallography, enabling high throughput methods such as remote, robotically assisted synchrotron data collection on mail-in samples (28).
The potential of cryocooling for SAXS studies has long been recognized, but the critical challenge of reproducibly preparing and collecting data from suitable samples has not been successfully addressed. Unlike MX, SAXS is fundamentally a difference technique. The large contribution of solvent to the total scattering profile from a dilute solution must be measured and subtracted to determine the macromolecule’s scattering profile. Scattering from ice crystallites, or from any other electron density inhomogeneity formed during cooling, may be large and irreproducible. Therefore, for cryo-SAXS to become a viable technique, a reliable method for producing homogeneous vitrified samples is required. At the same time, the cryocooling method must preserve the macromolecule’s structural integrity and maintain signal to noise in the SAXS profile.
Here, we demonstrate such a method. We have integrated an open-flow nitrogen cryocooler into a standard SAXS beamline, and used SAXS to identify cryoprotection conditions that yield complete vitrification of small drops cooled in the nitrogen gas stream. Using these vitrified samples, we obtain scattering patterns from glucose isomerase (a standard SAXS reference (4,29,30)), and verify that low temperatures protect the molecule from radiation damage without altering its structure. Finally, we show that useful cryo-SAXS data can be collected from a variety of macromolecules using very small sample volumes. These methods will be immediately valuable for samples that are especially radiation sensitive, when available sample quantities are limited, or when samples may degrade over time. We discuss remaining challenges that must be overcome for cryo-SAXS to become a widely adopted alternative to room temperature SAXS for routine measurements of macromolecular structure.
Materials and Methods
Evaluation of cryoprotectants
The cryoprotectants polyethylene glycol, with average molecular mass of 200 Da, (PEG200), glycerol, and dimethyl sulfoxide (DMSO) were purchased from Sigma (St. Louis, MO), and ethylene glycol was purchased from Avantor Performance Materials (Phillipsburg, NJ). Cryoprotectant-water mixtures were prepared by weight in increments of 5%. Spherical drops of ∼1 μL volume were held in a ∼700 nylon loop (Hampton Research, Aliso Viejo, CA) and rapidly cooled by placing them in a T = 100 K nitrogen cryostream (700 series, Oxford Cryosystems, Oxford, United Kingdom). Cryo-SAXS data on these gas-stream-cooled samples were acquired at Cornell High Energy Synchrotron Source (CHESS) beamline F2. The x-ray energy was 9.88 keV, the sample-detector distance was 1.47 m, and the detector was a fiber-coupled CCD (Quantum 1, Area Detector Systems, Poway, CA). The upstream slits and flight tube were held under vacuum and separated from the sample area by mica windows. SAXS curves were processed using BioXTAS RAW software (31).
Preparation of biological samples for cryo-SAXS
Glucose isomerase crystals (Hampton Research) were redissolved in buffer containing 100 mM Tris pH 8.0 and 1 mM MgCl2. Hen egg white lysozyme (Sigma) was dissolved in buffer containing 40 mM Na-acetate pH 4.0, 50 mM NaCl and 1% (v/v) glycerol. A 24-bp DNA duplex with sequence GGTGACGAGTGAGCTACTGGGCGG (and its complement) was made from synthetic HPLC-purified oligonucleotides (Integrated DNA Technologies, Coralville, IA). The complementary strands were mixed and annealed to form the duplex, following vendor instructions. The DNA was then buffer exchanged with 10 mM Na-MOPS pH 7.0 and 100 mM NaCl using a spin column (Amicon Ultra-0.5, 10,000 mol wt cutoff, EMD Millipore, Billerica, MA).
For each matching buffer, a PEG solution was prepared with 946 mg/mL PEG 200. Each PEG solution was combined with the corresponding cryo-SAXS sample and matching buffer in a 1:1 ratio by volume, for a final concentration of ∼45% (w/w).
Sample holders
Two different window free, low volume sample cells were used for cryo-SAXS. For ∼1 μL volume samples, the cell (see Fig. 2 a) was composed of 1.8 mm long, 860 μm ID, 25 μm wall polyimide tubing. To thermally isolate the sample from the stainless steel support, the sample holder was glued to a short section of 510 μm ID, 25 μm wall polyimide tubing, which was press-fit over the support. The cell was oriented so that the x-ray beam passed along its axis and through the open ends of the tubing. For sub-μL volume samples, the sample was held by surface tension in a standard polyimide crystallography loop with a 600 μm diameter (MicroMount, MiTeGen, Ithaca, NY), see Fig. 6 a. For room temperature SAXS measurements, an in-vacuum 2 mm quartz capillary with oscillating flow was used to minimize radiation damage (4).
Figure 2.
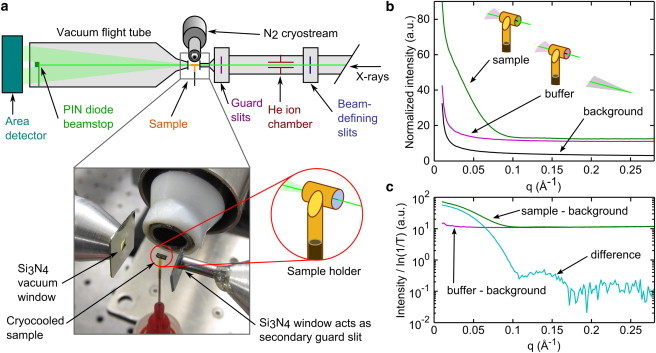
Apparatus and method for obtaining SAXS profiles from solution samples at 100 K. (a) A SAXS beamline was configured with a cryostream providing a steady flow of T = 100 K N2 gas at the sample position. Monitors for incident intensity (ion chamber) and transmitted intensity (PIN diode) allowed measurement of the x-ray transmission factor for each sample and normalization of scattering profiles. X-ray windows of 200 nm thick Si3N4 on the upstream and downstream flight tubes minimized background scattering. The 500 μm square aperture of the upstream window functioned as a second guard slit. The window-free sample holder was made from a 1.8 mm section of thin-wall polyimide tubing. A ∼1 μL sample was injected into the tubing and then vitrified by cooling in the gas stream. The sample cell was oriented so that the x-ray beam passed along the central axis of the tubing. The photograph shows a sample in the cryostream. (b) Cryo-SAXS profiles obtained from vitrified solutions of 2 mg/ml GI and its matching buffer, as well as for the instrumental background with the sample removed. Slight differences in the x-ray path lengths through the GI and buffer samples contributed to differences in their scattering. (c) Measurement of the x-ray transmission factor, T, and normalization by the path-length, log(1/T), provided accurate background subtraction using the data in (b) to obtain GI’s SAXS profile.
Figure 6.
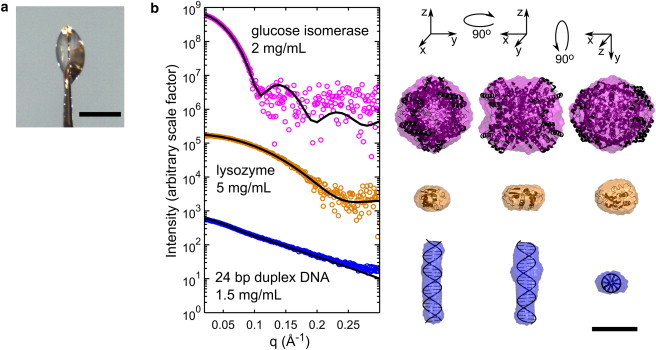
Molecular envelopes from nanoliter volumes. (a) Small, lenticular sample drops were held in a 600 μm diameter polyimide crystallography mount. A representative drop is shown. The scale bar in the image is 500 μm. (b) Cryo-SAXS data were acquired for GI, hen egg white lysozyme, and 24 basepair duplex DNA at the indicated concentrations. Cryo-SAXS profiles for each macromolecule were corrected by applying a constant offset using the BIFT method, as described in the Materials and Methods (this constant offset arises from sample geometry-dependent background subtraction errors at high-q values). Solid lines show the CRYSOL predictions from each atomic structure, based on PDBs 1XIB and 2LYZ, and an ideal 24-bp DNA helix generated using Nucleic Acid Builder (58). No fitting parameters were used except for an overall scale factor for the (arbitrary) intensity. Macromolecule envelopes generated from the cryo-SAXS data were aligned with the atomic structures, and are shown in three orientations. All are scaled according to the 50 Å bar at the lower right. For GI, lysozyme, and DNA, the mean normalized spatial discrepancies were 0.586, 0.459, and 0.542; the x-ray illuminated sample volumes were 16.3, 13.6, and 24.9 nL; the exposure times were 160, 80, and 160 s; and the x-ray doses were 275, 114, and 234 kGy, respectively.
SAXS data collection
SAXS data from biological samples were collected using beamline G1 at CHESS. The beamline was configured with a low-noise area detector (Pilatus 100 K, Dectris, Baden, Switzerland), a He ion chamber for monitoring the incident intensity, and a PIN diode beamstop for measuring transmitted intensity. A cryostream provided nitrogen gas at 100 K for sample cooling (see Fig. 2 a). SAXS data were analyzed using code written in-house in MATLAB (The MathWorks, Natick, MA).
Because of the small sample volumes used for cryo-SAXS, background scattering originating upstream of the sample had to be minimized. The upstream flight tube was filled with He and extended to within ∼5 mm of the sample using 1.8 mm ID, 0.3 mm wall stainless steel tubing. To further block background scattering that could pass around the sample, the guard slits were supplemented by a 200 nm thick, 500 μm square aperture Si3N4 window in a 381 μm thick Si frame (Fabrication Services and Technology, Northampton, England) that was glued to the end of the tubing. Scattered x-rays were collected through an evacuated flight tube with a 200 nm thick, 2 mm square Si3N4 window (Fabrication Services and Technology) epoxied to an aluminum cone at the upstream end. The photograph in Fig. 2 a shows the position of these windows relative to the sample and cryostream.
SAXS data on biomolecules were acquired at CHESS beamline G1 during two separate runs with similar beamline configurations. In the first run, cryo-SAXS data were taken using the 1 μL holder. A 1.52 m sample-detector distance and a 10.5 keV x-ray energy were used to probe scattering wavevectors , where , is the scattering angle and λ is the x-ray wavelength. The beam size at the sample position was 119 μm ×193 μm (height × width, full width at half-maximum (FWHM)). The x-ray flux calculated from the current through an N2 ion chamber, placed at the beamstop position with the sample removed, was . In the second run, cryo-SAXS data from sub-μL samples and room temperature SAXS data were acquired with an x-ray energy of 10.0 keV, a sample-detector distance of 1.35 m, a beam size of 220 μm ×190 μm (height × width, FWHM), and an x-ray flux of . The downstream vacuum window was Kapton film rather than Si3N4.
Background subtraction
Conventional SAXS sample cells use parallel, x-ray transparent windows to define a fixed path length. Scattering curves are collected from sample and matching buffer solutions held in identical cells, each is normalized by the transmitted x-ray intensity measured during the exposure, and the two are subtracted to obtain the macromolecule’s scattering profile. The cryo-SAXS sample holders described previously do not define a fixed path length for the sample, therefore a normalization and background subtraction method was devised to account for path length variation. The total scattering measured at the detector, , is modeled as
| (1) |
where is the incident intensity, T is the x-ray transmission factor of the sample (and thus is proportional to the thickness), and are the scattering from the macromolecule and solvent, respectively, and is the instrumental background scattering. With appropriate normalization, can be found from three scattering profile measurements: one of the macromolecule-containing sample, one of the macromolecule-free buffer, and one of the empty cell. The incident and transmitted intensities, and , are measured at the same time as , and T is calculated using
| (2) |
where the first factor, obtained from measurements of the empty cell, is included to cross-calibrate the two detectors. A background subtracted, thickness normalized intensity can be computed for both the sample (macromolecule plus buffer) and the buffer. Here, background subtraction refers to removing the properly scaled instrumental background scattering:
| (3) |
The difference between buffer and sample curves is then proportional to , the scattering of the macromolecule.
Estimation of x-ray dose
The x-ray dose D delivered to the sample was calculated using
| (4) |
where is the exposure time, f is the x-ray flux (photons per second), E is the x-ray energy, T is the sample transmission factor, V is the illuminated volume, and ρ is the mass density. The density was estimated from available data on PEG-water mixtures at room temperature (32). For each sample, the illuminated volume was found from where A is the beam area (product of width and height at FWHM) and is the x-ray absorption length. The absorption length was calculated from atomic absorption data (33) and by approximating the 45% (w/w) PEG-200 water mixture as tetra(ethylene glycol) and water in a 1:13 molar ratio (i.e., H44O18C8) with the density given previously; at 10 keV, . In x-ray crystallography, dose calculations are typically based on the mass energy-absorption coefficient (34). At the x-ray energies used, this calculation agrees with one based on the mass energy-absorption coefficient to within 1%.
An accurate measure of the beam size at the sample position is required for computing the x-ray dose. X-ray burns in a 1 mm thick glass slide were acquired with exposures of 1, 2, 8, 16, and 32 s, digitized using a flatbed scanner at 12,800 dpi (EPSON Perfection 1660), and analyzed in MATLAB. The images were corrected for the nonlinear response of the glass using a calibration curve generated from the multiple exposures.
Analysis of SAXS profiles
The pair-distance distribution function P(r) was calculated from the SAXS profiles using the Bayesian indirect Fourier transform (BIFT) method (35). An indirect Fourier transform program with smoothness regularization was written in MATLAB, and Bayesian estimation was used to find the maximum particle dimension , the Lagrange multiplier α, and the noise level β (35). In addition, the evidence for the hypothesis was computed (i.e., the probability of the data given the basis set, noise model, and regularizer) (36).
Ab initio reconstructions of the low-resolution particle envelope from SAXS data were performed using the ATSAS suite of programs (6). For each SAXS curve, 16 DAMMIF reconstructions (fast mode, no symmetry) were aligned and averaged using DAMAVER. Each average reconstruction was aligned with its corresponding atomic structure using SUPCOMB and visualized using Pymol version 1.2r1 (DeLano Scientific LLC).
Results and Discussion
PEG-200 solutions yield good contrast, low background scattering, and complete vitrification of 1 μL drops
Excessive and irreproducible ice formation on cooling has been a major obstacle to cryo-SAXS. In cryo-MX (37–39), the cooling rate and the choice and concentration of cryoprotectant are key variables in obtaining a homogeneous, fully vitrified state at T = 100 K. Cryo-SAXS imposes additional constraints. Most cryoprotectants have higher electron densities than water. Adding cryoprotectant thereby increases the solvent’s average electron density and its electron density fluctuations, decreasing SAXS contrast and increasing solvent background scattering. Consequently, cryoprotectants that are effective at low concentrations and that have electron densities near that of water are preferred. Based on these criteria, we find PEG-200 to be the superior choice among several other small-molecule cryoprotectants tested (including glycerol, ethylene glycol, and DMSO).
The cryoprotectant concentration necessary for complete vitrification was determined by acquiring cryo-SAXS profiles from ∼1 μL PEG-water drops at several PEG-200 concentrations (Fig. 1, b and c). At concentrations below 45% (w/w), the presence of ice is indicated by a steep rise in the scattered intensity below , in some cases to almost four orders of magnitude above the profile’s high-q baseline. When plotted on a log-log scale, it can be seen that the signature of ice formation is a power law at all concentrations (Fig. 1 d). At 45% (w/w) PEG, the low-q scattering is 10 times the baseline level in one sample (G), and absent in a second sample (H). In photographs of the sample drops (see Fig. 1 a), samples F and G, with PEG concentrations of 40% and 45% (w/w), respectively, are both visually clear. Thus, sample clarity is not a sufficient indicator of complete vitrification in the context of cryo-SAXS.
Figure 1.
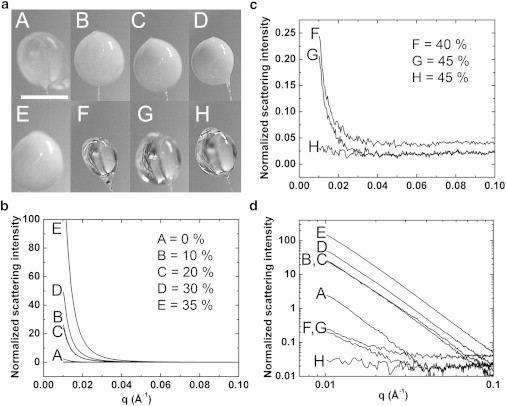
Cryoprotectant concentration required to obtain an ice-free scattering curve. (a) Photographs of ∼1 μL drops of PEG 200—water mixtures held in ∼700 μm nylon loops after cooling to 100 K in a N2 gas stream. PEG concentrations for drops (A–H) ranged from 0% to 45% (w/w) (indicated in the legends of (b) and (c)). Opacity of the drop arises from light scattering by ice crystals. (b) SAXS curves show increasing scattering intensity at as the PEG concentration increases from 0% to 35% (w/w). (c) At 40% (w/w) PEG and above the drops are visually clear and the intensity drops dramatically. However, scattering at low-q values still shows the presence of small amounts of ice. Using 45% (w/w) (drop H), the excess low-q scattering is absent. (d) The scattering curves from (b) and (c) are shown on log-log axes, revealing the characteristic power-law scattering of ice crystallites at all concentrations.
At PEG concentrations above 45% (w/w), no ice signal was observed, and samples could be reliably vitrified. Similar measurements yielded minimum concentrations for ice-free cryo-SAXS profiles of 50% (w/w) for glycerol, 50% (w/w) for ethylene glycol, and 45% (w/w) for DMSO. These cryoprotectant concentrations are roughly 5% larger than are required to eliminate ice rings in crystallographic diffraction at comparable cooling rates (26).
Sample cell design and buffer subtraction technique enable collection of cryo-SAXS data from biomolecules
The window-free, thin-wall sample cell was designed to optimize the x-ray path length through the 1 μL sample for good signal to noise, and to maximize heat transfer rates through its sidewalls for rapid cooling (Fig. 2 a). The x-ray beam passed along the axis of the cylindrical cell, and the sample was held within it by surface tension before cooling. At CHESS, a cryostream cooler was incorporated into the G1 beamline’s SAXS setup, allowing sample cooling by a continuous nitrogen gas stream at a temperature of 100 K.
In conventional SAXS on liquid samples, the fixed sample cell windows precisely define the x-ray path length, allowing buffer subtraction of data acquired in the same cell. In our window-free cell, the path length depends on the sample’s volume and the shape of its meniscus. A three-curve background subtraction method was used to correct for inevitable path length variations, as described in the Materials and Methods. To demonstrate this method, Fig. 2 b shows cryo-SAXS profiles for a 2 mg/mL glucose isomerase (GI) solution and its matching buffer, as well as the instrumental background. Each solution contained the cryoprotectant PEG-200 at 45% (w/w) concentration. In Fig. 2 c, subtraction of the normalized and background subtracted GI and buffer solution profiles reveals the small oscillations at high-q that are characteristic of a large, sphere-like globular protein.
Radius of gyration, maximum dimension, and particle envelope determined by cryo-SAXS for glucose isomerase
Macromolecular SAXS data are most often used to find shape information, including the radius of gyration (Rg), the maximum particle dimension, and the low-resolution envelope. To assess whether cryo-SAXS data are of sufficient quality for these purposes, the cryo-SAXS profile for 2 mg/ml GI was analyzed using standard techniques (40). The Guinier plot shown in Fig. 3 a is linear within the noise down to the smallest angles measured , and the slope gives a radius of gyration in excellent agreement with the crystal structure-derived value of 33.35 (CRYSOL with default parameters (6) and PDB 1XIB). The pair-distance distribution function P(r) in Fig. 3 b has a Gaussian shape characteristic of a globular particle, and gives a well-defined maximum dimension. An ab initio reconstruction of the molecular envelope without symmetry constraints shows fair agreement with the tetrameric structure from MX (Fig. 3 c); imposing appropriate symmetry constraints during reconstruction improves the agreement (Fig. S1 in the Supporting Material).
Figure 3.
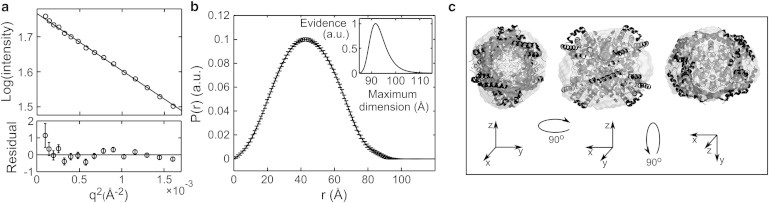
Analysis of cryo-SAXS data from glucose isomerase. (a) Guinier plot with linear fit used to find the radius of gyration Rg. (b) The pair distance distribution function P(r) derived from the Fourier transform of the scattering profile provides information about the particle shape including the maximum particle dimension (inset). (c) Three orientations of the reconstructed particle envelope with the docked crystal structure. The mean normalized spatial discrepancy was 0.641.
To determine whether the cryoprotectant or the cooling process significantly alters the SAXS profile, data were collected at room temperature from GI in buffer with and without 45% (w/w) PEG-200 cryoprotectant. The samples were oscillated through the beam within a stationary quartz capillary to reduce radiation damage. The most obvious effect of PEG-200 is a reduction in signal intensity due to lower electron density contrast between protein and solvent. Assuming average electron densities of 0.334 for water, 0.420 for protein (41), and 0.355 for a 45% (w/w) PEG-200 water solution at 298 K (32), the scattering of protein in 45% (w/w) PEG should be 57% of its scattering in pure water. This is consistent with the observed twofold reduction in scattering intensity of GI in PEG compared with standard buffer at room temperature. Despite this change in intensity, the overall shape of the scattering curve for GI is otherwise unchanged (Fig. 4). Rg determined from the Guinier plot was in buffer and with cryoprotectant added. These values agree within experimental error with the average Rg of determined in previous SAXS studies of GI (29).
Figure 4.
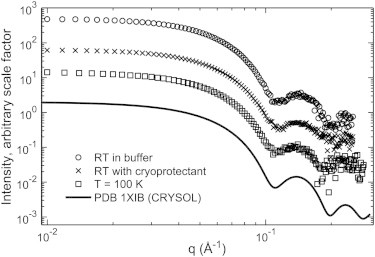
Background subtracted and normalized SAXS profiles from 2 mg/ml glucose isomerase at room temperature and 100 K. The presence of cryoprotectant (45% w/w PEG-200) and rapid cooling to 100 K do not affect the essential features of the scattering profile. The CRYSOL prediction from the crystal structure of GI was calculated using default parameters, and is shown for reference. For display purposes, curves were multiplied by an arbitrary scale factor. The total exposure times for room temperature samples were 32 s in aqueous buffer and 52 s in PEG buffer. The sample at T = 100 K was exposed for 180 s (corresponding to a dose of 220 kGy).
The effect of cryo-cooling on GI’s scattering profile is minimal. The profile’s shape and calculated Rg are similar to those from room temperature measurements and from the crystal structure prediction. Small differences between the 100 K and room temperature SAXS curves are observed in the Guinier region (Fig. S2). The calculated Rg is ∼2% larger at 100 K. This difference is small compared with experimental uncertainties, and may arise from differences in the sample geometry for 100 K and room temperature measurements, and also from residual interparticle interference at the working concentration of 2 mg/mL (Fig. S3). However, because a protein’s SAXS profile includes scattering from a hydration layer of ordered water molecules, the 2% increase in Rg at 100 K may reflect increased hydration water ordering, as is seen in protein crystals (42).
SAXS from cryocooled glucose isomerase is insensitive to large x-ray doses
X-ray-induced changes to the macromolecule’s structure or solution state must be minimized to obtain reliable SAXS profiles. In room temperature solution SAXS, a series of profiles are acquired and inspected for dose and time-dependent changes using the radius of gyration as a means of quantifying damage and determining the maximum tolerable x-ray exposure (9,10). Collecting data on vitrified samples at T ∼100 K should eliminate radiation-induced aggregation (which otherwise dominates low-angle scattering) and reduce unfolding and fragmentation.
To verify that data collection at T = 100 K reduces the rate at which radiation damage is manifested in SAXS profiles, a series of 60 s exposures were acquired from a ∼1 μL GI + buffer sample and then from a buffer-only sample. The accumulated dose for each exposure was calculated from the incident x-ray beam intensity and illuminated volume as described in the Materials and Methods. GI’s SAXS profile at a given dose was obtained by subtracting a buffer curve at roughly the same dose. At all doses, the Rg values fall between 33 and 34 Å and do not show any obvious dose-dependence (Fig. 5 a). The SAXS profiles obtained from the first and last exposures are indistinguishable (Fig. 5 b). The final exposure corresponds to an accumulated dose of 3.7 MGy.
Figure 5.
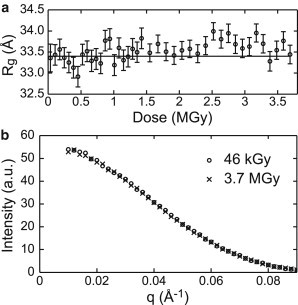
The SAXS profile of glucose isomerase is insensitive to large x-ray doses. (a) Radius of gyration (Rg) of GI as a function of accumulated x-ray dose for a single sample shows no radiation damage even at high doses. Rg was calculated from the region , and standard errors computed from the fits are shown. (b) The first and last SAXS profiles in the dose series of (a) are indistinguishable.
In cryo-EM and diffraction, in x-ray cryocrystallography, and in x-ray diffractive imaging of biological samples, all proteins show similar radiation sensitivity—measured on a damage per dose basis—at T = 100 K (21,43,44), and this should also be true in cryo-SAXS. For these other diffraction techniques, the maximum tolerable dose at T = 100 K to achieve a data set of a given resolution (in Å) is roughly 10 MGy/Å (44,45). For a SAXS data set to , corresponding to a resolution of ∼20 Å, this yields a maximum tolerable dose of 200 MGy. However, analysis of SAXS data is sensitive both to loss of information at high-q and to radiation-induced changes at low-q. At room temperature, radiation damage first manifests at low-q, presumably because of molecular aggregation, fragmentation, and unfolding, processes that should be strongly suppressed at T = 100 K. However, at large doses, microscopic inhomogeneities due to, for example, radiolytic cleavage of hydrogen and subsequent recombination and diffusion, may develop. In cryo-EM, hydrogen bubbles become evident beyond doses of (46) corresponding to doses of ∼45 MGy (47). Recent SAXS measurements on cryo-cooled insulin crystals observed a strong increase in scatter attributed to hydrogen bubble formation beyond ∼70 MGy, increasing to ∼180 MGy for T ≤ 30 K (48). Consequently, for typically radiation sensitive biomolecules with room temperature dose limits of 1–10 kGy, cryo-SAXS should yield dose limit increases of between two and five orders of magnitude, and corresponding reductions in minimum sample volumes.
High-dose tolerance enables macromolecular envelope reconstruction from nL sample volumes
Because of the greatly increased dose tolerance at T = 100 K, cryo-SAXS should enable dramatic reductions in minimum sample volumes for macromolecular envelope reconstruction. To demonstrate this, cryo-SAXS data were collected from nonspherical drops with thicknesses between 300 and 500 μm, held within polyimide crystallography loops with a 600 μm diameter (Fig. 6 a). The x-ray illuminated volume (the product of the drop thickness and beam area) ranged from 13 to 25 nL.
With this nonideal sample geometry, accurate buffer subtraction at high-q was more difficult to achieve than with the sample holders of Fig. 2. In general, SAXS patterns from macromolecules decay rapidly toward background at high-q. This makes the high-q background subtraction exquisitely sensitive to errors in the normalization of sample and buffer curves. Although we were unable to identify sources of these errors, SAXS profiles of multiple cryocooled drops containing the same PEG-buffer solution have subtraction errors that are well approximated within noise by a constant offset (Fig. S4).
To correct for these background subtraction errors in sub-μL drops, constant offsets were chosen to maximize the so-called Bayesian evidence of the P(r) function (49) obtained using the BIFT method. The implementation of BIFT is described in the Materials and Methods, and its ability to correct offset errors under experimental conditions is demonstrated with synthetic data in Fig. S5. In general, it is not good practice to add offsets to SAXS profiles, as the high-q scattering is used to determine the foldedness (Kratky plot) and volume (Porod invariant) of the macromolecule. However, this correction can be done without biasing envelope reconstructions. For example, the program DAMMIN/F of the ATSAS suite by default adjusts the constant offset to account for the bead model’s inability to accurately represent internal density fluctuations (50).
Fig. 6 b shows cryo-SAXS profiles and calculated molecular envelopes for GI, lysozyme, and 24-bp DNA duplex. Each profile was determined from one sample drop and one buffer drop, with an x-ray dose to the nanoliter samples of between 100 and 300 kGy. The profiles are noisy, but in all cases are sufficient to obtain molecular envelopes in reasonable agreement with atomic structures determined from crystallography.
Conclusions
The results presented here demonstrate the basic feasibility of cryo-SAXS as a method for determining structural information from macromolecules in sub-μL volume samples. Macromolecular solutions can be cooled into a vitrified state exhibiting no excess low-q scatter, indicating the absence of ice or other inhomogeneities on the length scales probed by SAXS. Required cryoprotectant concentrations are tolerable, produce modest reductions in SAXS contrast, and (at least for the macromolecules studied here) do not affect macromolecule structure. Because aggregation, unfolding, fragmentation, and other degradation processes that generate sample inhomogeneities are largely eliminated in vitrified samples, radiation damage per unit dose is reduced by at least two and as much as five orders of magnitude relative to room temperature SAXS; unless radiation-induced hydrogen bubble formation becomes important, cryo-SAXS dose limits should be ∼100 MGy, substantially larger than in cryocrystallography because of the lower resolution provided by SAXS (44). This large decrease in radiation sensitivity allows minimum sample volumes to be reduced by a comparable factor. Solvent and instrumental background subtraction is possible even with nonideal and nonidentical macromolecule and buffer sample geometries, allowing determination of radii of gyration and structural envelopes that match results from crystallography.
Although elimination of ice crystallites allowed us to subtract cryo-SAXS buffer scattering at low-q, reliable buffer subtraction at high-q is still a challenge. Sample geometry nonidealities and irreproducibilities (absent from the fixed, parallel-wall cell geometry used in room temperature SAXS) and drift in instrumental background introduce errors. However, by configuring the SAXS beamline to minimize background, designing a sample cell to optimize signal to noise, and measuring and correcting for path length variations, we were able to demonstrate reasonable buffer subtraction for 2 mg/mL GI. Future application of cryo-SAXS to weakly scattering systems such as low MW proteins, dilute solutions, and small sample volumes, may require additional optimization of the technique. For small sample volumes, we found that background subtraction errors were present, but could be corrected analytically. This analytical correction is adequate for generating molecular envelopes, but it is not ideal for general SAXS work. More experiments must be done to characterize the important sources of error and to address them through engineering of sample holders and beamline hardware.
The primary effect of the 45% (w/w) PEG-200 concentration used here was a ∼twofold reduction in macromolecule contrast. However, cryoprotectants may also have effects on macromolecular structure and interactions. Cryoprotectants are osmolytes, and therefore modify water activity and macromolecule hydration. High osmolyte concentrations have been used to mimic cellular conditions in vitro, and therefore may help preserve biologically relevant solution structures over some concentration range. Glycerol is known to stabilize protein structure and prevent aggregation (51). PEG-200 decreases the melting temperature of nucleic acid secondary structures, but stabilizes tertiary structures (52–55). These and other effects of cryoprotectant will have to be taken into account when comparing cryo-SAXS results with those from other techniques. Smaller sample volumes and the use of liquid nitrogen or propane instead of gaseous nitrogen as the cooling agent should allow cryoprotectant concentrations to be decreased below 30% (38,56,57), comparable to values routinely used in cryo-MX and generally assumed to have negligible effects on macromolecule structure.
The use of cryocooling has the potential to eliminate many difficulties associated with room temperature SAXS experiments. Because vitrified samples are much more radiation tolerant, they may yield much larger integrated signal to noise with no concerns about damage. Samples that spontaneously aggregate or otherwise degrade with time can be frozen immediately after manufacture and stored indefinitely, eliminating concerns about long-term stability. Dramatically reduced sample volume requirements will facilitate mass screening of solution conditions for their effects on molecular structure or association and combinatorial binding assays to, e.g., elucidate pathways for macromolecular complex formation. Short turnaround times will result from exploiting the existing infrastructure for high-throughput crystallography, including mail-in facilities that employ automated sample handling and full brightness, for rapid turnaround data collection. In the same way that cryo-MX has transformed atomic resolution studies, cryo-SAXS is poised to transform low-resolution studies of macromolecular structure and function.
Acknowledgments
We thank Arthur Woll and CHESS staff for experimental assistance and Thorne and Pollack group members for help with synchrotron data collection.
R.E.T. acknowledges support from the National Institutes of Health (NIH) (R01 GM65981) and the National Science Foundation (NSF) (DMR-0805240). L.P. acknowledges support from NIH (R01-GM085062). CHESS is supported by the NSF & NIH/NIGMS via NSF award DMR-0936384, and the MacCHESS resource is supported by the National Institute of General Medical Services (NIGMS) award GM-103485. R.E.T. acknowledges a significant financial interest in MiTeGen, LLC, which manufactured some of the tools used in this work.
Supporting Material
References
- 1.Hura G.L., Menon A.L., Tainer J.A. Robust, high-throughput solution structural analyses by small angle X-ray scattering (SAXS) Nat. Methods. 2009;6:606–612. doi: 10.1038/nmeth.1353. [DOI] [PMC free article] [PubMed] [Google Scholar]
- 2.Pernot P., Theveneau P., McSweeney S. New beamline dedicated to solution scattering from biological macromolecules at the ESRF. J. Phys. Conf. Ser. 2010;247:012009. [Google Scholar]
- 3.Martel A., Liu P., Tsuruta H. An integrated high-throughput data acquisition system for biological solution X-ray scattering studies. J. Synchrotron Radiat. 2012;19:431–434. doi: 10.1107/S0909049512008072. [DOI] [PMC free article] [PubMed] [Google Scholar]
- 4.Nielsen S.S., Møller M., Gillilan R.E. High-throughput biological small-angle X-ray scattering with a robotically loaded capillary cell. J. Appl. Crystallogr. 2012;45:213–223. doi: 10.1107/S0021889812000957. [DOI] [PMC free article] [PubMed] [Google Scholar]
- 5.Blanchet C.E., Zozulya A.V., Roessle M. Instrumental setup for high-throughput small- and wide-angle solution scattering at the X33 beamline of EMBL Hamburg. J. Appl. Crystallogr. 2012;45:489–495. [Google Scholar]
- 6.Petoukhov M.V., Franke D., Svergun D.I. New developments in the ATSAS program package for small-angle scattering data analysis. J. Appl. Crystallogr. 2012;45:342–350. doi: 10.1107/S0021889812007662. [DOI] [PMC free article] [PubMed] [Google Scholar]
- 7.Rambo R.P., Tainer J.A. Bridging the solution divide: comprehensive structural analyses of dynamic RNA, DNA, and protein assemblies by small-angle X-ray scattering. Curr. Opin. Struct. Biol. 2010;20:128–137. doi: 10.1016/j.sbi.2009.12.015. [DOI] [PMC free article] [PubMed] [Google Scholar]
- 8.Southworth-Davies R.J., Medina M.A., Garman E.F. Observation of decreased radiation damage at higher dose rates in room temperature protein crystallography. Structure. 2007;15:1531–1541. doi: 10.1016/j.str.2007.10.013. [DOI] [PubMed] [Google Scholar]
- 9.Kuwamoto S., Akiyama S., Fujisawa T. Radiation damage to a protein solution, detected by synchrotron X-ray small-angle scattering: dose-related considerations and suppression by cryoprotectants. J. Synchrotron Radiat. 2004;11:462–468. doi: 10.1107/S0909049504019272. [DOI] [PubMed] [Google Scholar]
- 10.Hong X., Hao Q. Measurements of accurate x-ray scattering data of protein solutions using small stationary sample cells. Rev. Sci. Instrum. 2009;80:014303. doi: 10.1063/1.3069285. [DOI] [PMC free article] [PubMed] [Google Scholar]
- 11.Lamb J.S., Zoltowski B.D., Pollack L. Illuminating solution responses of a LOV domain protein with photocoupled small-angle X-ray scattering. J. Mol. Biol. 2009;393:909–919. doi: 10.1016/j.jmb.2009.08.045. [DOI] [PMC free article] [PubMed] [Google Scholar]
- 12.Hope H. Cryocrystallography of biological macromolecules: a generally applicable method. Acta Crystallogr. B. 1988;44:22–26. doi: 10.1107/s0108768187008632. [DOI] [PubMed] [Google Scholar]
- 13.Hope H. Crystallography of biological macromolecules at ultra-low temperature. Annu. Rev. Biophys. Biophys. Chem. 1990;19:107–126. doi: 10.1146/annurev.bb.19.060190.000543. [DOI] [PubMed] [Google Scholar]
- 14.Rodgers D.W. Cryocrystallography. Structure. 1994;2:1135–1140. doi: 10.1016/s0969-2126(94)00116-2. [DOI] [PubMed] [Google Scholar]
- 15.Garman E., Schneider T. Macromolecular cryocrystallography. J. Appl. Crystallogr. 1997;30:211–237. [Google Scholar]
- 16.Pflugrath J.W. Macromolecular cryocrystallography—methods for cooling and mounting protein crystals at cryogenic temperatures. Methods. 2004;34:415–423. doi: 10.1016/j.ymeth.2004.03.032. [DOI] [PubMed] [Google Scholar]
- 17.Dubochet J., Adrian M., Schultz P. Cryo-electron microscopy of vitrified specimens. Q. Rev. Biophys. 1988;21:129–228. doi: 10.1017/s0033583500004297. [DOI] [PubMed] [Google Scholar]
- 18.Hendrickson W.A. Radiation damage in protein crystallography. J. Mol. Biol. 1976;106:889–893. doi: 10.1016/0022-2836(76)90271-0. [DOI] [PubMed] [Google Scholar]
- 19.Teng T.Y., Moffat K. Primary radiation damage of protein crystals by an intense synchrotron X-ray beam. J. Synchrotron Radiat. 2000;7:313–317. doi: 10.1107/S0909049500008694. [DOI] [PubMed] [Google Scholar]
- 20.Teng T.Y., Moffat K. Radiation damage of protein crystals at cryogenic temperatures between 40 K and 150 K. J. Synchrotron Radiat. 2002;9:198–201. doi: 10.1107/s0909049502008579. [DOI] [PubMed] [Google Scholar]
- 21.Owen R.L., Rudiño-Piñera E., Garman E.F. Experimental determination of the radiation dose limit for cryocooled protein crystals. Proc. Natl. Acad. Sci. USA. 2006;103:4912–4917. doi: 10.1073/pnas.0600973103. [DOI] [PMC free article] [PubMed] [Google Scholar]
- 22.Kmetko J., Husseini N.S., Thorne R.E. Quantifying X-ray radiation damage in protein crystals at cryogenic temperatures. Acta Crystallogr. D Biol. Crystallogr. 2006;62:1030–1038. doi: 10.1107/S0907444906023869. [DOI] [PubMed] [Google Scholar]
- 23.Kmetko J., Warkentin M., Thorne R.E. Can radiation damage to protein crystals be reduced using small-molecule compounds? Acta Crystallogr. D Biol. Crystallogr. 2011;67:881–893. doi: 10.1107/S0907444911032835. [DOI] [PMC free article] [PubMed] [Google Scholar]
- 24.Warkentin M., Thorne R.E. Glass transition in thaumatin crystals revealed through temperature-dependent radiation-sensitivity measurements. Acta Crystallogr. D Biol. Crystallogr. 2010;66:1092–1100. doi: 10.1107/S0907444910035523. [DOI] [PMC free article] [PubMed] [Google Scholar]
- 25.Kim C.U., Kapfer R., Gruner S.M. High-pressure cooling of protein crystals without cryoprotectants. Acta Crystallogr. D Biol. Crystallogr. 2005;61:881–890. doi: 10.1107/S090744490500836X. [DOI] [PubMed] [Google Scholar]
- 26.McFerrin M.B., Snell E.H. The development and application of a method to quantify the quality of cryoprotectant solutions using standard area-detector X-ray images. J. Appl. Crystallogr. 2002;35:538–545. [Google Scholar]
- 27.Juers D.H., Matthews B.W. Cryo-cooling in macromolecular crystallography: advantages, disadvantages and optimization. Q. Rev. Biophys. 2004;37:105–119. doi: 10.1017/s0033583504004007. [DOI] [PubMed] [Google Scholar]
- 28.Robinson H., Soares A.S., Héroux A. Mail-in crystallography program at Brookhaven National Laboratory’s National Synchrotron Light Source. Acta Crystallogr. D Biol. Crystallogr. 2006;62:1336–1339. doi: 10.1107/S0907444906026321. [DOI] [PubMed] [Google Scholar]
- 29.Kozak M. Glucose isomerase from Streptomyces rubiginosus - potential molecular weight standard for small- angle X-ray scattering. J. Appl. Crystallogr. 2005;38:555–558. [Google Scholar]
- 30.Putnam C.D., Hammel M., Tainer J.A. X-ray solution scattering (SAXS) combined with crystallography and computation: defining accurate macromolecular structures, conformations and assemblies in solution. Q. Rev. Biophys. 2007;40:191–285. doi: 10.1017/S0033583507004635. [DOI] [PubMed] [Google Scholar]
- 31.Nielsen S.S., Toft K.N., Arleth L. BioXTAS RAW, a software program for high-throughput automated small-angle X-ray scattering data reduction and preliminary analysis. J. Appl. Crystallogr. 2009;42:959–964. [Google Scholar]
- 32.Muller E.A., Rasmussen P. Densities and excess volumes in aqueous poly(ethylene glycol) solutions. J. Chem. Eng. Data. 1991;36:214–217. [Google Scholar]
- 33.Henke B.L., Gullikson E.M., Davis J.C. X-Ray interactions: photoabsorption, scattering, transmission, and reflection at E = 50–30,000 eV, Z = 1–92. At. Nucl. Data Tables. 1993;54:181–342. [Google Scholar]
- 34.Paithankar K.S., Garman E.F. Know your dose: RADDOSE. Acta Crystallogr. D Biol. Crystallogr. 2010;66:381–388. doi: 10.1107/S0907444910006724. [DOI] [PMC free article] [PubMed] [Google Scholar]
- 35.Hansen S. Bayesian estimation of hyperparameters for indirect Fourier transformation in small-angle scattering. J. Appl. Crystallogr. 2000;33:1415–1421. [Google Scholar]
- 36.MacKay D. Bayesian interpolation. Neural Comput. 1992;4:415–447. [Google Scholar]
- 37.Chinte U., Shah B., Schall C. Sample size: an important parameter in flash-cooling macromolecular crystallization solutions. J. Appl. Crystallogr. 2005;38:412–419. [Google Scholar]
- 38.Warkentin M., Berejnov V., Thorne R.E. Hyperquenching for protein cryocrystallography. J. Appl. Crystallogr. 2006;39:805–811. doi: 10.1107/S0021889806037484. [DOI] [PMC free article] [PubMed] [Google Scholar]
- 39.Warkentin M., Stanislavskaia V., Thorne R.E. Cryocrystallography in capillaries: critical glycerol concentrations and cooling rates. J. Appl. Crystallogr. 2008;41:791–797. doi: 10.1107/S0021889808018451. [DOI] [PMC free article] [PubMed] [Google Scholar]
- 40.Mertens H.D., Svergun D.I. Structural characterization of proteins and complexes using small-angle X-ray solution scattering. J. Struct. Biol. 2010;172:128–141. doi: 10.1016/j.jsb.2010.06.012. [DOI] [PubMed] [Google Scholar]
- 41.Svergun D.I., Koch M.H.J. Small-angle scattering studies of biological macromolecules in solution. Rep. Prog. Phys. 2003;66:1735–1782. [Google Scholar]
- 42.Nakasako M. Structural characteristics in protein hydration investigated by cryogenic X-ray crystal structure analyses. J. Biol. Phys. 2002;28:129–137. doi: 10.1023/A:1019982220615. [DOI] [PMC free article] [PubMed] [Google Scholar]
- 43.Henderson R. Cryo-protection of protein crystals against radiation damage in electron and X-ray diffraction. Proc. Biol. Sci. 1990;241:6–8. [Google Scholar]
- 44.Howells M.R., Beetz T., Starodub D. An assessment of the resolution limitation due to radiation-damage in x-ray diffraction microscopy. J. Electron Spectrosc. Relat. Phenom. 2009;170:4–12. doi: 10.1016/j.elspec.2008.10.008. [DOI] [PMC free article] [PubMed] [Google Scholar]
- 45.Holton J.M. A beginner’s guide to radiation damage. J. Synchrotron Radiat. 2009;16:133–142. doi: 10.1107/S0909049509004361. [DOI] [PMC free article] [PubMed] [Google Scholar]
- 46.Leapman R.D., Sun S. Cryo-electron energy loss spectroscopy: observations on vitrified hydrated specimens and radiation damage. Ultramicroscopy. 1995;59:71–79. doi: 10.1016/0304-3991(95)00019-w. [DOI] [PubMed] [Google Scholar]
- 47.Baker L.A., Rubinstein J.L. Radiation damage in electron cryomicroscopy. Methods Enzymol. 2010;481:371–388. doi: 10.1016/S0076-6879(10)81015-8. [DOI] [PubMed] [Google Scholar]
- 48.Meents A., Gutmann S., Schulze-Briese C. Origin and temperature dependence of radiation damage in biological samples at cryogenic temperatures. Proc. Natl. Acad. Sci. USA. 2010;107:1094–1099. doi: 10.1073/pnas.0905481107. [DOI] [PMC free article] [PubMed] [Google Scholar]
- 49.Vestergaard B., Hansen S. Application of Bayesian analysis to indirect Fourier transformation in small-angle scattering. J. Appl. Crystallogr. 2006;39:797–804. [Google Scholar]
- 50.Svergun D.I. Restoring low resolution structure of biological macromolecules from solution scattering using simulated annealing. Biophys. J. 1999;76:2879–2886. doi: 10.1016/S0006-3495(99)77443-6. [DOI] [PMC free article] [PubMed] [Google Scholar]
- 51.Vagenende V., Yap M.G.S., Trout B.L. Mechanisms of protein stabilization and prevention of protein aggregation by glycerol. Biochemistry. 2009;48:11084–11096. doi: 10.1021/bi900649t. [DOI] [PubMed] [Google Scholar]
- 52.Nakano S., Karimata H.T., Sugimoto N. Facilitation of RNA enzyme activity in the molecular crowding media of cosolutes. J. Am. Chem. Soc. 2009;131:16881–16888. doi: 10.1021/ja9066628. [DOI] [PubMed] [Google Scholar]
- 53.Spink C.H., Garbett N., Chaires J.B. Enthalpies of DNA melting in the presence of osmolytes. Biophys. Chem. 2007;126:176–185. doi: 10.1016/j.bpc.2006.07.013. [DOI] [PubMed] [Google Scholar]
- 54.Miyoshi D., Karimata H., Sugimoto N. Factors regulating thermodynamic stability of DNA structures under molecular crowding conditions. Nucleic Acids Symp. Ser. (Oxf) 2006;50:203–204. doi: 10.1093/nass/nrl101. [DOI] [PubMed] [Google Scholar]
- 55.Nakano S., Wu L., Sugimoto N. Conformation and the sodium ion condensation on DNA and RNA structures in the presence of a neutral cosolute as a mimic of the intracellular media. Mol. Biosyst. 2008;4:579–588. doi: 10.1039/b718806d. [DOI] [PubMed] [Google Scholar]
- 56.Kriminski S., Kazmierczak M., Thorne R.E. Heat transfer from protein crystals: implications for flash-cooling and X-ray beam heating. Acta Crystallogr. D Biol. Crystallogr. 2003;59:697–708. doi: 10.1107/s0907444903002713. [DOI] [PubMed] [Google Scholar]
- 57.Hopkins J.B., Badeau R., Thorne R.E. Effect of common cryoprotectants on critical warming rates and ice formation in aqueous solutions. Cryobiology. 2012;65:169–178. doi: 10.1016/j.cryobiol.2012.05.010. [DOI] [PMC free article] [PubMed] [Google Scholar]
- 58.Macke T.J., Case D.A. Modeling unusual nucleic acid structures. In: Leontis N.B., SantaLucia J., editors. Molecular Modeling of Nucleic Acids. American Chemical Society; Washington, DC: 1998. pp. 379–393. [Google Scholar]
Associated Data
This section collects any data citations, data availability statements, or supplementary materials included in this article.