

Abstract
This work presents experimental results combined with model-dependent predictions regarding the osmotic-permeability regulation of human aquaporin 1 (hAQP1) expressed in Xenopus oocyte membranes. Membrane elastic properties were studied under fully controlled conditions to obtain a function that relates internal volume and pressure. This function was used to design a model in which osmotic permeability could be studied as a pressure-dependent variable. The model states that hAQP1 closes with membrane-tension increments. It is important to emphasize that the only parameter of the model is the initial osmotic permeability coefficient, which was obtained by model-dependent fitting. The model was contrasted with experimental records from emptied-out Xenopus laevis oocytes expressing hAQP1. Simulated results reproduce and predict volume changes in high-water-permeability membranes under hypoosmotic gradients of different magnitude, as well as under consecutive hypo- and hyperosmotic conditions. In all cases, the simulated permeability coefficients are similar to experimental values. Predicted pressure, volume, and permeability changes indicate that hAQP1 water channels can transit from a high-water-permeability state to a closed state. This behavior is reversible and occurs in a cooperative manner among monomers. We conclude that hAQP1 is a constitutively open channel that closes mediated by membrane-tension increments.
Introduction
The discovery of aquaporins (AQPs) in 1992 (1) had a significant impact on the study of water transport through biological membranes. Since then, members of the AQP family have been described in all living organisms (2) and the effort to further understand their regulation has given rise to a wide range of studies.
Initially, the study of water transport through AQPs was centered on finding drugs that could modulate the activity of the channel. Early on, mercury chloride was accepted as the extracellular inhibitor of AQPs (3), but it was later shown to activate only certain AQPs, such as AQP6 (4). Its mechanism of action has been described down to the molecular level in AQP1 (5). Mercury chloride was also shown to reduce the water transport rate of the mammalian AQP4, but this time by acting on the intracellular side of the channel (6). Other drugs, such as bumetanide and its derivatives, have also been described as intracellular inhibitors of rat AQP4 (7). Following these studies of AQP’s function and modulation, we recently reported that furosemide is an intracellular inhibitor of human AQP1 (hAQP1) (8).
The regulation mechanisms of AQPs have been described most thoroughly in plants. Some well-known examples are phosphorylation events, differential responses to intracellular pH or calcium concentrations, occlusion of the pore by a cytoplasmic domain of the protein (for a review of these mechanisms, see Törnroth-Horsefield et al. (9)), and the organization of membrane heterotetramers (10,11).
Recent results from molecular-dynamics (MD) simulations suggested that gating mechanisms mediated by transmembrane voltage differences (ΔVT) could have a role in regulating AQP1 and AQP4 (12). However, the ΔVT values required to see such effects are on the order of 1–2 V, which is far from the biological range.
Wan and co-workers (13) described a gating mechanism in algae cells mediated by the intensity of water flow within the AQP pore. This effect increased proportionally with the size of mechanically induced pressure changes. The authors proposed two probable mechanisms by which this mechanical stimulus was perceived: 1) the input of kinetic energy on the NPA motif of AQPs, which may cause a conformational change in the channel (the energy-input model); or 2), the development of tension near the channel constriction (the cohesion-tension model).
Based on estimates of intracellular hydrostatic pressure, Soveral and co-workers (14) suggested that membrane tension could be a mechanism for regulating the rate of transport of the yeast aquaporin AQY1 of Pichia pastoris. Subsequently, another group revealed that regulation of AQY1 would not be mediated by a direct effect of mechanical tension, but rather by a combination of mechanosensitivity (studied by MD simulations) associated with phosphorylation (assayed in spheroplasts) (15).
Recently, we obtained experimental evidence that would suggest a possible regulatory role of membrane tension in hAQP1, without the contribution of cytoplasmic intermediates (8). Here, we propose that the modulation of hAQP1 by membrane tension is responsible for the nonlinear osmotic response observed in Xenopus laevis emptied-out oocytes (EOOs) after hypoosmotic challenges. Having demonstrated that internal pressure and volume can be measured simultaneously with the EOO technique, our strategy was to first determine the relationship between these variables and then to develop a mathematical model in which the osmotic permeability were dependent on both and . In vitro and in silico results, performed with gradients of different nature and magnitude, demonstrate that hAQP1 is modulated by membrane tension in a reversible and cooperative manner by acting on AQP monomers. A general equation is presented to predict the effect of membrane tension on changes in the osmotic permeability coefficient in oocyte membranes overexpressing hAQP1.
Materials and Methods
Our previously published experimental methodology (8) is described in the Supporting Material. Here we describe the specific method and model used in this work.
Determination of the relationship between internal pressure and volume
To determine the − relationship in EOOs, stepwise injections of 0.16 μl of ND96 were done until membrane rupture was reached. Mean and values were taken from steady states at the end of each volume step (Fig. 1 A). For each experiment, the − relationship was obtained by a second-order polynomial function (continuous lines in Fig. 1 B).
Figure 1.
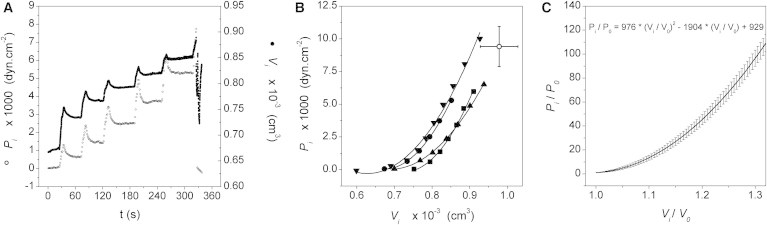
Study of the elastic properties of X. laevis oocyte membranes. (A) Time course of internal pressure and volume registered in a typical experiment. Both variables were simultaneously measured using the EOO technique. Volume changes were induced by stepwise pulses. Each step was induced after stabilization of the previously injected pulse. (B) Mean and values were obtained at the steady state of each step. Data for four independent oocytes are shown in a − plot. Each experimental record was fitted to a second-order polynomial function (R2 > 0.99 in all cases). The open circle represents the mean point of membrane rupture ± SE (n = 4). (C) Each polynomial function obtained in B was expressed as relative pressure versus relative volume , and the results were then averaged to obtain a mean function of versus . The coefficients obtained were = 976 ± 8, = 1904 ± 4, and = 929 ± 7 (expressed as mean ± SE, n = 4). See Fig. S2 for − measurements in whole oocytes, Fig. S3 for comparison of T values, and Fig. S4 for comparison of E values between EOOs and whole oocytes.
To study the − relationship in entire X. laevis oocytes (Fig. S2), each cell was punctured with a glass micropipette connected with a catheter to the clip-on dome with the pressure transducer. A Hamilton syringe was connected to this catheter halfway between the oocyte and the pressure transducer. As with the EOOs, volume changes were induced stepwise by injecting an isoosmotic solution with the Hamilton syringe. In this case, the volume injected in each step was 0.32 μl.
The first-order derivative of the − function (i.e., the elastic modulus or elastance was obtained for each experiment to get an average function to characterize the system (Fig. S4).
Model
Simulations were performed to study the osmotic response of Xenopus oocytes expressing hAQP1. The model was based on the general formulation used for fluid fluxes (16). According to this model, water is transported by an osmotic mechanism that is described by the following phenomenological expression:
| (1) |
where is the water flux across the membrane, is the osmotic permeability coefficient of the oocyte membrane, is the membrane area, is the water molar partial volume, is the extracellular osmolarity, is the total number of internal osmolytes, and is the internal volume, which is calculated from videomicroscopy images of the EOO, assuming a semispherical shape. Because is constant, the model described by Eq. 1 will be called the constant model (CPfM).
Based on this general model, we introduced the following modifications to consider a variable osmotic permeability coefficient :
| (2) |
where is the internal pressure at any time t ≥ 0, is the initial internal pressure, and is the initial osmotic permeability coefficient.
The relative internal pressure was determined from the relative internal volume according to the following equation:
| (3) |
where is the internal volume at any time t ≥ 0, is the initial internal volume, and = 976 ± 8, = 1904 ± 4, and = 929 ± 7 are the mean polynomic coefficients ± SE (n = 4). This equation is the average of four independent experiments done in EOOs, in which volume increments were induced by stepwise injections, whereas and were simultaneously measured (as described in Materials and Methods). Equations 2 and 3 establish a simple relationship between and the two variables that define membrane elastance: and .
Equation 2 defines = at t = 0. From then on, must decrease due to increments produced by the osmotic flux. The presented model assumes that water is transported through the membrane by osmosis. This process was modeled using the phenomenological expression represented by Eq. 1, along with modifications introduced by Eqs. 2 and 3, and the continuity theorem. Essentially, the model states that 1), volume changes in the intracellular compartment are due to volume flux across the membrane; and 2), the driving force for water is the osmotic gradient between the external and internal sides of the oocyte membrane. The most important variable in the model is the relative volume delimited by the oocyte membrane. Because experiments were done using the EOO method, the model considers the volume of half an oocyte. The model computes concentration variations in the internal compartment for each iteration step. The relevant parameter is , which is selected by a model-dependent fitting procedure. This parameter, along with initial experimental conditions, defines the initial flux in each experiment. Thus, water fluxes determine the internal volume increments, and this defines the pressure changes predicted by Eq. 3. These pressure changes modify values according to Eq. 2. Therefore, this model is called the variable model (VPfM). In this model, the area of the oocyte membrane is considered variable. The model does not consider any interaction between water transport and membrane potential.
Simulations
Simulations were performed using the Euler method with custom-made software developed in Visual Basic code using an integration step of 1 s. This step guarantees the accuracy and stability of the Euler method. The procedure predicts the time course of relative volume changes after a hypoosmotic challenge. The software allows model-dependent fitting of experimental results to obtain the best-fitted value, as well as visualization of simulated and experimental data. All initial experimental data (volume, area, and internal and external osmolarities) were used to simulate osmotic responses. Each simulation was run until the end of the experiment, and the best fit was selected by the minimum-squares comparison method. In this manner, the best fit was obtained for each experiment. In addition, internal osmolarity , relative pressure , water flux , and values were simultaneously simulated along with volume changes in each run.
Finally, mean and values (obtained from experimental results and from previous fitting runs) were used as initial conditions to simulate the osmotic response with initial gradients of 25, 75, 125, 175, 225, and 250 mM. Three different simulations were run for each gradient, using the following initial values for and : mean, mean + SE, and mean − SE (thus, n = 3). The results obtained from these simulations were analyzed together, along with results obtained from fitting simulations.
Statistical analysis
All data are presented as the mean ± SE. Significant differences were evaluated with the Mann-Whitney test, with p < 0.05.
Results
Determination of the − relationship and characterization of the elastic properties of the membrane
Simultaneous and records were obtained to characterize the elastic properties of EOO membranes. A typical experiment is shown in Fig. 1 A. We injected the solution stepwise into the internal compartment, waiting at each step to achieve a steady state. In Fig. 1 B, four independent experiments are shown. Data points represent the mean values of − pairs registered during the steady state of each step. Afterward, each experiment was fit to a second-order polynomial function (continuous lines in Fig. 1 B). Each of these functions was expressed in terms of relative pressure and volume . Fig. 1 C shows the average values of these functions (Eq. 3).
To date, only a few studies have focused on the elastic properties of Xenopus oocyte membranes. To compare our results with those found in the literature, in particular those reported by Kelly and Macklem (17) and Kelly et al. (18), we studied the elastic properties of Xenopus membranes in whole oocytes (Fig. S2). These results (Table 1) were similar to those obtained by Kelly and co-workers, even though we used a different protocol. Thus, there were no significant differences in the relative volumes reached at membrane rupture (Max Vi/V0) in whole oocytes, regardless of the use of different methods.
Table 1.
Comparison of the elastic properties of EOOs and whole oocytes
| Initial (× 102 dyn·cm−2) | Maximal (× 102 dyn·cm−2) | (initial) (× 10−3 cm3) | Max | Max T (mN/m) | E (× 107 dyn·cm−5) | Reference Source |
|---|---|---|---|---|---|---|
| 0.21 ± 0.42 | 97.8 ± 16.0a | 0.71 ± 0.05 | 1.46 ± 0.12 | 555 ± 177a | 13 ± 5.2a | EOOs |
| 4.6 ± 1.9 | 55.6 ± 12.8a | 1.20 ± 0.05 | 1.28 ± 0.04 | 104 ± 21a | 2.54 ± 0.68a | whole oocytes |
| 6.5 ± 1.8c | 53.0 ± 6.3c | 0.86 ± 0.04c | 1.24 ± 0.03b | ∼178 ± 36b | ∼5.6c | (17,18) |
Values of initial internal pressure , maximal reached, internal volume , maximal volume change expressed as maximal relative volume , maximal tension reached , and maximal elastic modulus are compared between EOOs and whole oocytes. Significant differences were observed between all variables in both groups (p < 0.05, Mann-Whitney test, EOOs (n = 4), whole oocytes (n = 5)). Results from whole oocytes were compared with those previously obtained in Xenopus oocytes by Kelly and Macklem (17) and Kelly et al. (18). Because Kelly and co-workers estimated the elastance relative to volume , the reported data have units of pressure (KPa). Assuming a cellular volume of ∼0.001 cm3, we divided the referenced data and obtained E values similar to those presented in this work.
Data represent values obtained at membrane rupture.
Values calculated from Kelly and Macklem (17).
Values calculated from Kelly et al. (18).
Table 1 also shows results obtained in EOOs. A comparison of initial and maximal values shows that relative pressures at membrane rupture are 10-fold higher in EOOs than in whole oocytes. A comparison between EOOs and whole oocytes shows significant differences in the maximal value of E just before rupture (Table 1 and Fig. S4). Because there are no significant differences between relative rupture volumes, these differences in and E could be a consequence of the absence or presence of oocyte cytoplasmic content. Just as might be expected from maximal values, our results show that the calculated T value at rupture is significantly greater in EOOs than in whole oocytes (Table 1).
Contrasting the VPfM with osmotic experiments: does hAQP1 behave as a two-state channel?
Equation 1 is widely used to determine the values of AQPs (19). However, its applicability is limited to the beginning of the osmotic response, when the volume that has accumulated through time is still small. Additionally, simulations run with this model do not fit experimental results when a high-permeability pathway is combined with a high driving force, as occurs with hAQP1 expressed in Xenopus oocytes tested with high osmotic gradients (Fig. S5). Therefore, we developed and tested different computational models in an attempt to describe this phenomenon more accurately. Some models took into account solute movements coupled with osmotic fluxes in EOOs, and others evaluated the counteracting forces of osmosis and hydrostatic pressure. Eventually, they were all discarded because the best-fitting parameters obtained, i.e., , solute permeability , and internal hydrostatic pressure , were beyond all possible biological ranges (see other tested models in the Supporting Material).
We finally proposed the VPfM, which we developed by introducing Eqs. 2 and 3 to modify the classical equation used to study osmotic fluxes (Eq. 1). As a first approach, the VPfM was contrasted with experiments in which the osmotic gradient was created by dilution of the extracellular solution. Fig. 2 A shows a typical experiment in which the simulation with the VPfM fit to experimental data (continuous line). The mean value obtained from three independent simulations at 10 s was not significantly different from experimental measurements obtained at the same time (0.0026 ± 0.0009 vs. 0.0032 ± 0.0009 cm·s−1; mean ± SE, respectively). The corresponding time course is shown in Fig. 2 B. This result predicts that varies from an initial state of high permeability to a final state of lower permeability. The predicted values at the end of the experiment show a tendency to reach the water permeability of membranes without AQPs. Therefore, hAQP1 would transit from initially an open state to finally reach a possibly closed state. Additionally, internal pressure changes seem to be almost constant, as shown in Fig. 2 C.
Figure 2.
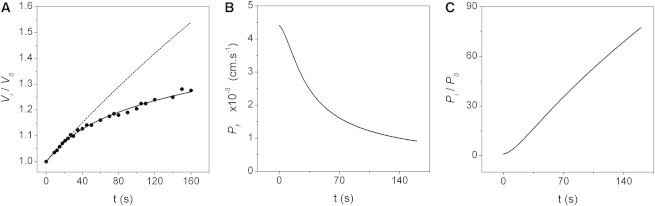
VPfM contrasted with a typical osmotic experiment in X. laevis oocytes with hAQP1. (A) Time course of experimental (dots) and simulated (lines) relative volumes. The osmotic gradient (∼140 mM) was created by diluting the external solution. The experiment was done using the EOO technique. The continuous line is the best-fitted response simulated with the variable water permeability model (VPfM). The only parameter in this model is , which is modified by relative pressure according to Eq. 2. The best-fitted for this experiment is 0.0043 cm·s−1. was determined by the model according to Eq. 3, shown in Fig. 1C. The dashed line is the osmotic response predicted by the constant model (CPfM), using the value obtained by fitting Eq. 1 up to 10 s (0.0040 cm·s−1). All initial data for simulations (except ) were obtained from the experiment. (B) Time course of obtained from the simulation shown in A. A transition in the water pathway from an open to a closed state seems to occur. (C) Time course of the relative internal pressure obtained in the same simulation.
The dashed line in Fig. 2 A shows the predicted osmotic response obtained using a constant value, just as in classic AQP experiments. was obtained by model-dependent fitting, applying Eq. 1 up to 10 s. This value was then used to simulate the osmotic response up to 160 s, using initial experimental data and the CPfM (Eq. 1). From the analysis shown in Fig. 2 A (dashed line) and Fig. S5, it is clear that a model that considers a constant as the only parameter cannot explain the experimental data obtained with hAQP1 exposed to high osmotic gradients beyond 10 s. However, up until 10 s, both the CPfM and VPfM simulations are neatly superimposed with experimental results (Fig. 2 A). This demonstrates that both models coincide with classical methodology in determining , i.e., drawing the best line through zero. However, the CPfM cannot predict what happens at longer times (dashed line in Fig. 2 A, and Fig. S5), whereas the VPfM is able to reproduce the entire osmotic response (continuous line in Fig. 2 A).
To further test our model, we contrasted the VPfM with experiments in which we created the osmotic gradient while maintaining the same ionic force on both sides of the membrane. To that end, we created osmotic gradients by using different concentrations of mannitol between the two compartments. Remarkably, the VPfM results are consistent with previously published experiments (8) in that the relationship between simulated values and the applied osmotic gradient is nonlinear 10 s after the beginning of the osmotic shock (solid circles in Fig. 3). What was previously an experimental observation can now be explained by predictions obtained from simulations with the VPfM. When only initial simulated fluxes (t = 0) are considered (taken from experiments shown in Fig. 4), a linear relationship is obtained (open circles in Fig. 3, R2 > 0.96). In the first 10 s, the simulated internal osmolarity falls <3% (Table 2); therefore, deviations from linearity cannot be a consequence of decrements in driving force. According to the model, increments are induced by increments of (Fig. 1 C). This relationship indicates that small volume increments (∼3%) induce very important changes of (∼100%) (Table 2).
Figure 3.
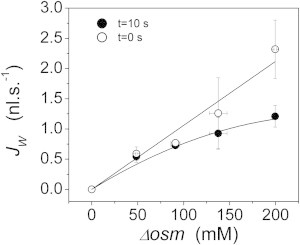
Relationship between simulated fluxes and osmotic gradients. Water fluxes were obtained at 10 s (solid dots) and at the beginning of the osmotic challenge (open dots) from simulations shown in Fig. 4. At 10 s, the relationship between and is nonlinear, just as experimentally observed (8). However, through simulation it is also possible to analyze initial values (open dots), where this relationship is linear, just as predicted by Eq. 1 (R2 > 0.96).
Figure 4.
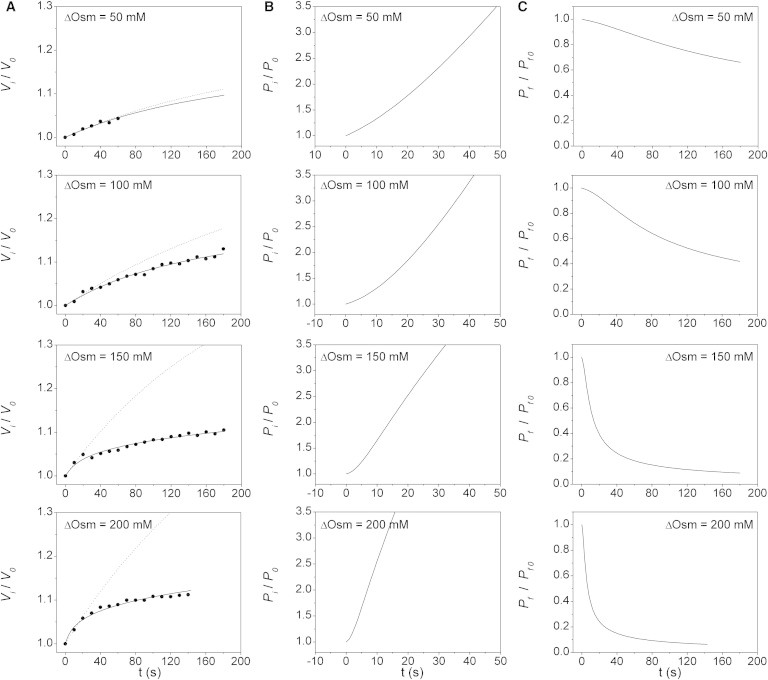
VPfM contrasted with osmotic experiments using mannitol gradients of different magnitude in X. laevis oocytes with hAQP1. (A) Time course of experimental (dots) and simulated (lines) relative volumes obtained with four gradients of different magnitudes (∼50, 100, 150, and 200 mM mannitol). Continuous lines are the best-fitted responses simulated with the VPfM. The obtained values are 0.0028, 0.0019, 0.0033, and 0.0035 cm·s−1, respectively. Dashed lines are the predicted responses obtained with the CPfM, using the best-fitted value obtained with Eq. 1 up to 10 s. These values are 0.0023, 0.0021, 0.0032, and 0.0020 cm·s−1, respectively. (B) Time courses of obtained in simulations shown in A. Pressure changes seem to occur faster with higher gradients. (C) Time courses of obtained in simulations shown in A. The water pathway transitions from open to closed states occur faster with higher gradients. In all cases, indicates the initial osmotic difference.
Table 2.
Simulated data obtained with VPfM at 10 s in EOOs
| Nominal (mM) | Measured (mM) | × 10−4 (cm·s−1) | × 10−4 (cm·s−1) | T (mN/m) | ∗ | n | ||
|---|---|---|---|---|---|---|---|---|
| 50 | 48.5 ± 0.7 | 27 ± 5 | 26 ± 4.5 a | 1.010 ± 0.002 a | 1.38 ± 0.08 a | 2.7 ± 0.1a | 99.05 ± 0.16 | 6 |
| 100 | 91.0 ± 4.9 | 19 ± 1 | 19 ± 1.2 a,b | 1.014 ± 0.001 a | 1.53 ± 0.28 a | 2.8 ± 0.1a | 98.65 ± 0.11 | 3 |
| 150 | 137.5 ± 9.7 | 18 ± 9 | 14 ± 4.6 a,b | 1.016 ± 0.006 a,b | 1.59 ± 0.15 a | 3.1 ± 0.4a,b | 98.44 ± 0.51 | 4 |
| 200 | 199.4 ± 1.3 | 25 ± 5 | 14 ± 1.9 b | 1.029 ± 0.005 b | 2.04 ± 0.29 b | 4.5 ± 0.6 b | 97.82 0.48 | 5 |
The ionic force was the same in both compartments. is modified by relative pressure according to Eq. 2. was determined by the model according to Eq. 3 (Fig. 1C). Membrane tension was calculated from according to the function shown in Fig. S3 (solid dots). Different letters indicate significant differences between data within the same column (p < 0.05, Mann-Whitney test).
Internal osmolarity expressed as a percentage of the initial value.
Significant differences between data (p<0.05, Mann-Whitney test).
Significant differences between data (p<0.05, Mann-Whitney test).
In conclusion, given that 1), hAQP1 is overexpressed in our experimental system; 2), driven by osmosis produces increments (Fig. 2 A); 3), increments produce increments (Fig. 1 B); 4), the VPfM predicts that increments will produce decrements (Eq. 2 and Fig. 2 B); 5), the experimental − relationship was obtained under steady-state conditions, thus satisfying Laplace’s law (Fig. 1, A and B); and 6), the EOO technique allows one to discard any cytoplasmic effect (i.e., phosphorylation events), it is feasible to hypothesize that the modulation of hAQP1 channels would be directly mediated by membrane-tension variations.
hAPQ1 modulation by membrane tension could occur through a cooperative mechanism
In the four experimental series used to test the effect of different driving forces using mannitol, the relative volume time courses show increasing swelling rates and subsequent flattening (Fig. 4 A). Again, all simulations show a close fit with experiments along the entire record. The mean values obtained from best fits are shown in Table 2. These experiments indicate that internal pressure increases (Fig. 4 B), whereas values decrease along the osmotic response (Fig. 4 C). This phenomenon is more apparent at higher gradients, showing the greatest effect at 200 mM mannitol (Table 2).
The dashed lines in Fig. 4 A show the predicted osmotic responses obtained using the CPfM. Again, values were previously obtained by model-dependent fitting up to 10 s and then used together with initial experimental data to simulate the osmotic responses up to 180 s. As previously noted, a model like this (i.e., one that considers a constant value as the only parameter) cannot reproduce experimental data.
If we assume that changes in membrane width are insignificant, we can use each pressure value to calculate its corresponding T value (Table 2). Therefore, the results in Fig. 4 are also consistent with the hypothesis of a hAPQ1 modulation mechanism gated by membrane tension.
Results obtained with 200 mM gradients show that small volume increments (∼3%) produce a ∼50% reduction in (Table 2). This volume change corresponds with T values of 4.5 ± 0.6 mN/m (Table 2).
To find a possible explanation for the mechanism underlying regulation by membrane tension, we ran additional simulations (Fig. 5). Data obtained from these simulations were analyzed at 10 s because internal osmolarity does not change significantly up to this time (Table 2). Because changes in and membrane area are depreciated up until 10 s, during this time depends only on . Results in Fig. 5 indicate that values decrease with osmotic gradient increments, following a sigmoidal curve. Fitting the results to a Hill equation (continuous line in Fig. 5) shows a cooperative interaction among approximately four cooperative sites. Because AQP monomers arrange into tetramers in the membrane, this result is consistent with a model for hAQP1 that transits from open to closed states involving a cooperative transition among monomers.
Figure 5.
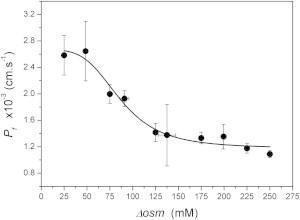
Relationship between and , 10 s after the beginning of the osmotic shock. Dots represent values at 10 s (mean ± SE). Data for 50, 100, 150, and 200 mM gradients were obtained from simulations in Fig. 4. Data for gradients of 25, 75, 125, 175, 225, and 250 mM were obtained from simulations applying the VPfM as described in Materials and Methods. The continuous line fits (R2 > 0.97) to the Hill function: , where and are the initial and final values, is the osmotic gradient, is the osmotic gradient at which the half value between and is obtained, and n is the number of cooperative sites. The fitting parameter values are : (2.7 ± 0.1) × 10−3 cm·s−1; : (1.2 ± 0.1) × 10−3 cm·s−1; : 86.3 ± 6.5 mM; n: 3.89 ± 1.16. The fitting curve was obtained with OriginPro 8 software, v8.0724 (OriginLab, Northampton, MA).
changes induced by membrane tension are reversible
In another experimental series, the model was contrasted with consecutive swelling and shrinkage induced in the same oocyte. Once again, the simulated results (Fig. 6 A) show a close fit to experimental data. In addition, Fig. 6 B shows that the permeability changes are actually reversible. Moreover, the derivative of Fig. 6 B reflects the proposed cooperative effect among monomers (see Fig. S6).
Figure 6.
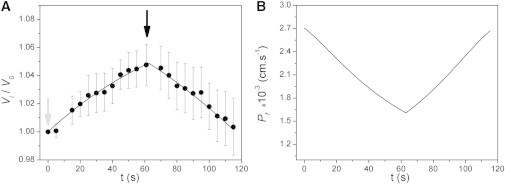
VPfM contrasted with consecutive hypo- and hyperosmotic mannitol gradients. (A) Time course of experimental (dots) and simulated (line) relative volumes. Experimental records show the mean ± SE of five independent experiments that began under hypoosmotic conditions and then, after 60 s, a hyperosmotic gradient was established. The light gray arrow indicates the beginning of the hypoosmotic gradient, and the black arrow indicates the beginning of the hyperosmotic gradient. Both hypo- and hyperosmotic gradients were 50 mM mannitol. (B) Time course of values predicted by the model from the same simulation shown in A. Clearly, the VPfM predicts reversible changes, which reflect the symmetry observed in volume changes during the osmotic response. For more details, see the Supporting Material.
Control experiments with gramicidin A prove that VPfM is specific for hAQP1
To test the specificity of the proposed tension effect on hAQP1 in Xenopus oocytes, we conducted osmotic experiments with another type of pore with a different structure. In this case, gradients of 200 mM and 400 mM mannitol were tested in EOOs with gramicidin A. Just as with hAQP1 (Fig. 4), experiments with gramicidin A were done using the same ionic force in both compartments. In simulations with VPfM, a poor fit with experimental results was obtained (data not shown). As shown in Fig. 7, experiments with 200 and 400 mM mannitol were linear up to ∼80 s and ∼120 s, with final relative volumes of ∼1.1 and ∼1.25, respectively. Clearly, these volume time courses are different from those obtained with hAQP1 (Fig. 4). The osmotic response with gramicidin A does not show any type of regulation in a situation where membrane tension increases; thus, the simpler and classic CPfM is better suited to explain this behavior.
Figure 7.
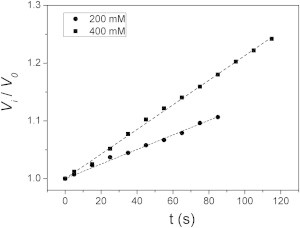
Osmotic experiments in EOOs with gramicidin A. The osmotic responses of two typical experiments with EOOs expressing gramicidin A are shown as the relative volume time course (dots). Gradients of 200 (circles) and 400 (squares) mM mannitol were tested. Responses are linear (R2 > 0.99 in both cases) until volume changes of 10% and 25%, respectively, occur. VPfM does not fit in these cases.
Discussion
Elastic properties of the oocyte membrane and the − relationship
Measurements obtained to study the membrane elastic properties showed that internal pressure differences between EOOs and whole oocytes could be a consequence of the absence or presence of the oocyte content.
The maximal tension and E values we obtained in whole oocytes were similar to previously reported data (Table 1) and were also comparable to values obtained in Rana temporaria oocytes under isotonic conditions (T ∼1.5 mN/m, and E ∼12 × 107 dyn·cm−5) (20). Previously published E values obtained in Xenopus oocytes without AQPs were estimated from osmotic experiments in which volume increments were continuous (18), as opposed to our determinations, which were made under stepwise controlled conditions. This difference in our experimental series has two major implications: 1), − data pairs can be measured at steady states; and 2), the function of E can be obtained (Fig. S4). At each steady state, and have a unique and constant value, and thus Laplace’s law can be applied in each step (Fig. 1 A). Given this condition, a mean value can be directly associated with a mean T value (Table 2, and Fig. S3). Another important issue to point out is that because the experiments reported by Kelly and Macklem (17) and Kelly et al. (18) were done in whole oocytes, their measurements were influenced by the effects of both cellular membrane and cell content (including cytoskeleton). In contrast, our use of the EOO technique has an important consequence: cellular cytoplasm is not present. This could explain the differences observed between maximal pressures in EOOs and whole oocytes (Table 1). In EOOs, water entering the internal compartment distributes in a bulk-water-like environment, producing hydrostatic pressure values that are not reached in whole oocytes (Table 1). Results obtained from atomic force microscopy (AFM) measurements in primary rat astrocytes show that during osmotic swelling, cells actually soften rather than stiffen as their volume increases (21). The explanation proposed by the authors for this counterintuitive result is that in intact cells (i.e., with cytoplasm), the cytoskeleton acts as a cross-linked gel, so that the stress produced by the added volume is distributed in three dimensions, as would occur inside a medium such as a gel or a sponge. Therefore, water molecules entering the cell are partially trapped inside the gel-like medium of the cytoplasm, and thus exert less hydrostatic pressure than would be expected.
In conclusion, it is the absence of cytoplasm that would explain the main differences observed between EOOs and whole oocytes.
Examining the hypothesis of hAQP1 modulation by membrane tension
The Xenopus oocyte is a very large cell (∼1–1.4 mm in diameter) that is covered by a glycoprotein shell called the vitelline envelope , which exerts most of the elastance of the Xenopus oocyte membrane (18). The rupture of this membrane indicates the maximal limit up to which the VE can resist deformation. Could it be that decreases in are actually mediated by the elastic properties of the VE instead of the plasma membrane? Simultaneous measurements show that small increments induce important changes in . For example, 10 s after the highest gradient is tested (200 mM mannitol), there is an important closure of the water pathway (∼50%) showing a volume increment of only ∼3%, whereas the pressure increment is ∼100% (Table 2). At this time, the relative volume is far from the ∼30% upper limit that the oocyte membrane can resist before rupture (Table 1) (17,22). Our results show that the water pathway begins to close with small volume increments that are one order of magnitude below the relative volume reached at rupture. Therefore, the possibility that closure is mediated by the elastance of the VE was discarded.
In addition, changes in the driving force of water movement were also discarded as the cause of the observed effect. Because at 10 s changes in area and are small enough to be depreciated (Table 2), up to this time depends only on .
Another possibility is that the flattening of the osmotic response was a consequence of the internal hydrostatic pressure increment. However, when this hypothesis was tested, the elastic properties of the system could not resist the enormous hydrostatic pressures needed to oppose the osmotic pressure that drives the water flux toward the internal side of the system (see other tested models in the Supporting Material). Thus, the idea that internal hydrostatic pressure increments reduce internal water flow was discarded. A clear explanation for the equivalence between hydrostatic pressure and osmotic pressure can be found in the literature (20).
The nonlinear response of hAQP1 was not reproduced with gramicidin A. Instead, a clearly linear behavior was observed, indicating that the VPfM specifically describes the T effect on hAQP1.
Considering the proposed model and discarding all other factors, membrane tension emerges as the main cause of hAQP1 modulation. Although a previous work (with vesicles from rabbit kidney proximal tubules) suggested the possibility of AQP1 modulation by changes in membrane tension (23), the authors described this mechanism as “pure conjecture” at the time.
In nature, there are several examples of channel permeability being modulated by membrane tension. Here we present results for hAQP1 expressed in Xenopus oocytes, where T values of 4.5 ± 0.6 mN/m produce a ∼50% decrease of (Table 2). In osteoblasts, the tension predicted to obtain a 50% aperture of mechanosensitive Cl− channels is ∼0.5 mN/m (24). Additionally, our results show that hAQP1 permeability changes occur with small volume increments (∼3%). A similar behavior was observed with K+ channels (voltage-gated KCNQ1) coexpressed with AQP1 in Xenopus oocytes (25). This work shows that under hypoosmotic conditions, the conductance of KCNQ1 increases considerably with even small swelling responses (<8%).
Several reports have indicated that T values depend on the characteristics of the lipids that compose the membrane and the amount of associated proteins. It was reported that in fibroblast cells (NIH3T3), the tensile strength at rupture is ∼3.83 ± 1.94 mN/m (26). This value is similar to the ∼3 mN/m observed in artificial lipid vesicles with more than one unsaturated double bond (27). However, the same work demonstrated that with only one unsaturated double bond, rupture tension rises to ∼10 mN/m. In addition, another report demonstrated that membrane tension in avidin-coated vesicles is 2-fold higher than in naked vesicles (28).
Considering the differences between mammalian cells and Xenopus oocytes, and the fact that T values vary with membrane composition, the value observed for a ∼50% closure of hAQP1 is not so far from values reported for mechanosensitive ion channels in mammals. We speculate that this membrane-tension mechanism would play a protective role in cells with high that are suddenly faced with high osmotic gradients. This mechanism would protect the cell under extreme conditions in which other regulation mechanisms would not be fast enough (29).
Does hAQP1 behave as a two-state channel?
The VPfM appropriately explains the osmotic response of EOOs with hAQP1 (a high-water-permeability pathway) with osmotic gradients of different magnitude. Simulations predict decrements induced by increasing internal pressure.
Models that consider a variable are slowly transforming our perspective on AQP regulation. In this context, Moshelion and co-workers (30) tested several models to explain the osmotic response of maize ZmPIP2;5, which is located in the membrane of the protoplast. The authors concluded that a positive regulation of ZmPIP2;5 would be responsible for variations. In addition, Ye et al. (31) proposed a gating mechanism for algae AQP closure based on experiments in which was measured in the presence of impermeable solutes of different sizes. The authors concluded that these solutes induce a tension decrement in the water chain inside the single-file region of the AQP pore, thereby reducing transport rates. To explain their results, they applied the cohesion/tension mechanism, which is based on intermolecular forces among water molecules. The original contribution of our variable model is that it offers a different point of view on AQP regulation: it proposes a direct effect of membrane tension on variations, and thus dismisses the role of solutes in regulation. A possible explanation for changes could be a conformational modification in the selectivity filter of hAQP1 (i.e., the ar/R region, where Arg195 is located), which could be mediated by membrane-tension changes. In line with this supposition, recent in silico experiments showed that AQY1 possesses a gating mechanism that connects inner channel gating residues with surface residues, which explains how the surrounding membrane properties may affect the channel. The same work also reported that the monomeric permeability coefficient of hAQP1 correlates with structural changes around the ar/R region of the water pore, where positional changes in Arg195 occur in a correlated manner with residues Asn127, Phe212, Ile211, and Trp210 (32).
Variable values were also obtained in MD simulations for the homolog Arg216 of AQP4 (12). These results coincided with two clear positions observed by crystallography (33). Another MD simulation suggested an AQP4-gating mechanism that is induced by changes in the external electrical field. In this case, the residue involved would be His201 (34). In contrast to AQP4, different values correlating with different Arg195 positions were predicted in AQP1 (12). Interestingly, these positions have been observed by crystallography (35,36). Our results with hAQP1 are in agreement with studies that have reported more than two possible states for this channel (12,35,36).
The nonlinear relationship between and can be explained by the VPfM
The proposed VPfM appropriately explains the osmotic response of EOOs with hAQP1 exposed to different gradients while maintaining the ionic force. Data obtained from biological experiments and simulations with gradients of different magnitude show that a cooperative effect exists in the transition of hAQP1 from an open to a closed state.
In a previous publication, our experimental results showed that the relationship between and at 10 s is nonlinear (8). Two possible explanations were proposed. The first focused on the interaction between water molecules and residues at the NPA filter. This hypothesis was based on the rationale that this interaction has a limited rate. The second hypothesis was based on a gating mechanism mediated by membrane tension. The results presented in this report support the latter hypothesis. However, the possibility that this mechanism concurs altogether with interactions between water molecules and residues at the NPA filter cannot be discarded.
Hill and co-workers (37) proposed an osmosensor model for AQPs. According to this model, each monomer would suffer conformational changes gated by membrane-tension variations induced by volume changes. This conformational change would involve, in a cooperative manner, from one to all four monomers depending on the magnitude of the osmotic gradient. As a consequence, this mechanism would trigger intracellular signals to regulate volume changes. As previously mentioned, EOOs are depleted from their cytoplasmic content, and thus intracellular signaling mechanisms are discarded in our system (8). However, our results are consistent with a cooperative effect among monomers, in which the proposed mechanism is gated in a reversible manner by the direct effect of membrane-tension changes.
By means of AFM, Möller and co-workers (38) gave the first detailed description of the forces that stabilize the structure of hAQP1. Their results indicate that each monomer is subjected to its own strong torsion forces but is also affected by intermolecular forces from adjacent monomers. Based on this evidence, it is possible to hypothesize that the closure of each hAQP1 monomer would also affect the others. Low membrane tensions would be associated with a high proportion of open monomers within the hAQP1 population, whereas higher tensions would reduce this proportion.
Conclusions
In this work we have presented experimental results combined with model predictions regarding the osmotic permeability regulation of hAQP1 expressed in Xenopus oocyte membranes. First, we studied the elastic properties of oocyte membranes experimentally to obtain a function between internal pressure and volume in steady-state conditions. We then used the results to design a model in which osmotic permeability could be tested as a membrane-tension-dependent variable. Finally, we contrasted this model with osmotic experiments involving biological membranes overexpressing hAQP1. Because 1), the − relationship used to create the VPfM was measured in stepwise conditions; and 2), this model predicts volume changes and permeability coefficients of osmotic responses that closely fit experimental determinations, the VPfM is shown to be robust. Predicted changes indicate the transition of the hAQP1 water channel from a state of high water permeability to a closed state during swelling. Contrasting the model with experiments under consecutive hypo- and hyperosmotic conditions shows that this response is reversible. We conclude that hAQP1 is a constitutively open channel that closes with increments of membrane tension, showing a cooperative effect among monomers, and that this behavior is reversible.
Of interest, the membrane-tension values that trigger the closure of hAQP1 are comparable to those reported for the gating of other channels. This would indicate that membrane-gated channels involved in the transport of ions or water respond to similar values of T and its related variables, and .
Finally, the membrane-tension mechanism proposed in this work for closure of hAQP1 could be a rapid and important process for regulating water movement in cells with hAQP1. This phenomenon is crucial because all other known mechanisms related to volume regulation depend on intracellular signaling or cellular activity and thus are not able to modify membrane water permeability as quickly.
Acknowledgments
We thank Dr. Osvaldo Chara, who developed previous models and versions of the software code, for his work with M.O. on the VPfM.
This work was supported by grants from Agencia Nacional de Promoción Científica y Tecnológica (ANPCyT-PICT 32988), Consejo Nacional de Investigaciones Científicas y Técnicas (CONICET PIP 11220100100095), and Universidad de Buenos Aires (UBACyT 20020090200689).
Supporting Material
References
- 1.Preston G.M., Carroll T.P., Agre P. Appearance of water channels in Xenopus oocytes expressing red cell CHIP28 protein. Science. 1992;256:385–387. doi: 10.1126/science.256.5055.385. [DOI] [PubMed] [Google Scholar]
- 2.Zardoya R. Phylogeny and evolution of the major intrinsic protein family. Biol. Cell. 2005;97:397–414. doi: 10.1042/BC20040134. [DOI] [PubMed] [Google Scholar]
- 3.Preston G.M., Jung J.S., Agre P. The mercury-sensitive residue at cysteine 189 in the CHIP28 water channel. J. Biol. Chem. 1993;268:17–20. [PubMed] [Google Scholar]
- 4.Yasui M., Hazama A., Agre P. Rapid gating and anion permeability of an intracellular aquaporin. Nature. 1999;402:184–187. doi: 10.1038/46045. [DOI] [PubMed] [Google Scholar]
- 5.Hirano Y., Okimoto N., Yasui M. Molecular mechanisms of how mercury inhibits water permeation through aquaporin-1: understanding by molecular dynamics simulation. Biophys. J. 2010;98:1512–1519. doi: 10.1016/j.bpj.2009.12.4310. [DOI] [PMC free article] [PubMed] [Google Scholar]
- 6.Yukutake Y., Tsuji S., Suematsu M. Mercury chloride decreases the water permeability of aquaporin-4-reconstituted proteoliposomes. Biol. Cell. 2008;100:355–363. doi: 10.1042/BC20070132. (Erratum in: Biol. Cell 100:561) [DOI] [PubMed] [Google Scholar]
- 7.Migliati E., Meurice N., Yool A.J. Inhibition of aquaporin-1 and aquaporin-4 water permeability by a derivative of the loop diuretic bumetanide acting at an internal pore-occluding binding site. Mol. Pharmacol. 2009;76:105–112. doi: 10.1124/mol.108.053744. [DOI] [PMC free article] [PubMed] [Google Scholar]
- 8.Ozu M., Dorr R.A., Toriano R. Water flux through human aquaporin 1: inhibition by intracellular furosemide and maximal response with high osmotic gradients. Eur. Biophys. J. 2011;40:737–746. doi: 10.1007/s00249-011-0687-2. [DOI] [PubMed] [Google Scholar]
- 9.Törnroth-Horsefield S., Hedfalk K., Neutze R. Structural insights into eukaryotic aquaporin regulation. FEBS Lett. 2010;584:2580–2588. doi: 10.1016/j.febslet.2010.04.037. [DOI] [PubMed] [Google Scholar]
- 10.Fetter K., Van Wilder V., Chaumont F. Interactions between plasma membrane aquaporins modulate their water channel activity. Plant Cell. 2004;16:215–228. doi: 10.1105/tpc.017194. [DOI] [PMC free article] [PubMed] [Google Scholar]
- 11.Bellati J., Alleva K., Amodeo G. Intracellular pH sensing is altered by plasma membrane PIP aquaporin co-expression. Plant Mol. Biol. 2010;74:105–118. doi: 10.1007/s11103-010-9658-8. [DOI] [PubMed] [Google Scholar]
- 12.Hub J.S., Aponte-Santamaría C., de Groot B.L. Voltage-regulated water flux through aquaporin channels in silico. Biophys. J. 2010;99:L97–L99. doi: 10.1016/j.bpj.2010.11.003. [DOI] [PMC free article] [PubMed] [Google Scholar]
- 13.Wan X., Steudle E., Hartung W. Gating of water channels (aquaporins) in cortical cells of young corn roots by mechanical stimuli (pressure pulses): effects of ABA and of HgCl2. J. Exp. Bot. 2004;55:411–422. doi: 10.1093/jxb/erh051. [DOI] [PubMed] [Google Scholar]
- 14.Soveral G., Madeira A., Moura T.F. Membrane tension regulates water transport in yeast. Biochim. Biophys. Acta. 2008;1778:2573–2579. doi: 10.1016/j.bbamem.2008.07.018. [DOI] [PubMed] [Google Scholar]
- 15.Fischer G., Kosinska-Eriksson U., Lindkvist-Petersson K. Crystal structure of a yeast aquaporin at 1.15 angstrom reveals a novel gating mechanism. PLoS Biol. 2009;7:e1000130. doi: 10.1371/journal.pbio.1000130. [DOI] [PMC free article] [PubMed] [Google Scholar]
- 16.Finkelstein A. Wiley & Sons; New York: 1987. Water Movement through Lipid Bilayers, Pores, and Plasma Membranes. [DOI] [PubMed] [Google Scholar]
- 17.Kelly S.M., Macklem P.T. Direct measurement of intracellular pressure. Am. J. Physiol. 1991;260:C652–C657. doi: 10.1152/ajpcell.1991.260.3.C652. [DOI] [PubMed] [Google Scholar]
- 18.Kelly S.M., Jia Y.L., Macklem P.T. Measurement of elastic properties of Xenopus oocytes. Comp. Biochem. Physiol. A Physiol. 1997;118:607–613. doi: 10.1016/s0300-9629(96)00483-5. [DOI] [PubMed] [Google Scholar]
- 19.Hill W.G., Southern N.M., Zeidel M.L. Isolation and characterization of the Xenopus oocyte plasma membrane: a new method for studying activity of water and solute transporters. Am. J. Physiol. Renal Physiol. 2005;289:F217–F224. doi: 10.1152/ajprenal.00022.2005. [DOI] [PubMed] [Google Scholar]
- 20.Mild K.H., Lovtrup S., Bergfors T. On the mechanical properties of the vitelline membrane of the frog egg. J. Exp. Biol. 1974;60:807–820. doi: 10.1242/jeb.60.3.807. [DOI] [PubMed] [Google Scholar]
- 21.Spagnoli C., Beyder A., Sachs F. Atomic force microscopy analysis of cell volume regulation. Phys. Rev. E Stat. Nonlin. Soft Matter Phys. 2008;78:031916. doi: 10.1103/PhysRevE.78.031916. [DOI] [PMC free article] [PubMed] [Google Scholar]
- 22.Ozu M., Dorr R., Parisi M. New method to measure water permeability in emptied-out Xenopus oocytes controlling conditions on both sides of the membrane. J. Biochem. Biophys. Methods. 2005;63:187–200. doi: 10.1016/j.jbbm.2005.04.007. [DOI] [PubMed] [Google Scholar]
- 23.Soveral G., Macey R.I., Moura T.F. Water permeability of brush border membrane vesicles from kidney proximal tubule. J. Membr. Biol. 1997;158:219–228. doi: 10.1007/s002329900259. [DOI] [PubMed] [Google Scholar]
- 24.Charras G.T., Williams B.A., Horton M.A. Estimating the sensitivity of mechanosensitive ion channels to membrane strain and tension. Biophys. J. 2004;87:2870–2884. doi: 10.1529/biophysj.104.040436. [DOI] [PMC free article] [PubMed] [Google Scholar]
- 25.Grunnet M., Jespersen T., Klaerke D.A. KCNQ1 channels sense small changes in cell volume. J. Physiol. 2003;549:419–427. doi: 10.1113/jphysiol.2003.038455. [DOI] [PMC free article] [PubMed] [Google Scholar]
- 26.Tan S.C.W., Yang T., Liao K. Rupture of plasma membrane under tension. J. Biomech. 2011;44:1361–1366. doi: 10.1016/j.jbiomech.2011.01.010. [DOI] [PubMed] [Google Scholar]
- 27.Olbrich K., Rawicz W., Evans E. Water permeability and mechanical strength of polyunsaturated lipid bilayers. Biophys. J. 2000;79:321–327. doi: 10.1016/S0006-3495(00)76294-1. [DOI] [PMC free article] [PubMed] [Google Scholar]
- 28.Dieluweit S., Csiszár A., Merkel R. Mechanical properties of bare and protein-coated giant unilamellar phospholipid vesicles. A comparative study of micropipet aspiration and atomic force microscopy. Langmuir. 2010;26:11041–11049. doi: 10.1021/la1005242. [DOI] [PubMed] [Google Scholar]
- 29.Conner M.T., Conner A.C., Bill R.M. Rapid aquaporin translocation regulates cellular water flow: mechanism of hypotonicity-induced subcellular localization of aquaporin 1 water channel. J. Biol. Chem. 2012;287:11516–11525. doi: 10.1074/jbc.M111.329219. [DOI] [PMC free article] [PubMed] [Google Scholar]
- 30.Moshelion M., Moran N., Chaumont F. Dynamic changes in the osmotic water permeability of protoplast plasma membrane. Plant Physiol. 2004;135:2301–2317. doi: 10.1104/pp.104.043000. [DOI] [PMC free article] [PubMed] [Google Scholar]
- 31.Ye Q., Wiera B., Steudle E. A cohesion/tension mechanism explains the gating of water channels (aquaporins) in Chara internodes by high concentration. J. Exp. Bot. 2004;55:449–461. doi: 10.1093/jxb/erh040. [DOI] [PubMed] [Google Scholar]
- 32.Krivobokova T., Briones R., de Groot B.L. Partial least-squares functional mode analysis: application to the membrane proteins AQP1, Aqy1, and CLC-ec1. Biophys. J. 2012;103:786–796. doi: 10.1016/j.bpj.2012.07.022. [DOI] [PMC free article] [PubMed] [Google Scholar]
- 33.Ho J.D., Yeh R., Stroud R.M. Crystal structure of human aquaporin 4 at 1.8 A and its mechanism of conductance. Proc. Natl. Acad. Sci. USA. 2009;106:7437–7442. doi: 10.1073/pnas.0902725106. [DOI] [PMC free article] [PubMed] [Google Scholar]
- 34.Garate J.A., English N.J., MacElroy J.M.D. Human aquaporin 4 gating dynamics in dc and ac electric fields: a molecular dynamics study. J. Chem. Phys. 2011;134:055110. doi: 10.1063/1.3529428. [DOI] [PubMed] [Google Scholar]
- 35.Murata K., Mitsuoka K., Fujiyoshi Y. Structural determinants of water permeation through aquaporin-1. Nature. 2000;407:599–605. doi: 10.1038/35036519. [DOI] [PubMed] [Google Scholar]
- 36.Sui H., Han B.G., Jap B.K. Structural basis of water-specific transport through the AQP1 water channel. Nature. 2001;414:872–878. doi: 10.1038/414872a. [DOI] [PubMed] [Google Scholar]
- 37.Hill A.E., Shachar-Hill B., Shachar-Hill Y. What are aquaporins for? J. Membr. Biol. 2004;197:1–32. doi: 10.1007/s00232-003-0639-6. [DOI] [PubMed] [Google Scholar]
- 38.Möller C., Fotiadis D., Müller D.J. Determining molecular forces that stabilize human aquaporin-1. J. Struct. Biol. 2003;142:369–378. doi: 10.1016/s1047-8477(03)00066-2. [DOI] [PubMed] [Google Scholar]
- 39.Dumont J.N. Oogenesis in Xenopus laevis (Daudin). I. Stages of oocyte development in laboratory maintained animals. J. Morphol. 1972;136:153–179. doi: 10.1002/jmor.1051360203. [DOI] [PubMed] [Google Scholar]
- 40.Abrami L., Simon M., Ripoche P. Sequence and functional expression of an amphibian water channel, FA-CHIP: a new member of the MIP family. Biochim. Biophys. Acta. 1994;1192:147–151. doi: 10.1016/0005-2736(94)90155-4. [DOI] [PubMed] [Google Scholar]
- 41.Daniels M.J., Mirkov T.E., Chrispeels M.J. The plasma membrane of Arabidopsis thaliana contains a mercury-insensitive aquaporin that is a homolog of the tonoplast water channel protein TIP. Plant Physiol. 1994;106:1325–1333. doi: 10.1104/pp.106.4.1325. [DOI] [PMC free article] [PubMed] [Google Scholar]
- 42.Dorr R., Ozu M., Parisi M. Simple and inexpensive hardware and software method to measure volume changes in Xenopus oocytes expressing aquaporins. J. Neurosci. Methods. 2007;161:301–305. doi: 10.1016/j.jneumeth.2006.11.005. [DOI] [PubMed] [Google Scholar]
- 43.Pickard W.F. Modelling the swelling assay for aquaporin expression. J. Math. Biol. 2008;57:883–903. doi: 10.1007/s00285-008-0196-9. [DOI] [PubMed] [Google Scholar]
- 44.Chandy G., Zampighi G.A., Hall J.E. Comparison of the water transporting properties of MIP and AQP1. J. Membr. Biol. 1997;159:29–39. doi: 10.1007/s002329900266. [DOI] [PubMed] [Google Scholar]
- 45.Costa P.F., Emilio M.G., Ferreira K.G. Determination of ionic permeability coefficients of the plasma membrane of Xenopus laevis oocytes under voltage clamp. J. Physiol. 1989;413:199–211. doi: 10.1113/jphysiol.1989.sp017649. [DOI] [PMC free article] [PubMed] [Google Scholar]
- 46.Ozu M., Dorr R.A., Toriano R. A counterpoint between computer simulations and biological experiments to train new members of a laboratory of physiological sciences. Adv. Physiol. Educ. 2012;36:345–351. doi: 10.1152/advan.00069.2012. [DOI] [PubMed] [Google Scholar]
Associated Data
This section collects any data citations, data availability statements, or supplementary materials included in this article.