

Abstract
It is shown that the nonlinear optical phenomenon known as second-harmonic generation can be used for label-free, time-resolved study of the transport of molecules through living cell membranes. The adsorption and transport of a 300-Da molecular-mass hydrophobic ion at the Escherichia coli membrane is observed. Remarkably, at low ion concentrations, the second-harmonic generation technique clearly exposes a multistep molecular transport process: Transport of the molecular ion across the outer and cytoplasmic membranes of the Gram-negative bacteria is recorded, in sequence, in time. Fitting of the data to a multiprocess kinematic model reveals that the transport of this hydrophobic ion through the outer membrane is much faster than through the cytoplasmic membrane, likely reflecting the effectiveness of ion transport porins. The observations illustrate an experimental means for studying the interactions of small molecules with cell membranes.
Introduction
A fundamental understanding of the transport of small, druglike molecules into living cells is critical for rational drug design and pharmacology in general. Elucidation of these processes requires the development of efficient experimental capabilities to characterize the factors important to the adsorption and penetration of molecules across cell membranes. The investigation of the adsorption and transport of small- and medium-size molecules has been conducted for decades through a variety of methods (1–5), most of which rely on measurements of intracellular and extracellular concentrations of the molecule of interest for deducing interfacial activities at the cell membrane. Real-time measurement of concentrations in the solution phase, but not at the membrane, can be achieved only under harsh conditions (4,5). Overall, studies of molecular transport across intact, living cells have been restricted to measurements of solution characteristics, not membrane characteristics, and without time-resolution.
We report here a method based on the nonlinear optical phenomenon, second-harmonic generation (SHG), which can be used for studying molecular transport through living cell membranes with time-resolution. Some media can convert a small amount of incoming light into twice the incoming frequency, and the detection of this SHG can provide time-resolved structural information, particularly at interfaces (6–10). Specifically, the ability of a single molecule to generate a second-harmonic (SH) response depends on its symmetry: the molecule of interest (i.e., a small molecule to be transported across a membrane) must have a structure without a center of inversion symmetry such that it possesses a nonlinear hyperpolarizability. The ability of an ensemble of such molecules to generate a SH response depends on the summation of their vectorlike nonlinear polarizations: if the molecules are randomly oriented such as those in a liquid solution, the hyperpolarizabilities sum up to zero and no SH signal is observed. However, if the same molecules are adsorbed onto the cell membrane and are oriented in similar directions, they can constructively interfere to give a SH signal. A key advantage which this symmetry dependent phenomenon affords is the possibility of detecting a small number of molecules adsorbed on cell membranes against a much larger amount of the same molecules present in the solvent background.
Since the first detection of SHG from molecules adsorbed on microcolloidal particles (6), SHG has been well established as a versatile technique for probing adsorption of a variety of molecules, including biopolymers (7), on a wide range of particles with sizes from nanoscale to tens of microns in dimension (8,9). Of particular relevance to this report is the work of Srivastava and Eisenthal (10), which used SHG to measure, in real-time, molecular transport through a liposome vesicle membrane. The measurement is based on the anticipation that the SH light fields generated from the molecules adsorbed at opposite sides of the membrane would cancel each other due to their exactly opposite orientations. During the transport process, as the molecules adsorb onto the inner side of the membrane, their polarization cancels that of the molecules adsorbed on the outside, causing the SHG signal to decrease. The decay of the SHG intensity in time can thus be related to the transport rate.
We demonstrate in this report the effectiveness of this SHG method for probing label-free molecular transport through living cell membranes by examining the transport kinetics of the hydrophobic ion, malachite green, through Escherichia coli in real-time. The malachite green ion (MG+) represents an ideal candidate for these studies. It has an electronic transition which is resonant with the SH frequency at 420 nm and allows for facile detection of SHG when the molecules are aligned at an interface. Furthermore, its structure, hydrophobicity, and molecular weight all qualify the ion as “druglike” and therefore highly relevant to pharmacological transport. Our study clearly elucidates the uptake of the hydrophobic molecular ion through a multistep process involving transport across both the outer and cytoplasmic membranes of the living E. coli.
Materials and Methods
Materials and sample flow system
The hydrophobic, positively charged malachite green ion (MG+) has the molecular formula of C23H25N2+ (Fig. 1) and a molecular mass of 329.4 Da. The positive charge is delocalized to the surrounding propellerlike hydrophobic groups. The oxalate salt form of malachite green (Cat. No. M9015) was purchased from Sigma-Aldrich (St. Louis, MO) and used without further purification. Solutions were prepared at the desired concentrations in distilled water.
Figure 1.
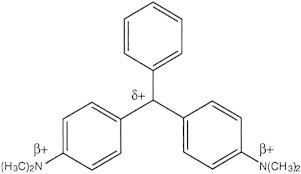
Illustration of the malachite green (MG+) cation structure.
The E. coli MC4100 strain was grown at 37° in Terrific Broth (Cat. No. T0918; Sigma-Aldrich) until saturation. The cells were centrifuged, washed, and resuspended in distilled water for use in the SHG experiments, typically with a concentration of 2 ∼ 4 × 10⁷ cells/mL. Cell density was checked in a Burker-type counting chamber before and after experiments.
The samples for SHG measurements were prepared in a flow system. The cell suspension was pumped with a small motorized liquid pump to form a liquid jet through a nozzle made out of pressed stainless-steel tubing with 1/16 inch inner diameter. The cell suspension in the reservoir was forced out and collected back through tubing (Nalgene; Nalge Nunc, Rochester, NY) connected to the nozzle, and was continuously stirred using a magnetic stirrer. In a typical experiment, a small amount of aqueous solution of MG+ at known high concentration was added into the cell suspension reservoir at t = 0 to achieve a specific concentration between 0.25 μM and 3.00 μM.
Experimental setup for second-harmonic generation
The SHG measurements were conducted using the setup reported previously for monitoring molecular adsorption on solid colloidal particles (7,8). The fundamental light (840 nm, 50-fs pulse width, 4-nJ pulse energy, 76-MHz repetition rate, 1-mm diameter, 0.4-W averaged power) was provided by a Ti:Sapphire femtosecond laser pumped by an Ar ion laser. The operating wavelength was set at 840 nm because its second harmonic is in resonance with an electronic transition of the malachite green ion which thus resonantly enhances the SHG signal. MG+ has a fluorescence band peaked at 460 nm and thus the two-photon fluorescence response from the bulk MG+ at concentrations up to 3 μM has little contribution to the frequency doubled intensity measured at 420 nm. The femtosecond laser pulses provide the high-peak power necessary to observe a nonlinear optical process, while the low-pulse energy-minimized the heating and photochemical effects from light absorption. A long-pass filter (model No. RG695; Schott, Mainz, Germany) was placed before a focusing lens to eliminate any possible second-harmonic generation (SHG) from the components in the optical path up to the sample (which ensured that the collected SHG signal was generated entirely from the sample). The focused fundamental laser beam intercepted the center of the liquid jet perpendicularly and passed through the jet with an ∼1-mm path-length and a peak intensity of 4 × 10⁹ W/cm2 inside the sample. The windowless liquid-jet system prevented SHG from reacting to background materials and improved the signal/noise.
Given the size of the E. coli cells (typically 2-μm long with 1-μm diameter), the SH light generated by surface-adsorbed MG+ can be amply detected in the forward scattering direction, as illustrated by previous studies of SHG from surfaces of particles of various sizes (8,9). The laser beam, after exiting the sample, consisted of the fundamental and second harmonic in the same forward direction and was collected and collimated. The combination of BG39 band-pass filters and a monochromator (1-mm entrance and exit slits, set to 420 nm with a 2-nm bandwidth) effectively eliminated the fundamental light, along with any fluorescence or scattered light at other wavelengths. The rectangular nature of the monochromator slit restricted the light collection to within ±20° in the vertical direction and only ±2° in the horizontal direction. The signal was then detected by a photomultiplier (model No. R585; Hamamatsu, Hamamatsu City, Japan), preamplified with a Stanford amplifier (model No. SR 440; Stanford Research Systems, Sunnyvale, CA), and then processed through a correlated photon counting system (model No. SRS SR400; Stanford Research Systems). The discrimination voltage for suppression of the statistical random noise was set at −100 mV when the PMT was powered at −1300 V. The signal collected was averaged over 1 s.
SHG from malachite green adsorbed at colloidal interfaces
Generally, the second-order polarization of a medium induced by an electromagnetic field of frequency ω and with strength is proportional to the square of . The proportional constant, the macroscopic second-order susceptibility χ(2), is a sum of the individual molecular polarizabilities through a statistical average over molecular orientations, and is thus linearly proportional to N the number density of MG+ at the interface. The SH electric field is , which is linearly dependent on χ(2) and subsequently N. The experimentally recorded SHG intensity therefore is a direct reflection of the surface density of adsorbed MG+ ions as
| (1) |
Because the MG+ ions adsorbed on opposite sides of the membrane are expected to have exactly the opposite orientations, the molecular polarizations on the inner and outer sides of the membrane are expected to cancel with each other. Therefore, in the case of molecular transport across a single membrane, the MG+ ion densities on the outer and inner surfaces, No and Ni, are related to the SH intensity ISH as
| (2) |
While this model has successfully described transport across a single liposome vesicle membrane (11), we will demonstrate that modifications are required to model MG+ transport through E. coli; namely, that we must explicitly account for transport across both the outer and cytoplasmic membranes.
Malachite green ionization and adsorption equilibriums
In the system of interest here, only the MG+ ions give the SHG signal, not the MG molecules in the neutral form. The MG+ ion adsorption isotherm is therefore quantitatively described by a modified Langmuir model that takes the ionization equilibrium into account. Because the pH of the experiments (pH = 7.4 ± 0.1) is in close vicinity to the pKa of the MG+ cation (pKa = 6.8), the ionization equilibrium of the MG+ must be considered in the Langmuir model. In this situation, we need to consider both ionization and adsorption-desorption equilibriums involving MG+ ions in the system:
| (3) |
| (4) |
Thus, the surface coverage, θ, of the MG+ ions on a surface can be expressed as
| (5) |
where N, in the case of the outer surface, is the density of adsorbed ions No; Nmax is the maximum adsorption density; C is the total concentration of the MG molecules including both those in the bulk (neutral and charged species) and those adsorbed on the surface (assumed to be MG+ only); and 55.5 is the molarity of water,
and
Therefore, a nonlinear least-square fitting of the adsorption isotherm will allow the determination of α, K, and the maximum adsorption density, Nmax. Finally, K, at the given pH value, is subsequently used to calculate the adsorption free energy ΔG = −RT lnK.
Results and Discussion
Time-resolved SHG following addition of malachite green to E. coli
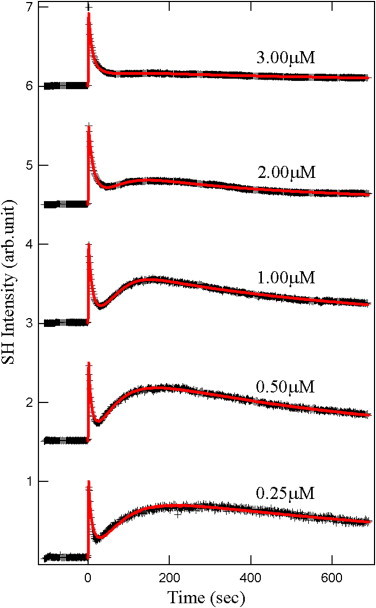
Based on published studies of SHG from MG+ ions adsorption at various colloidal surfaces (6–10), we expect that the addition of MG+ to a suspension of E. coli cells results in a measureable SH response due to the adsorption of the MG+ ions onto the cells. Fig. 2 is the time-resolved SHG intensity detected after MG was mixed into the E. coli solution at t = 0. The E. coli density was 3 × 10⁷ cells/mL and the initial MG concentration (representing all MG molecules in both their neutral and cation forms) ranged from 3 μM down to 0.25 μM. As expected, after the rapid initial rise in the SH signal due to adsorption of MG+ ions onto the cell, the signal begins to decay. At a MG concentration of 3 μM, this decay appears to be monotonic, which is reminiscent of the SH signal due to MG+ transport across a liposome membrane observed by Srivastava and Eisenthal (10). As time proceeds, the hydrophobic ions penetrate the bacteria membrane and bind to its inner leaflet, resulting in the decay of the signal.
Figure 2.
Time-profiles of the SH intensity (normalized) after addition of MG+ ions at various concentrations into solutions containing living E. coli cells. (Red solid lines) Nonlinear least-square fits to the kinetic model.
Remarkably, however, lower concentrations of MG reveal the complexity of the transport phenomena in E. coli. Instead of a monotonic decay, another rise and decay appear in the signal which becomes more pronounced as the concentration is decreased from 2.00 μM down to 0.25 μM. Not only does the SHG method monitor real-time transport through the living membrane, but the SH signal exposes multiple sequential adsorption and transport processes.
Adsorption at the E. coli outer membrane
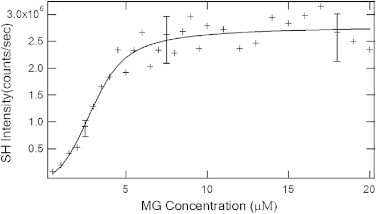
The initial maximum SH intensity immediately after t = 0 (when MG was applied to the E. coli containing solution) is proportional to the square of the coverage of the MG+ ion on the cell membrane before its diffusion into the cell. By plotting the maximum intensity of the SH signal at t = 0 as a function of the MG concentration as in Fig. 3, we obtain the adsorption isotherm which can be quantitatively fit with the modified Langmuir model described above. Langmuir kinetics describes the adsorption as a reversible reaction between the adsorbates in the bulk solution and those on the colloidal surface. The model assumes: adsorption is limited to a monolayer; there is equal probability of adsorption at each surface site; and there are no interadsorbate interactions (12). Generally, for colloidal microsurfaces, the effective surface area can be very large and thus no further simplifying assumptions can be made regarding the magnitude of N in comparison to total concentration, C. The model including the ionization equilibrium of the MG+ ion is described by Eq. 5. A nonlinear least-square fit of the adsorption data to the modified Langmuir model (solid line in Fig. 3) yields a maximum adsorption density of MG+ ions on the cell of Nmax = (7.4 ± 1.2) × 107/cell or (1.2 ± 0.2) × 107/μm2 and an adsorption free energy of ΔG = −(13.6 ± 0.4) kcal/mol.
Figure 3.
Adsorption isotherm expressed in SH intensity for MG+ ion on the E. coli cell. (Solid line) Nonlinear least-square fit of a modified Langmuir model. (Error bars) Standard deviations.
Kinetic model of molecular transport through E. coli membranes
Molecular transport into the cytoplasm of E. coli involves translocation across the two cell membranes of the Gram-negative bacterium (Fig. 4). The outer membrane is asymmetric in its bilayer structure with the outer leaflet composed of lipopolysaccharides and a phospholipid inner leaflet. The membrane also contains ion channels—classic trimeric OmpF porins, with three channels, each with a 7 × 11 Å2 bottleneck that is known to exclude uncharged hydrophobic solutes but permit passive diffusion of hydrophilic compounds with molecular masses smaller than 600 Da (13). The inner cytoplasmic membrane is a symmetric lipid-bilayer structure.
Figure 4.
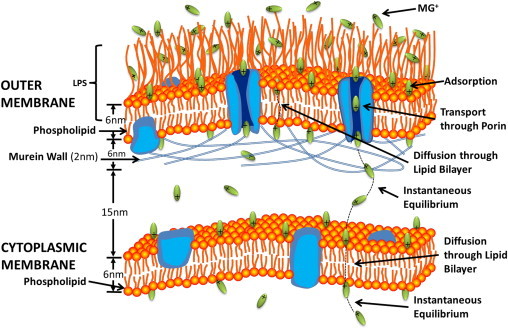
Illustration of the two membranes of E. coli bacteria. Types of interactions of the molecular ion with the membranes are listed on the right side.
A kinetic model that incorporates all the adsorption and transport processes at both membranes is constructed to quantitatively account for the observed time-resolved SH intensity. In the model, transport begins with the adsorption of MG+ to the outermost cell surface. The sharp rise of the SH signal at t = 0 indicates that this initial adsorption rate of MG+ ions is much larger than the translocation rate through the outer membrane. Following the transport of MG+ ions across the outer membrane, the adsorption and transport processes proceed to populate the membrane surfaces as well as the periplasmic and the cytoplasmic regions. (See also the Supporting Material.)
The total adsorption/desorption and transport physical process are depicted in Fig. 5 where M, M1, and M2 represent MG+ molecules in the bulk solution outside the cell membrane, in the periplasmic space between the two membranes, and in the cytoplasmic space, respectively. E1o, E1i, E2o, and E2i denote the empty adsorption sites on the outer surface of the outer membrane, on the inner surface of the outer membrane, on the outer surface of the cytoplasmic membrane, and on the inner surface of the cytoplasmic membrane, respectively. The values ki/k−i (i = 1, 3, 4) are the adsorption/desorption rate constants on the respective cell membrane surfaces, and k2 and k5 are the transport rate constants through the outer membrane and the cytoplasmic membrane, respectively. In this kinetic model, we assume equal forward/backward transport rate constants for both membranes. Due to the symmetry of the cytoplasmic membrane, it is also reasonable to assume equal characteristics (rate constants and maximum number density) for both sides of the cytoplasmic membrane. The kinetic model allows determination of the surface densities N1o, N1i, N2o, N2i as a function of time and, therefore, can be used to simulate the SH intensity using a modified version of Eq. 2 which now incorporates adsorption and transport at both the outer and cytoplasmic membranes:
| (6) |
The transport rate constants, adsorption/desorption rate constants, and maximum adsorption densities on all four surfaces, are variables to be determined through nonlinear least-squares fitting of the experimentally observed SH intensity as a function of time and the applied MG concentration. In the fitting, the initial conditions at time t = 0 are set as: M is equal to the total MG added while M1, M2, N1o, N1i, N2o, and N2i are all equal to zero.
Figure 5.
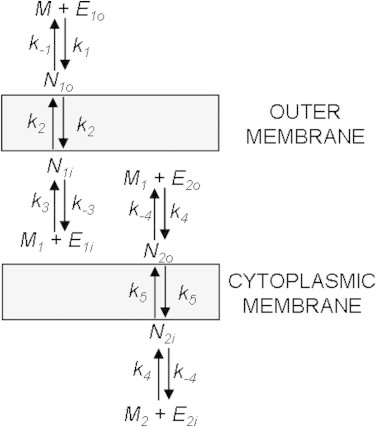
Schematic depiction of all adsorption, desorption, and transport processes and their associated rate constants which comprise the kinetic model. The values M, E, and N represent free MG+, empty surface adsorption sites, and adsorbed MG+, respectively. The values k±1,±3,±4 are adsorption/desorption rate constants and k2,5 are transport rate constants.
Nonlinear least-squares fitting results of the time-resolved SHG
The model fitting results are represented by the solid lines in Fig. 2 and key fitting parameters are summarized numerically in Table 1. Also included in Table 1 is a comparison of the fitting results to those from MG+ transport through a liposome membrane (11).
Table 1.
Fitting results of the kinetic model to the time-resolved SHG traces at MG concentrations from 0.25 μM to 3.00 μM
| Fitting results |
Liposome∗ | ||||||
|---|---|---|---|---|---|---|---|
| [MG] (μM) | 0.25 | 0.50 | 1.00 | 2.00 | 3.00 | Average | |
| Outer membrane | |||||||
| N1omax (× 106μm−2) | 11.2 ± 0.1 | 11.0 ± 0.1 | 11.0 ± 0.1 | 10.4 ± 0.1 | 10.1 ± 0.1 | 10.7 ± 0.6 | 1.9 ± 0.1 |
| N1imax (× 106μm−2) | 1.57 ± 0.09 | 1.60 ± 0.03 | 1.50 ± 0.03 | 1.47 ± 0.03 | 1.47 ± 0.03 | 1.52 ± 0.08 | 1.9 ± 0.1 |
| k2 (× 10−2 s−1) | 3.88 ± 0.04 | 4.14 ± 0.03 | 3.45 ± 0.03 | 2.83 ± 0.01 | 3.82 ± 0.01 | 3.62 ± 0.79 | 0.95 |
| K3 (× 108) | 0.52 ± 0.06 | 0.96 ± 0.03 | 1.15 ± 0.11 | 1.35 ± 0.02 | 1.64 ± 0.02 | 1.12 ± 0.42 | |
| −ΔG1i (kcal/mol) | 10.44 ± 0.1 | 10.80 ± 0.03 | 10.91 ± 0.10 | 11.00 ± 0.01 | 11.12 ± 0.01 | 10.86 ± 0.26 | 8.6 ± 0.2 |
| Cytoplasmic membrane | |||||||
| N2o=2imax (× 106μm−2) | 1.50 ± 0.06 | 1.50 ± 0.03 | 1.54 ± 0.03 | 1.72 ± 0.03 | 1.50 ± 0.03 | 1.55 ± 0.10 | 1.9 ± 0.1 |
| k5 (× 10−4 s−1) | 3.63 ± 0.05 | 6.05 ± 0.03 | 7.87 ± 0.05 | 11.0 ± 0.1 | 4.37 ± 0.04 | 6.58 ± 4.41 | 95 |
| K4 (× 108) | 3.65 ± 0.41 | 8.11 ± 0.22 | 21.4 ± 1.9 | 2.13 ± 0.04 | 14.1 ± 0.1 | 9.88 ± 7.94 | |
| −ΔG2 (kcal/mol) | 11.59 ± 0.11 | 12.06 ± 0.03 | 12.63 ± 0.09 | 11.27 ± 0.02 | 12.38 ± 0.01 | 11.99 ± 0.56 | 8.6 ± 0.2 |
The values N1omax, N1imax, and N2o=2imax represent the maximum adsorption densities of the exterior of the outer membrane, the interior of the outer membrane, and the exterior/interior of the cytoplasmic membrane, respectively. The values k2 and k5 represent the transport rate constants across the outer and the cytoplasmic membranes, respectively, as depicted in Fig. 5. The values K3 and K4 are the adsorption equilibrium constants (ki/k−1) as depicted in Fig. 5. For comparison, the experimental results from Liu et al. (11) for MG+ adsorption onto a liposome surface are included.
From Liu et al. (11).
As seen in Fig. 2, our kinetic model successfully describes the time-resolved SH intensity, supporting the interpretation based on adsorption/transport through the two membranes. Notably, the model accurately predicts that as MG concentration decreases, the distinct sequential transport processes become more apparent. In cases where the MG concentration in solution is low (such as below 2 μM), depletion of MG+ ions in the bulk solution due to transport into the cells occurs. This depletion affects N1o and this effect can be accounted for by applying the modified Langmuir adsorption model (see the Supporting Material), which depicts the relations between the solution MG concentration and the MG+ density at the outer membrane surface.
As a test to the reliability of the model, the maximum adsorption density at the outermost cell surface obtained as a variable in the model fitting, (1.07 ± 0.06) × 107 μm−2 (Table 1), is in good agreement with that determined independently from the adsorption isotherm in Fig. 3, (1.2 ± 0.2) × 107 μm−2. Furthermore, N1i, and N2o = N2i are in good agreement with the maximum number density determined for the liposome membrane (11). The adsorption density, N1o, is one order-of-magnitude higher than the adsorption density at any of the other three interfaces N1i, N2o, and N2i. This is consistent with the complexity of the outer membrane structure, namely the presence of the polysaccharide hairs which can contain acidic moieties.
The adsorption equilibrium rate constants, K3 and K4, yield adsorption free energies for the outer membrane/inner surface and the inner membrane of −10.86 ± 0.26 and −11.99 ± 0.56 kcal/mol, respectively. Both values are lower than the adsorption free energy of MG+ on polystyrene sulfate microspheres, which is reported to be −12.71 kcal/mol and known to be dominated by electrostatic interactions (7). Our values are significantly higher than MG+ adsorption on the liposome membrane, −8.6 kcal/mol (11). This is a likely indication that MG+ adsorption at the E. coli membrane surfaces is driven by charge-charge interactions more than hydrophobic interactions.
The rate constants of transport through the outer membrane (k2) and inner membrane (k5), are determined to be (3.62 ± 0.79) × 10−2 s−1 and (6.58 ± 4.41) × 10−4 s−1, respectively. The transport rate constant of MG+ ions through the inner membrane is more than one order-of-magnitude smaller compared to that determined for the liposome vesicle of 9.5 × 10⁻³ s−1 (11). A significant difference between synthetic liposome membranes and the inner E. coli membrane is the presence of membrane proteins in the latter. The incorporation of proteins into a lipid bilayer is known to produce a more viscous bilayer (14), which provides justification for the relative transport rate constants.
Interestingly and importantly, at the outer membrane, the transport rate constant is more than one order-of-magnitude larger than that for the liposome and two orders-of-magnitude larger than that for the E. coli inner membrane. It is also two orders-of-magnitude larger than that determined by Zimmermann and Rosselet (3) for the transport of negatively charged benzylpenicillin through the E. coli outer membrane (1.9 × 10⁻⁴ s−1). Unique to the E. coli outer membrane (in comparison to the cytoplasmic membrane or the liposome vesicle) is the presence of porin channels. While it has been reported that simple diffusion of hydrophobic molecules is less favored through the bacterial outer membrane compared to the inner membrane due to its tightly packed structure (15), transport through porin channels may accelerate translocation of the MG+ ions. Porin channels are known to enable hydrophilic solutes to transport with permeability inversely proportional to their hydrophobicity (13). Although the MG+ ion is hydrophobic, it is relatively small and, in contrast to the benzylpenicillin ion (3), it carries a positive charge. Classic porins reportedly show a preference for cations over anions presumably due to the presence of an interior-negative Donnan potential and a high concentration of negatively charged LPS molecules on the surface (16,17). Thus, permeation though the porin channels is a realistic scenario and the large transport rate constant that is determined for the MG+ ions across the outer E. coli membrane is justifiable. Considering the comparable size of benzylpenicillin and MG+, this comparison illustrates that the ionic nature of a molecule is deterministic for transport through a cell membrane that has ion transport channels.
Conclusion
In summary, we have demonstrated that the nonlinear optical phenomenon, second-harmonic generation, can be used to observe the adsorption and transport of molecules through living cell membranes in real-time. As a first demonstration, in the case of the E. coli, the adsorption onto and transport across the two membranes of a hydrophobic molecular cation with molecular mass of 329.4 Da are individually observed in sequence in time and the transport rate constant at each of the membranes has been determined. It is observed that the transport rate of this molecular ion through the outer membrane with ion channel porins is two orders-of-magnitude faster than the transport through the inner lipid bilayer membrane. This study demonstrates an experimental capability that can be broadly applied for studies to establish a fundamental and pharmacological understanding of the interactions of molecules with the membranes of living cells.
Acknowledgments
We thank Mark Goulian and Tim Miyashiro of the University of Pennsylvania, for providing E. coli MC4100 strain, and Luca D’Agostino of Temple University for assistance with culturing techniques.
This work is supported by National Science Foundation grant No. CHE-1058883.
Supporting Material
References
- 1.Clapham D.E., Runnels L.W., Strübing C. The TRP ion channel family. Nat. Rev. Neurosci. 2001;2:387–396. doi: 10.1038/35077544. [DOI] [PubMed] [Google Scholar]
- 2.Conner S.D., Schmid S.L. Regulated portals of entry into the cell. Nature. 2003;422:37–44. doi: 10.1038/nature01451. [DOI] [PubMed] [Google Scholar]
- 3.Zimmermann W., Rosselet A. Function of the outer membrane of Escherichia coli as a permeability barrier to β-lactam antibiotics. Antimicrob. Agents Chemother. 1977;12:368–372. doi: 10.1128/aac.12.3.368. [DOI] [PMC free article] [PubMed] [Google Scholar]
- 4.Hamill O.P., Marty A., Sigworth F.J. Improved patch-clamp techniques for high-resolution current recording from cells and cell-free membrane patches. Pflug. Arch.. Eur. J. Phys. 1981;391:85–100. doi: 10.1007/BF00656997. [DOI] [PubMed] [Google Scholar]
- 5.Eidelman O., Cabantchik Z.I. Continuous monitoring of transport by fluorescence on cells and vesicles. Biochim. Biophys. Acta. 1989;988:319–334. doi: 10.1016/0304-4157(89)90008-7. [DOI] [PubMed] [Google Scholar]
- 6.Wang H., Yan E.C.Y., Eisenthal K.B. Second harmonic generation from the surface of centrosymmetric particles in bulk solution. Chem. Phys. Lett. 1996;259:15–20. [Google Scholar]
- 7.Eckenrode H.M., Dai H.L. Nonlinear optical probe of biopolymer adsorption on colloidal particle surface: poly-L-lysine on polystyrene sulfate microspheres. Langmuir. 2004;20:9202–9209. doi: 10.1021/la048863j. [DOI] [PubMed] [Google Scholar]
- 8.Jen S.H., Gonella G., Dai H.L. The effect of particle size in second harmonic generation from the surface of spherical colloidal particles. I. Experimental observations. J. Phys. Chem. A. 2009;113:4758–4762. doi: 10.1021/jp9009959. [DOI] [PubMed] [Google Scholar]
- 9.Jen S.H., Dai H.L., Gonella G. The effect of particle size in second harmonic generation from the surface of spherical colloidal particles. II. The nonlinear Rayleigh-Gans-Debye model. J. Phys. Chem. C. 2010;114:4302–4308. [Google Scholar]
- 10.Srivastava A., Eisenthal K.B. Kinetics of molecular transport across a liposome bilayer. Chem. Phys. Lett. 1998;292:345–351. [Google Scholar]
- 11.Liu Y., Yan E.C.Y., Eisenthal K.B. Effects of bilayer surface charge density on molecular adsorption and transport across liposome bilayers. Biophys. J. 2001;80:1004–1012. doi: 10.1016/S0006-3495(01)76079-1. [DOI] [PMC free article] [PubMed] [Google Scholar]
- 12.Evans D.F., Wennerström H. 2nd Ed. Wiley-VCH; New York: 1999. The Colloidal Domain—Where Physics, Chemistry, Biology, and Technology Meet. [Google Scholar]
- 13.Nikaido H., Rosenberg E.Y. Effect on solute size on diffusion rates through the transmembrane pores of the outer membrane of Escherichia coli. J. Gen. Physiol. 1981;77:121–135. doi: 10.1085/jgp.77.2.121. [DOI] [PMC free article] [PubMed] [Google Scholar]
- 14.Gally H.U., Pluschke G., Seelig J. Structure of Escherichia coli membranes. Fatty acyl chain order parameters of inner and outer membranes and derived liposomes. Biochemistry. 1980;19:1638–1643. doi: 10.1021/bi00549a018. [DOI] [PubMed] [Google Scholar]
- 15.Vaara M., Plachy W.Z., Nikaido H. Partitioning of hydrophobic probes into lipopolysaccharide bilayers. Biochim. Biophys. Acta. 1990;1024:152–158. doi: 10.1016/0005-2736(90)90218-d. [DOI] [PubMed] [Google Scholar]
- 16.Benz R., Janko K., Läuger P. Ionic selectivity of pores formed by the matrix protein (porin) of Escherichia coli. Biochim. Biophys. Acta. 1979;551:238–247. doi: 10.1016/0005-2736(89)90002-3. [DOI] [PubMed] [Google Scholar]
- 17.Nikaido H. Outer membrane. In: Neidhardt F., editor. Escherichia coli and Salmonella—Cellular and Molecular Biology. ASM Press; Washington, DC: 1996. pp. 29–47. [Google Scholar]
Associated Data
This section collects any data citations, data availability statements, or supplementary materials included in this article.