

Abstract
Cells sense the rigidity of their substrate; however, little is known about the physical variables that determine their response to this rigidity. Here, we report traction stress measurements carried out using fibroblasts on polyacrylamide gels with Young’s moduli ranging from 6 to 110 kPa. We prepared the substrates by employing a modified method that involves N-acryloyl-6-aminocaproic acid (ACA). ACA allows for covalent binding between proteins and elastomers and thus introduces a more stable immobilization of collagen onto the substrate when compared to the conventional method of using sulfo-succinimidyl-6-(4-azido-2-nitrophenyl-amino) hexanoate (sulfo-SANPAH). Cells remove extracellular matrix proteins off the surface of gels coated using sulfo-SANPAH, which corresponds to lower values of traction stress and substrate deformation compared to gels coated using ACA. On soft ACA gels (Young’s modulus <20 kPa), cell-exerted substrate deformation remains constant, independent of the substrate Young’s modulus. In contrast, on stiff substrates (Young’s modulus >20 kPa), traction stress plateaus at a limiting value and the substrate deformation decreases with increasing substrate rigidity. Sustained substrate strain on soft substrates and sustained traction stress on stiff substrates suggest these may be factors governing cellular responses to substrate rigidity.
Introduction
Cells are known to sense and respond to the mechanical properties of their surrounding environment (1,2). For example, substrate rigidity is thought to play a role in the development and differentiation of tissues and cells, and may be implicated in disease and regeneration (1). It is now recognized that cells actively probe the mechanical attributes of their environment by applying forces at the sites of substrate adhesion (1). Traction force microscopy has been used to characterize cell-generated forces in response to substrate rigidity (1,3–9). Various cell behaviors such as migration (3), amoeboid development (4), morphological change (5), and focal adhesion formation (6,10,11) have been linked to cell-generated traction forces. Actin stress fibers (8,12,13), focal adhesions (11,14,15), or mechanosensitive ion channels (16) have been proposed to act as rigidity sensors and guide cellular responses. Despite this, specific details on the rigidity sensing mechanism have yet to be fully elucidated. How substrate rigidity is gauged by cells remains elusive.
Traction stress and substrate displacement may be key biophysical factors that control the mechanical behavior of cells. De et al. (17) theorized that cells may readjust their contractile activity and cytoskeleton to maintain either optimal strain or optimal stress. However, experiments addressing this issue have produced conflicting results, with some suggesting that cells maintain a constant traction stress (18), whereas others propose that cells sustain a constant substrate deformation (7,8,19).
Attempts have also been made, by employing computational models, to explain cell migration behavior on substrates with varying rigidities. These models typically assume that traction forces increase with an increase in substrate rigidity up to 100 kPa, beyond which they stay constant (20,21). However, these studies were based on limited data: previous traction force analyses on continuous substrates have been limited to substrates with Young’s moduli below 50 kPa (3,5,9). Therefore, we have performed traction force microscopy on continuous polyacrylamide (pAAm) substrates to address the issue of whether cells sense stress or strain. By varying the concentrations of monomer (acrylamide, AAm) and cross-linker (N,N′-methylenebisacrylamide, BIS), we prepared substrates with rigidities covering a wide range, from 6 to 110 kPa, which spans the entire range of physiologically relevant matrix rigidities from brain tissue (1 kPa) to bone (100 kPa) (22).
To improve the accuracy of the force measurements in our experiments, we have adopted a variation on a method that involves copolymerizing N-acryloyl-6-aminocaproic acid (ACA) with AAm and BIS to form the gel (23) (see Fig. S1 in the Supporting Material). This permits a more specific, covalent coupling of pAAm gels with extracellular matrix (ECM) proteins, as compared to an alternative method using sulfo-succinimidyl-6-(4-azido-2-nitrophenyl-amino) hexanoate (sulfo-SANPAH) (2,24). Using these ACA gels, we measured the two physical variables that may play important roles in the rigidity sensing mechanism of cells: traction stress and substrate strain. We observed that cells generated sustained substrate strain on soft substrates and sustained traction stress on stiff substrates. This suggests that depending on the substrate rigidity, either strain or stress could influence cell behavior. The switch from dependence on one factor to the other appears to occur at a substrate rigidity of 20 kPa. Given our observations depicting a weak correlation between traction stress and focal adhesion area, this switch, from sustained substrate strain to sustained substrate stress, is likely to be independent of mature focal adhesion size.
Materials and Methods
Preparation of pAAm gels
To activate glass coverslips for gel attachment, coverslips (25 mm diameter) were silanized by incubating in silane solution (2% acetic acid, (Schedelco, Singapore, Singapore) and 1.2% 3-methacryloxypropyltrimethoxysilane(Shin-Etsu Chemical, Tokyo, Japan)) for 2 h at room temperature. The coverslips were then washed with ethanol and air dried. pAAm gels were prepared with varying concentrations of AAm (Bio-Rad, Hercules, CA) and BIS (Bio-Rad) to vary rigidity. For the ACA-copolymerized gels, ACA (Tokyo Chemical Industry, Tokyo, Japan) solution (500 mM, pH 7) was added to the AAm-BIS mixture such that the final concentration of the ACA monomer was 100 mM. The relationship between AAm and BIS concentrations and Young’s modulus of gels is shown in Table 1.
Table 1.
Concentration of AAm and BIS and the corresponding Young’s modulus for ACA (100 mM ACA) and sulfo-SANPAH gels (0 mM ACA)
| AAm (%) | BIS (%) | Young’s modulus (kPa) |
|
|---|---|---|---|
| 100 mM ACA | 0 mM ACA | ||
| 3.0 | 0.13 | 6.2 | |
| 4.0 | 0.17 | 14.4 | 7.5 |
| 4.3 | 0.18 | 16.7 | |
| 4.6 | 0.20 | 19.4 | |
| 4.9 | 0.21 | 22.5 | 13.9 |
| 5.5 | 0.23 | 31.6 | 19.9 |
| 6.5 | 0.28 | 45.1 | |
| 7.5 | 0.32 | 60.7 | 50.4 |
| 10.0 | 0.43 | 110.5 | 91.8 |
| 10.5 | 0.45 | 121.7 | |
In addition, green fluorescent beads of 0.2 μm diameter (Polysciences, Warrington, PA) were added to the mixture to allow visualization of substrate deformation and calculation of traction stresses exerted by the cell. Polymerization was initiated with 0.2% ammonium persulfate (Bio-Rad) and catalyzed with 0.2% N,N,N′,N′-tetramethylethylenediamine (Bio-Rad). 4.52 μl of gel solution was placed onto the silanized coverslips and the drop was covered with a nontreated circular coverslip (12 mm diameter). After polymerization, the top coverslip was carefully removed and gels were fully hydrated in MES buffer (0.1 M 2-(N-morpholino)ethanesulfonic acid, 0.5 M sodium chloride, pH 6.1(Sigma-Aldrich, St. Louis, MO)) for ACA pAAm gels and in HEPES buffer (50 mM HEPES, pH 8.5 (Sigma-Aldrich)) for sulfo-SANPAH pAAm gels. Fully hydrated gels were ∼50 μm thick.
To immobilize collagen on the pAAm gel surface with sulfo-SANPAH, 0.5 mg/ml sulfo-SANPAH (Pierce, Rockford, IL) in HEPES buffer was placed onto the surface of each gel and exposed to ultraviolet (UV) light (90 W lamp (wavelength 312 and 365 nm) at a distance of 2 inches for 3 min or UV light in a sterile hood for 15 min). The darkened sulfo-SANPAH solution was removed and gels were rinsed twice with HEPES for 10 min and incubated in 0.2 mg/ml type I collagen (Koken, Tokyo, Japan) at 4°C overnight.
To conjugate collagen on the ACA gel surface, a dehydration condensation reaction was performed using water soluble carbodiimide. First, carboxyl groups of the ACA gels were activated with 0.2 M 1-ethyl-3-(3-dimethylaminopropyl) carbodiimide hydrochloride (EDAC, Dojindo Laboratories, Kumamoto, Japan) and 0.5 M N-hydroxysuccinimide (NHS, Wako Pure Chemical Industries, Osaka, Japan) in MES buffer for 30 min at room temperature. Gels were then washed with cold 60% methanol diluted with phosphate buffered saline (PBS, 1st Base, Singapore, Singapore), before being reacted with 0.2 mg/ml type I collagen in HEPES buffer (0.5 M HEPES, pH 9.0) overnight at 4°C. Finally, gels were transferred to 0.5 M ethanolamine (Sigma-Aldrich) diluted by HEPES buffer for 30 min at 4°C. The gels were washed once with HEPES buffer at 4°C and then washed three times with PBS.
All gels were exposed to UV light in a sterile hood for 15 min. Before plating cells, gels were equilibrated in cell culture medium for 30–45 min at 37°C.
Measuring pAAm gel rigidity
Gel rigidity was determined by the penetration method (25). The Young’s modulus (E) was obtained using the Hertz sphere model,
| (1) |
where b = [9/(16 ER1/2)]2/3, and assuming a value of 1/2 for the Poisson ratio. The indentation profiles were obtained from fully hydrated 2 to 3 mm gel samples with a stainless steel sphere (3 mm radius (R)) (Fig. S2). To measure the force exerted on gels (f), individual gels were placed on a custom-designed electronic balance (Shimadzu, Kyoto, Japan), and indentation of the sphere (h) was monitored using a z-axis stage (Chuo Precision Industrial, Tokyo, Japan). The Hertz model was then applied to fit the first linear section in the plot f2/3 against indentation depth to ensure that the estimation was consistent with the linear approximation as illustrated in Fig. S2.
Cell culture
Mouse embryonic fibroblasts (MEFs) and National Institutes of Health 3T3 (NIH3T3) cells were cultured in Dulbecco’s modified Eagle’s medium (Nissui, Tokyo, Japan) supplemented with 10% fetal bovine serum (GIBCO, Grand Island, NY) and 1% penicillin-streptomycin (GIBCO) at 37°C, 5% CO2, and 100% humidity.
Retroviral expression vectors and infection
To construct the retroviral expression vector for C-terminally mCherry-tagged paxillin, the retroviral expression vector, mCherry-pBabe-blasticidin was first constructed by the polymerase chain reaction (PCR). The coding region of human paxillin was then inserted into this using PCR. To construct the retroviral expression vector for N-terminally mCherry-tagged zyxin, the coding regions of mCherry and human zyxin were inserted in tandem to pcDNA3 and the coding sequence for mCherry-zyxin was transferred to the retroviral expression vector pBabe-hygromycin. All PCR-based constructions were subject to DNA sequence confirmation.
Retroviral infection was performed as previously described (26). Infected cells were selected with 300 μg/ml hygromycin B, or 5 μg/ml blasticidin for 2–3 days, depending upon the vectors used.
Visualization of collagen attached to pAAm gels
Cell-secreted collagen and collagen attached to the gels was visualized by indirect immunofluorescence in contrast to F-actin and nucleus staining (27). 12 h after cell plating, the culture surface and cells were subjected to 3 min of fixation/permeabilization with PBS containing 0.5% Triton X-100 and 4% formaldehyde followed by 20 min of further fixation with PBS containing 4% formaldehyde and 5% sucrose. Fixed samples were blocked using Blocking One (Nacalai Tesque, Kyoto, Japan), before being incubated with rabbit anticollagen type I antibody (Cedarlane, Ontario, Canada) for 1 h, washed with PBS, and then incubated with a mixture of Alexa Fluor 555 conjugated antirabbit IgG antibody (Molecular Probes, Eugene, OR), Alexa Fluor 488 conjugated phalloidin (Invitrogen, Carlsbad, CA) and 4′,6-diamidino-2-phenylindole (DAPI) (Sigma-Aldrich) for 1 h. After washing with Tris-buffered saline (137 mM sodium chloride, 2.68 mM potassium chloride, 25 mM Tris, pH 7.4), samples were mounted in ProLong Gold anti-fade reagent (Invitrogen) to minimize photobleaching. Images were obtained using a Nikon A1 confocal microscope with a 40× air objective lens (NA 0.95).
Live cell imaging and detection of fluorescent beads embedded in pAAm gels
Cells on pAAm gels and beads embedded in pAAm gels were viewed 12 h after cell plating. Images were obtained with the Perkin Elmer Ultraview spinning disk microscope using a 60× water objective lens (NA 1.2) and a stage incubator. For each data set a number of images were obtained. Specifically, a differential interference contrast image indicating cell position; an image of the green fluorescent beads (excitation 488 nm, emission 516 nm) embedded in the pAAm substrate; and an image of the mCherry-tagged focal adhesion proteins (excitation 561 nm, emission 640 nm). Cells were subsequently detached from the substrate using trypsin and another image of the green fluorescent beads was obtained to determine bead position in the unstrained substrate.
Determination of focal adhesion area
mCherry-tagged zyxin and paxillin expressed in NIH3T3 cells and MEFs, respectively, were used as focal adhesion markers. Focal adhesion area was defined as the region with fluorescence intensity higher than the threshold determined in each individual cell. A relative intensity was defined as
| (2) |
where i represents the measured intensity, imax the maximum intensity, and imin the minimum intensity within the cell. The relative intensity of 0.25 was used to threshold the fluorescence images in Perkin Elmer’s Volocity to quantify the area of individual focal adhesions.
Calculation of traction stress magnitudes
Two-dimensional traction force microscopy has become a common technique and its experimental procedures have been well documented (6,9,28–30). Cell-induced substrate deformations can be identified by comparing images of the fluorescent beads embedded in the substrate before and after the cell is detached by trypsinization.
The images acquired before and after cell detachment were further divided into a set of subareas. Using each pair of corresponding subarea images, the respective local displacement vector was obtained by maximizing the cross-correlation function of the subareas. The cross-correlation function was obtained efficiently using the fast Fourier transform algorithm and the displacement vector was estimated from the location of the cross-correlation peak (31,32). The mean displacement at cell-free regions, where the cell was at least 5 μm away, was subtracted from the calculated displacements, to correct for sample drift during image acquisition. The resultant displacement matrix approximates the local substrate deformation for each subarea that best fit the strained image to the unstrained image.
Once the entire displacement field u was calculated, the traction stress field F was obtained as the solution to the inverse Boussinesq problem (25,33). We have assumed that the substrate is an infinite half-plane and response of the substrate is linear. Displacements from the various traction points can then be superimposed. The Boussinesq equations relate the displacement (ux,uy) at location (x,y) on the surface of the substrate to an imposed point stress (Fx,Fy) at location (x′,y′),
| (3a) |
| (3b) |
where r2 = ((x-x′)2 + (y-y′)2), ν is the Poisson ratio and E the Young’s modulus of the gel. A matrix equation comprising Eq. 3 at all locations was then formed and inverted. To prevent the matrix from being singular, due to presence of the 1/r and 1/r3 terms, the grid (x,y) of the displacement field was staggered in both x and y directions from the grid (x′,y′) of the stress field by a small percentage (7.5%) of the grid spacing.
Results
Cells remove collagen off sulfo-SANPAH gels but not ACA gels
Previous studies wherein ECM proteins were nonspecifically adsorbed onto glass surfaces reported a removal of these proteins from areas of cell-substrate contact (34,35). To examine whether cells were also able to remove collagen immobilized onto pAAm gels with sulfo-SANPAH, we conducted anticollagen immunofluorescence staining and analyzed both cell-secreted and substrate-bound collagen matrixes 12 h after cell plating. This time point was chosen to allow comparison with other traction force studies, which are usually conducted 12 h after cell plating. We found regions on the surface of stiff sulfo-SANPAH gels (Young’s moduli >20 kPa) where collagen was absent, suggesting the collagen matrix underneath the cells was removed within 12 h of cell plating (see Fig. 1 B and Fig. S5 B). On the other hand, no such region was observed on ACA gels regardless of substrate rigidity. This suggests that cells were unable to remove collagen within 12 h irrespective of substrate rigidity (Fig. 1 A and Fig. S5 A).
Figure 1.
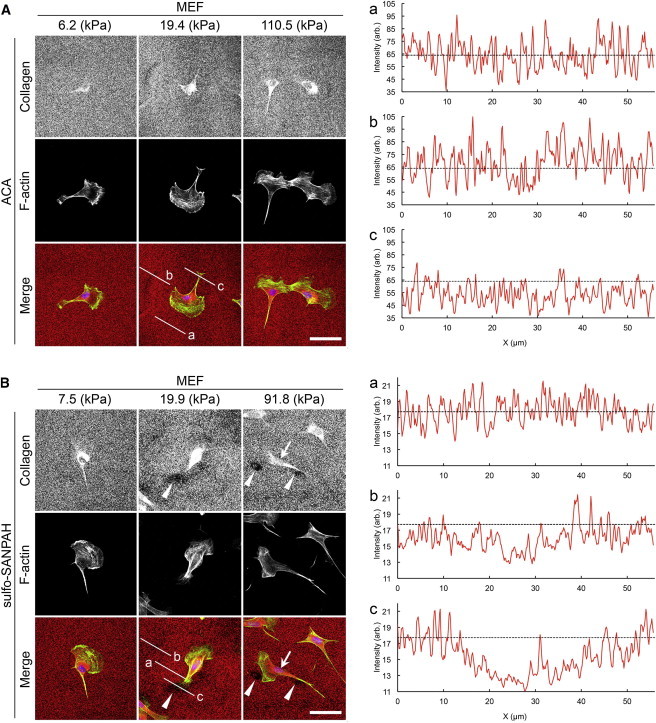
Immunofluorescence staining of collagen attached to the ACA and sulfo-SANPAH gels on which MEFs were plated. Staining was conducted 12 h after cell plating. (A) ACA pAAm gels and (B) sulfo-SANPAH pAAm gels with indicated elasticities. Graphs (a), (b), and (c) show the fluorescence intensity profiles of anticollagen immunostaining along the lines a, b, and c in the corresponding merged images, respectively. Dashed lines in the graphs denote the average intensity value along the line a. Note the difference in the staining intensity between ACA (A) and sulfo-SANPAH (B) gels. Arrowheads point to the areas devoid of collagen. Arrow points to intense anticollagen staining that is observed independently of collagen coating of gels. Scale bars represent 50 μm.
Traction stress magnitudes are higher on ACA gels as compared to sulfo-SANPAH gels
Traction force microscopy was used to measure traction stress magnitudes exerted by cells on ACA and sulfo-SANPAH gels. Fig. 2 shows the results from traction force microscopy of MEFs on a soft ACA gel (Young’s modulus 6.2 kPa, panels A–D) and on a stiff ACA gel (Young’s modulus 60.7 kPa, panels E–H). The traction stress magnitudes averaged over the whole cell on the soft and on the stiff substrates were 0.099 ± 0.0035 kPa and 0.53 ± 0.011 kPa (mean ± SE), respectively, whereas the maximum traction stress magnitudes were 1.14 kPa and 3.86 kPa, respectively. Both our mean and maximum traction stress magnitudes support previous traction force studies using fibroblasts (3,6,10,31,36).
Figure 2.
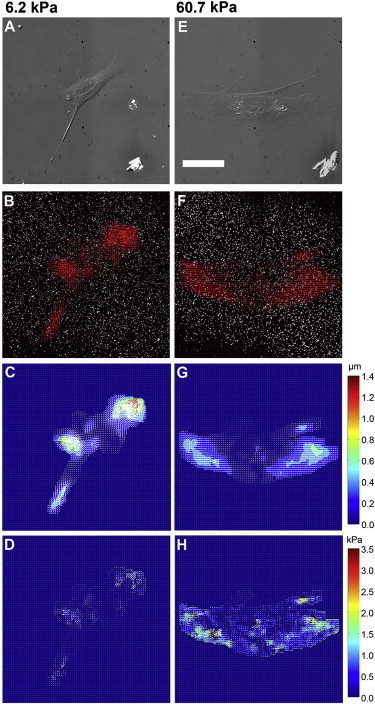
Traction force microscopy. Differential interference contrast images of MEFs on ACA gels with Young’s modulus of (A) 6.2 kPa and (E) 60.7 kPa. Threshold images of beads with arrows showing bead displacements due to the traction exerted by a cell on the substrate of Young’s modulus (B) 6.2 kPa and (F) 60.7 kPa. Displacement maps obtained from digital image correlation, for Young’s modulus of (C) 6.2 kPa and (G) 60.7 kPa. Color bar is in units of micrometers. Traction stress maps for Young’s modulus of (D) 6.2 kPa and (H) 60.7 kPa. Color bar is in units of kPa. The traction stress magnitude averaged over the whole cell is 0.099 ± 0.0035 kPa in (D) and 0.53 ± 0.011 kPa in (H). Scale bar represents 50 μm.
We then compared the magnitudes of substrate deformations and traction stresses generated by cells on ACA and sulfo-SANPAH gels. The mean bead displacement (Fig. 3 A) and calculated mean traction stresses (Fig. 3 B) were larger on ACA gels, particularly with rigidity higher than 20 kPa. The maximum value of the mean traction stress of fibroblasts on ACA gels was ∼0.40 kPa, whereas on sulfo-SANPAH gels it was lower at 0.33 kPa (Fig. 3 B). Similarly, the mean deformation of ACA gels by fibroblasts decreased from 0.38 to 0.073 μm as substrate rigidity was increased from 6.2 to 110.5 kPa, whereas the mean deformations of sulfo-SANPAH gels decreased from 0.31 to 0.032 μm as substrate rigidity was increased from 7.5 to 121.7 kPa (Fig. 3 A).
Figure 3.

Cell-generated substrate deformation and traction stress. Graphs of (A) mean bead displacement magnitude versus substrate elasticity, and (B) mean traction stress magnitude versus substrate elasticity. Results are for collagen grafted on ACA-copolymerized pAAm gels (solid circles) and collagen immobilized on pAAm gels using sulfo-SANPAH (open squares). Error bars represent SE of the mean. For each substrate rigidity value, 10–20 cells were analyzed.
Substrate deformation is sustained on soft ACA gels, whereas traction stress is constant on stiff ACA gels
We found that for ACA gels with Young’s modulus below 20 kPa, the mean bead displacement was sustained at ∼0.34 μm for NIH3T3 cells and 0.38 μm for MEFs (Fig. 3 A). Correspondingly, traction stress increased with substrate rigidity up to 20 kPa. The mean traction stress exerted by NIH3T3 cells and MEFs increased from 0.19 to 0.38 kPa, and 0.20 to 0.35 kPa, respectively, as substrate rigidity was increased from 6.2 to 19.4 kPa (Fig. 3 B).
In contrast, at substrate rigidities above 20 kPa, traction stress did not show a marked increase, suggesting that there is a maximal force with which cells can pull on the substrate. The mean traction stresses leveled off at ∼0.38 kPa for NIH3T3 cells and MEFs. Conforming to this trend, the mean bead displacement decreased with increasing rigidity beyond 20 kPa.
The mean bead displacement seemed to be maintained at a constant value of ∼0.31 μm for NIH3T3 cells and MEFs on sulfo-SANPAH gels with Young’s modulus below 14 kPa (Fig. 3 A). Correspondingly, the mean traction stress increased with substrate rigidity. However, at rigidities above 14 kPa, whereas the mean bead displacement decreased with increasing substrate rigidity, the mean traction stresses exerted by both NIH3T3 cells and MEFs appeared to be still increasing and traction stresses leveled off only on substrates of rigidity 50 kPa or stiffer (Fig. 3 B).
Focal adhesion areas increase with increasing substrate rigidity
We then analyzed the size of focal adhesions, which has been reported to be modulated by externally applied forces (11,37). We performed live cell imaging of NIH3T3 cells and MEFs expressing mCherry-tagged zyxin and paxillin, respectively. The mCherry-tagged proteins revealed more elongated focal adhesion assemblies in cells on stiff (60.7 kPa) substrates (Fig. 4 A) compared to cells on soft (6.2 kPa) substrates (Fig. 4 B). We found that on ACA gels, as the Young’s modulus increased from 6.2 to 60.7 kPa, the mean area of focal adhesions also increased from ∼0.81 to 1.2 μm2. This was observed in both NIH3T3 cells and MEFs. At larger substrate rigidities however, the focal adhesion area did not increase further (Fig. 4 C).
Figure 4.
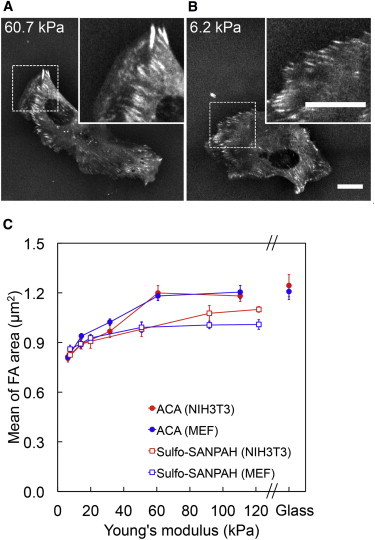
Relationship between focal adhesion area and substrate rigidity. MEFs stably expressing mCherry-tagged paxillin on ACA gels with Young’s modulus of (A) 60.7 kPa and (B) 6.2 kPa, both with 0.2 mg/ml of collagen coating. Scale bar represents 20 μm. (C) Graph of mean focal adhesion area versus substrate elasticity: mCherry-tagged zyxin in NIH3T3 cells (ACA: solid circles, sulfo-SANPAH: open squares). Error bars represent SE of the mean. For each substrate rigidity value, 10–20 cells were analyzed.
The mean focal adhesion areas for cells plated onto sulfo-SANPAH gels with rigidities above 20 kPa were significantly smaller when compared to those of cells plated onto ACA gels (Fig. 4 C).
We found that on sulfo-SANPAH gels, the mean focal adhesion area for NIH3T3 cells and MEFs, increased from ∼0.82 to 1.1 μm2 and 0.86 to 1.0 μm2, respectively, as substrate rigidity increased from 6.2 to 91.8 kPa. Above 91.8 kPa, the mean focal adhesion area did not increase further (Fig. 4 C).
Focal adhesion area is not correlated with the magnitude of traction stress
We found that both the mean traction stress magnitude and the mean focal adhesion area increased with increasing substrate rigidity but in distinct fashions (compare Fig. 3 B and Fig. 4 C). Although the mean traction stress magnitude did not increase with the substrate rigidity on ACA gels stiffer than 20 kPa (Fig. 3 B), the mean focal adhesion area continued to increase with substrate rigidity up to 60 kPa (Fig. 4 C). These results suggest that traction stress may not be directly correlated with the size of focal adhesion areas.
To address this, we performed linear regression analysis between the mean focal adhesion area and the mean traction stress for each individual cell. When linear regression was applied individually for each substrate rigidity, low R2 values (0.001 to 0.26) were obtained, suggesting little or no linear correlation (Fig. 5). Nonetheless, when data from all rigidities were analyzed together, there were weak but positive linear correlations between the focal adhesion area and the stress magnitude (R2 values were 0.38 for NIH3T3 cells and 0.22 for MEFs) (Fig. 5).
Figure 5.
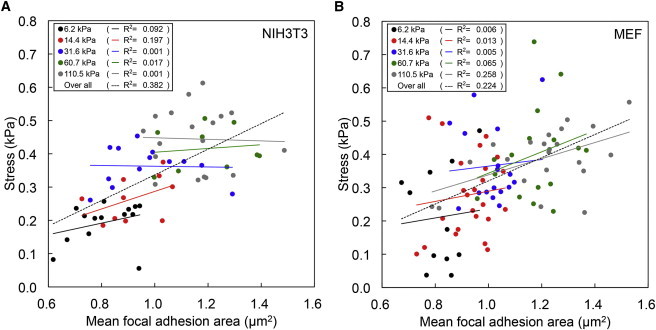
Relationship between focal adhesion area and traction stress magnitude. Scatter plot of mean traction stress versus mean focal adhesion area for (A) NIH3T3 cells and (B) MEFs. Each point plots the mean traction stress value versus mean focal adhesion area value of a particular cell on ACA gels with Young’s modulus of 6.2 kPa, 14.4 kPa, 31.6 kPa, 60.7 kPa, and 110.5 kPa. Lines of the corresponding color represent the linear fits to these points. The dashed lines represent the overall linear fitting of mean traction stress to mean focal adhesion area for all cells.
Discussion
It has previously been reported that cells sense and respond to mechanical properties of the ECM. However, the mechanisms underlying how cells sense the ECM rigidity are still poorly understood. In particular, there is no clear consensus as to whether cells sense the strain or the stress of their immediate environment. Freyman et al. (18) have proposed that fibroblasts are force limited and generate a constant contractile force regardless of the surrounding matrix rigidity. To the contrary, experiments using micropillars showed that Madin-Darby canine kidney epithelial cells and fibroblasts maintained constant deformations on those substrates to which these cells adhered (7,8,19,38). Oakes et al. (5) have also reported that human neutrophils exerted constant deformations on pAAm substrates. Our results however suggest that depending on the substrate rigidity, either substrate strain or substrate stress tends to be conserved.
Using the ACA gels we observed that fibroblasts exert traction stresses on substrates softer than 20 kPa to maintain constant strains. At rigidities beyond 20 kPa, stress appears to be limiting as traction stress reaches a plateau (Fig. 3). Similarly, in another study on fibroblasts that used micropillar arrays, Ghibaudo et al. (7) reported two distinct regimes in the traction force-pillar stiffness relationship. A linear increase in both traction force and pillar stiffness was observed at corresponding Young’s moduli below 100 kPa, whereas at higher Young’s moduli, traction forces plateaued. In our study, we employed continuous substrates to reach similar conclusions, although we observed that traction stresses leveled out at a much lower rigidity (20 kPa). This difference could be due to confounding effects of micropillar size, location, and density, which may affect focal adhesion areas. In experiments using pAAm gels these limitations do not exist. This notion is supported by reports that total traction forces and focal adhesion areas for cells on micropillars can be increased by increasing micropillar density (39). In addition, micropillars have a different substrate topology that may also modify cell responses in terms of focal adhesion kinase activity and cell contractility (40,41). Therefore, traction stress measurements using micropillars may not be directly comparable to measurements using continuous substrates.
Discher et al. (1) have proposed that cells respond to substrate rigidity by producing constant substrate strain. Cell traction stresses are expected to increase with increasing substrate rigidity if the cells are to sense their external environments by responding to substrate strains. However, the cellular response of maintaining constant strain, which we observed on substrates having Young’s moduli below 20 kPa, does not explain the observation that traction stress appears to be independent of the substrate rigidity for substrates with Young’s moduli above 20 kPa.
A substrate rigidity value of 20 kPa seems to be important in regulating the fibroblast mechanoresponse because it is around this value that a switch from conservation of strain to conservation of stress appears to occur (Fig. 3). Interestingly, Solon et al. (42) have reported that fibroblasts tend to match their internal stiffness to that of their substrates up to 20 kPa. They have also found that actin remodeling in cells is enhanced with increasing substrate rigidity, suggesting that actin stress fibers may play a role in rigidity sensing. Consistent with this notion, Trichet et al. (8) have shown that more actin stress fibers align along the long axis of the cell when substrate rigidity is increased, and proposed that stress fibers may act as force sensors that transmit tension to focal adhesion complexes. Because traction forces are likely to be transmitted from myosin motors to the substrate through actin stress fibers, it seems probable that at substrate rigidity below 20 kPa, fibroblasts reorganize their actin cytoskeleton to sustain substrate strains, with maximum stress fiber alignment occurring at 20 kPa. Stress fiber formation and alignment depends upon the contractile activity of the actomyosin units, which transmit tension to focal adhesions through these fibers (12,13). The leveling off of traction force at substrate rigidities above 20 kPa might be a consequence of an inherent limit to the quantity of contraction that these actomyosin units can generate. Marcq et al. (43) have explained that contractile molecular motor activity plays a central role in reproducing the increase in traction force with increasing substrate rigidity for low rigidity values and the leveling off of traction force at larger rigidity values. Using microplates of variable stiffness, Mitrossilis et al. (44) also found that cell-generated forces, which can be suppressed by the myosin II inhibitor blebbistatin, increase with increasing microplate stiffness until a maximum force point is reached.
Relevant to these observations, Zemel et al. (13) have shown experimentally and theoretically that stress fiber organization is regulated by matrix rigidity and cell shape, with maximum stress fiber alignment occurring along the long axis of the cell when cellular and matrix rigidity values are related by an optimal ratio. Considering that fibroblasts originate from connective tissues that are ∼8 to 17 kPa in rigidity (22), the switch from conservation of strain to conservation of stress in fibroblasts, which we observe at a substrate rigidity of 20 kPa (Fig. 3), may correspond to this maximal stress fiber formation and alignment along the length of the cell. Therefore, the threshold of substrate rigidity, 20 kPa, seems to be born out of the interplay of inherent mechanoresponsive processes that the fibroblasts are commonly expected to face. It is likely that the substrate rigidity-gated switch between the sustained substrate strain and the sustained substrate stress results from the coordination of the machineries for stress fiber formation and alignment, and actomyosin contraction.
Previous reports have shown that focal adhesion areas increase with increasing substrate rigidity (2,3,9,10,45). Balaban et al. (11) have found that adhesion areas are linearly dependent on local traction forces exerted by the cells, and have proposed that traction force is closely related to focal adhesion assembly. Nicolas and Safran (14) and Nicolas et al. (15) have also reported that focal adhesion areas reach a finite size that can be altered by changing substrate rigidity. These observations suggest that the rigidity sensor could be located within the focal adhesion complexes.
By contrast, we found that although cells responded to increasing substrate rigidity by increasing the focal adhesion area and traction stress magnitude (Fig. 3 B and Fig. 4 C), the mean focal adhesion area was poorly correlated with mean traction stress magnitude (Fig. 5). These results are in agreement with observations by Stricker et al. (6), which indicate that focal adhesion area and traction stress magnitude are strongly correlated only during the initial phases of myosin-mediated adhesion maturation and growth. Upon maturation of focal adhesions, their sizes stabilize and no longer correlate with traction stress magnitude. Beningo et al. (46) have also shown that small focal adhesions at the cell’s leading edge transmit strong propulsive forces, whereas large mature focal adhesions exert weaker tractions on the substrate. Consistent with these findings, Trichet et al. (8) have reported that focal adhesions of a similar area can sustain a wide range of force.
Although focal adhesion areas have been shown to be poorly correlated to traction stress magnitude, focal adhesion proteins could still be important in transmitting traction stresses to the substrate. Gardel et al. (47) have found that traction stresses at focal adhesions correlate biphasically with the speed of actin retrograde flow. They have proposed that focal adhesions at the cell front function as a molecular clutch to slow down the actin retrograde flow and that further polymerization of actin can contribute to the cell protrusion, resulting in large traction stresses on the substrates. On the other hand, at a very low actin flow rate, the linkages between F-actin and focal adhesions are disrupted, resulting in small traction stresses on the substrate.
In addition to such actin reorganization, ion channels located at or near focal adhesions may also play a role in mechanosensing. Kobayashi and Sokabe (16) have demonstrated that different mechanosensitive ion channels located in the vicinity of focal adhesions form molecular complexes with both stress fibers and focal adhesions to control the level of cytoplasmic Ca2+, which subsequently induces actomyosin contraction or facilitates further cell signaling events.
To the best of our knowledge, the results shown here are the first to describe traction stress measurements on continuous substrates with rigidity above 50 kPa. Most studies either explored only a small range of rigidities with Young’s moduli below 10 kPa (9), or only compared traction stresses between two rigidity values (e.g., 14 and 30 kPa) (3). Moreover, most of these studies employed substrates coated with ECM proteins using sulfo-SANPAH and where the leveling out of traction stress magnitudes on stiff substrates was not demonstrated. Although we observed a switch from sustained constant substrate strain at low rigidities to sustained constant traction stress at high rigidities with the ACA gels, we did not note a similar trend using the sulfo-SANPAH gels. The mean bead displacements were maintained at a constant value on sulfo-SANPAH gels of Young’s moduli below 14 kPa (Fig. 3 A), and we did not observe the leveling out of traction stress on substrates that were softer than 50 kPa (Fig. 3 B). We speculate that using sulfo-SANPAH to immobilize ECM proteins onto the substrate had limitations that might have hindered traction stress studies at higher rigidities.
Although the sulfosuccinimidyl groups located at one end of sulfo-SANPAH molecules react with primary amines on ECM proteins (collagen in this study), the other end nonspecifically binds to pAAm upon UV photoactivation (Fig. S1). The reaction between the sulfo-SANPAH and pAAm network, which is mediated by UV-induced nitrene, has neither been specified nor defined, although it is speculated to involve a broad array of chemical bonds centered around the azide group of sulfo-SANPAH. Due to the lack of specificity of this reaction, immobilization of ECM proteins onto the gel surface may remain unstable (24). Our results imply that such undefined binding of ECM proteins to sulfo-SANPAH-treated gels can be problematic, particularly when cells exert large traction forces on stiff substrates. The removal of collagen observed 12 h after cells were plated onto sulfo-SANPAH substrates (Fig. 1 B and Fig. S5 B) is unlikely to be due to matrix metalloproteinase (MMP) activity, as no significant difference in MMP activity was detected between different substrate rigidities (Fig. S4). Instead, this suggests that protein immobilization using sulfo-SANPAH is unstable and that previous traction stress studies using sulfo-SANPAH gels may somewhat misrepresent rigidity-dependent cell behavior and also include the effects of ECM protein remodeling.
To overcome the problems posed by the removal of ECM proteins from substrates, we have developed a method of preparing pAAm gels stably cross-linked to ECM proteins, originally described by Pless et al. (23), and used by various groups in recent years (9,48–53). To achieve this we have modified the original method, which requires synthesis of NHS-ACA ester in the laboratory, and instead used commercially available ACA. We have shown that cells do not appear to remove collagen that is immobilized using the ACA protocol (Fig. 1 A and Fig. S5 A). We have also quantified the amount of collagen immobilized on sulfo-SANPAH and ACA gels and note that these values appear to be independent of substrate rigidity (Fig. S3). The intensity of anticollagen immunostaining was higher on ACA gels as compared to that on sulfo-SANPAH gels, suggesting that collagen immobilization is more efficient when using the ACA-based procedure than the sulfo-SANPAH-based procedure. We speculate that the differences observed between the ACA and sulfo-SANPAH gels are due to both the amount of immobilized collagen as well as the unstable nature of collagen immobilization on sulfo-SANPAH gels.
The issue of unstable collagen immobilization appears to be more apparent on stiff substrates as significant differences in traction and focal adhesion areas are only observed on substrate rigidities above 20 kPa (Fig. 3 and Fig. 4 C). This may therefore suggest that the threshold in substrate rigidity that leads to ECM protein removal lies in the range around 20 kPa. Such a threshold is difficult to define, however, due to the unspecified and undefined nature of the chemistry by which sulfo-SANPAH binds to pAAm (Fig. S1). The use of ACA gels provides us with more reliable measurements of substrate deformation and traction stresses with minimum influences from ECM remodeling, especially on stiffer substrates. Consequently, this allowed us to accurately analyze substrate rigidity-dependent behavior of cells.
In conclusion, sustained substrate strain on soft substrates and sustained traction stress on stiff substrates suggests that depending on the substrate rigidity, either the strain or the stress might critically influence the behavior of fibroblasts. We propose that on substrates softer than 20 kPa, strain-sensing machinery of cells is active and governs cellular functions to maintain constant substrate deformations. Considering that traction forces are likely to be transmitted along actin filaments, a global response such as F-actin reorganization may be the factor responsible for conserving strain on soft substrates (Fig. 3 A). In contrast, on substrates stiffer than 20 kPa, fibroblast behavior switches to be governed by stresses defined by the force-generating machinery within cells. Limitations in the force-generating capacity of the cell’s actomyosin units may be responsible for the plateau of cell-generated traction stress on stiff substrates (Fig. 3 B). We speculate that the threshold value of substrate rigidity, where the switch between sustaining constant substrate deformation to sustaining constant traction stress occurs (20 kPa), is determined by the coordination of strain-sensing and force-generating machineries. This threshold value may be relevant to the physical properties of fibrous tissues. In addition, we found focal adhesion areas to be weakly correlated to traction stresses, suggesting that local responses to substrate rigidity may not involve the focal adhesion in its entirety. However, individual focal adhesion proteins or associated ion channels may contribute to the cellular response to substrate rigidity. We propose that rigidity sensing machineries are distinct from the mechanisms primarily regulating maturation of the focal adhesion. Although detailed processes of cellular responses to substrate rigidity remain to be elucidated by future studies, the findings and tools presented here can provide valuable clues to deciphering the complex regulatory mechanisms behind cellular mechanosensing.
Acknowledgments
We thank Benoit Ladoux, Paul Matsudaira, and Michael Sheetz for insightful discussions, and Steven Wolf for helping with manuscript preparation.
This work was supported by the Seed Fund of the Mechanobiology Institute, Research Centre of Excellence financed by the National Research Foundation of Singapore (http://www.nrf.gov.sg/nrf/otherProgrammes.aspx?id=144) and the Singapore Ministry of Education (http://www.science.nus.edu.sg/research/pi/arf.html).
Contributor Information
Keng-Hwee Chiam, Email: chiamkh@ihpc.a-star.edu.sg.
Yasuhiro Sawada, Email: dbssy@nus.edu.sg.
Supporting Material
References
- 1.Discher D.E., Janmey P., Wang Y.-L. Tissue cells feel and respond to the stiffness of their substrate. Science. 2005;310:1139–1143. doi: 10.1126/science.1116995. [DOI] [PubMed] [Google Scholar]
- 2.Pelham R.J., Jr., Wang Y.-L. Cell locomotion and focal adhesions are regulated by substrate flexibility. Proc. Natl. Acad. Sci. USA. 1997;94:13661–13665. doi: 10.1073/pnas.94.25.13661. [DOI] [PMC free article] [PubMed] [Google Scholar]
- 3.Lo C.M., Wang H.B., Wang Y.L. Cell movement is guided by the rigidity of the substrate. Biophys. J. 2000;79:144–152. doi: 10.1016/S0006-3495(00)76279-5. [DOI] [PMC free article] [PubMed] [Google Scholar]
- 4.Delanoë-Ayari H., Iwaya S., Rieu J.P. Changes in the magnitude and distribution of forces at different Dictyostelium developmental stages. Cell Motil. Cytoskeleton. 2008;65:314–331. doi: 10.1002/cm.20262. [DOI] [PubMed] [Google Scholar]
- 5.Oakes P.W., Patel D.C., Tang J.X. Neutrophil morphology and migration are affected by substrate elasticity. Blood. 2009;114:1387–1395. doi: 10.1182/blood-2008-11-191445. [DOI] [PMC free article] [PubMed] [Google Scholar]
- 6.Stricker J., Aratyn-Schaus Y., Gardel M.L. Spatiotemporal constraints on the force-dependent growth of focal adhesions. Biophys. J. 2011;100:2883–2893. doi: 10.1016/j.bpj.2011.05.023. [DOI] [PMC free article] [PubMed] [Google Scholar]
- 7.Ghibaudo M., Saez A., Ladoux B. Traction forces and rigidity sensing regulate cell functions. Soft Matter. 2008;4:1836–1843. [Google Scholar]
- 8.Trichet L., Le Digabel J., Ladoux B. Evidence of a large-scale mechanosensing mechanism for cellular adaptation to substrate stiffness. Proc. Natl. Acad. Sci. USA. 2012;109:6933–6938. doi: 10.1073/pnas.1117810109. [DOI] [PMC free article] [PubMed] [Google Scholar]
- 9.Califano J.P., Reinhart-King C.A. Substrate stiffness and cell area predict cellular traction stresses in single cells and cells in contact. Cell Mol. Bioeng. 2010;3:68–75. doi: 10.1007/s12195-010-0102-6. [DOI] [PMC free article] [PubMed] [Google Scholar]
- 10.Prager-Khoutorsky M., Lichtenstein A., Bershadsky A.D. Fibroblast polarization is a matrix-rigidity-dependent process controlled by focal adhesion mechanosensing. Nat. Cell Biol. 2011;13:1457–1465. doi: 10.1038/ncb2370. [DOI] [PubMed] [Google Scholar]
- 11.Balaban N.Q., Schwarz U.S., Geiger B. Force and focal adhesion assembly: a close relationship studied using elastic micropatterned substrates. Nat. Cell Biol. 2001;3:466–472. doi: 10.1038/35074532. [DOI] [PubMed] [Google Scholar]
- 12.Walcott S., Sun S.X. A mechanical model of actin stress fiber formation and substrate elasticity sensing in adherent cells. Proc. Natl. Acad. Sci. USA. 2010;107:7757–7762. doi: 10.1073/pnas.0912739107. [DOI] [PMC free article] [PubMed] [Google Scholar]
- 13.Zemel A., Rehfeldt F., Safran S.A. Optimal matrix rigidity for stress fiber polarization in stem cells. Nat. Phys. 2010;6:468–473. doi: 10.1038/nphys1613. [DOI] [PMC free article] [PubMed] [Google Scholar]
- 14.Nicolas A., Safran S.A. Limitation of cell adhesion by the elasticity of the extracellular matrix. Biophys. J. 2006;91:61–73. doi: 10.1529/biophysj.105.077115. [DOI] [PMC free article] [PubMed] [Google Scholar]
- 15.Nicolas A., Besser A., Safran S.A. Dynamics of cellular focal adhesions on deformable substrates: consequences for cell force microscopy. Biophys. J. 2008;95:527–539. doi: 10.1529/biophysj.107.127399. [DOI] [PMC free article] [PubMed] [Google Scholar]
- 16.Kobayashi T., Sokabe M. Sensing substrate rigidity by mechanosensitive ion channels with stress fibers and focal adhesions. Curr. Opin. Cell Biol. 2010;22:669–676. doi: 10.1016/j.ceb.2010.08.023. [DOI] [PubMed] [Google Scholar]
- 17.De R., Zemel A., Safran S.A. Do cells sense stress or strain? Measurement of cellular orientation can provide a clue. Biophys. J. 2008;94:L29–L31. doi: 10.1529/biophysj.107.126060. [DOI] [PMC free article] [PubMed] [Google Scholar]
- 18.Freyman T.M., Yannas I.V., Gibson L.J. Fibroblast contractile force is independent of the stiffness which resists the contraction. Exp. Cell Res. 2002;272:153–162. doi: 10.1006/excr.2001.5408. [DOI] [PubMed] [Google Scholar]
- 19.Saez A., Buguin A., Ladoux B. Is the mechanical activity of epithelial cells controlled by deformations or forces? Biophys. J. 2005;89:L52–L54. doi: 10.1529/biophysj.105.071217. [DOI] [PMC free article] [PubMed] [Google Scholar]
- 20.Zaman M.H., Kamm R.D., Lauffenburger D.A. Computational model for cell migration in 3D matrices. Biophys. J. 2005;89:1389–1397. doi: 10.1529/biophysj.105.060723. [DOI] [PMC free article] [PubMed] [Google Scholar]
- 21.Dokukina I.V., Gracheva M.E. A model of fibroblast motility on substrates with different rigidities. Biophys. J. 2010;98:2794–2803. doi: 10.1016/j.bpj.2010.03.026. [DOI] [PMC free article] [PubMed] [Google Scholar]
- 22.Engler A.J., Sen S., Discher D.E. Matrix elasticity directs stem cell lineage specification. Cell. 2006;126:677–689. doi: 10.1016/j.cell.2006.06.044. [DOI] [PubMed] [Google Scholar]
- 23.Pless D.D., Lee Y.C., Schnaar R.L. Specific cell adhesion to immobilized glycoproteins demonstrated using new reagents for protein and glycoprotein immobilization. J. Biol. Chem. 1983;258:2340–2349. [PubMed] [Google Scholar]
- 24.Kandow C.E., Georges P.C., Beningo K.A. Polyacrylamide hydrogels for cell mechanics: steps toward optimization and alternative uses. Methods Cell Biol. 2007;83:29–46. doi: 10.1016/S0091-679X(07)83002-0. [DOI] [PubMed] [Google Scholar]
- 25.Landau, L. D., and E. M. Lifshitz. 1986. Theory of Elasticity, 3rd ed. J. B. Sykes and W. H. Reid, translators. Pergamon Press, Oxford, UK.
- 26.Araki K., Kawauchi K., Tanaka N. IKK/NF-kB signaling pathway inhibits cell cycle progression via a novel Rb-independent suppression system for E2F transcription factors. Oncogene. 2008;27:5696–5705. doi: 10.1038/onc.2008.184. [DOI] [PubMed] [Google Scholar]
- 27.Katz B.-Z., Zamir E., Geiger B. Physical state of the extracellular matrix regulates the structure and molecular composition of cell-matrix adhesions. Mol. Biol. Cell. 2000;11:1047–1060. doi: 10.1091/mbc.11.3.1047. [DOI] [PMC free article] [PubMed] [Google Scholar]
- 28.Beningo K.A., Hamao K., Hosoya H. Traction forces of fibroblasts are regulated by the Rho-dependent kinase but not by the myosin light chain kinase. Arch. Biochem. Biophys. 2006;456:224–231. doi: 10.1016/j.abb.2006.09.025. [DOI] [PMC free article] [PubMed] [Google Scholar]
- 29.Dembo M., Oliver T., Jacobson K. Imaging the traction stresses exerted by locomoting cells with the elastic substratum method. Biophys. J. 1996;70:2008–2022. doi: 10.1016/S0006-3495(96)79767-9. [DOI] [PMC free article] [PubMed] [Google Scholar]
- 30.Butler J.P., Tolić-Nørrelykke I.M., Fredberg J.J. Traction fields, moments, and strain energy that cells exert on their surroundings. Am. J. Physiol. Cell Physiol. 2002;282:C595–C605. doi: 10.1152/ajpcell.00270.2001. [DOI] [PubMed] [Google Scholar]
- 31.Maskarinec S.A., Franck C., Ravichandran G. Quantifying cellular traction forces in three dimensions. Proc. Natl. Acad. Sci. USA. 2009;106:22108–22113. doi: 10.1073/pnas.0904565106. [DOI] [PMC free article] [PubMed] [Google Scholar]
- 32.Franck C., Hong S., Ravichandran G. Three-dimensional full-field measurements of large deformations in soft materials using confocal microscopy and digital volume correlation. Exp. Mech. 2007;47:427–438. [Google Scholar]
- 33.Dembo M., Wang Y.-L. Stresses at the cell-to-substrate interface during locomotion of fibroblasts. Biophys. J. 1999;76:2307–2316. doi: 10.1016/S0006-3495(99)77386-8. [DOI] [PMC free article] [PubMed] [Google Scholar]
- 34.Pankov R., Cukierman E., Yamada K.M. Integrin dynamics and matrix assembly: tensin-dependent translocation of alpha(5)beta(1) integrins promotes early fibronectin fibrillogenesis. J. Cell Biol. 2000;148:1075–1090. doi: 10.1083/jcb.148.5.1075. [DOI] [PMC free article] [PubMed] [Google Scholar]
- 35.Avnur Z., Geiger B. The removal of extracellular fibronectin from areas of cell-substrate contact. Cell. 1981;25:121–132. doi: 10.1016/0092-8674(81)90236-1. [DOI] [PubMed] [Google Scholar]
- 36.Rape A.D., Guo W.H., Wang Y.-L. The regulation of traction force in relation to cell shape and focal adhesions. Biomaterials. 2011;32:2043–2051. doi: 10.1016/j.biomaterials.2010.11.044. [DOI] [PMC free article] [PubMed] [Google Scholar]
- 37.Sawada Y., Sheetz M.P. Force transduction by Triton cytoskeletons. J. Cell Biol. 2002;156:609–615. doi: 10.1083/jcb.200110068. [DOI] [PMC free article] [PubMed] [Google Scholar]
- 38.Saez A., Anon E., Ladoux B. Traction forces exerted by epithelial cell sheets. J. Phys. Condens. Matter. 2010;22:194119. doi: 10.1088/0953-8984/22/19/194119. [DOI] [PubMed] [Google Scholar]
- 39.Han S.J., Bielawski K.S., Sniadecki N.J. Decoupling substrate stiffness, spread area, and micropost density: a close spatial relationship between traction forces and focal adhesions. Biophys. J. 2012;103:640–648. doi: 10.1016/j.bpj.2012.07.023. [DOI] [PMC free article] [PubMed] [Google Scholar]
- 40.Tzvetkova-Chevolleau T., Stéphanou A., Tracqui P. The motility of normal and cancer cells in response to the combined influence of the substrate rigidity and anisotropic microstructure. Biomaterials. 2008;29:1541–1551. doi: 10.1016/j.biomaterials.2007.12.016. [DOI] [PubMed] [Google Scholar]
- 41.Frey M.T., Tsai I.Y., Wang Y.L. Cellular responses to substrate topography: role of myosin II and focal adhesion kinase. Biophys. J. 2006;90:3774–3782. doi: 10.1529/biophysj.105.074526. [DOI] [PMC free article] [PubMed] [Google Scholar]
- 42.Solon J., Levental I., Janmey P.A. Fibroblast adaptation and stiffness matching to soft elastic substrates. Biophys. J. 2007;93:4453–4461. doi: 10.1529/biophysj.106.101386. [DOI] [PMC free article] [PubMed] [Google Scholar]
- 43.Marcq P., Yoshinaga N., Prost J. Rigidity sensing explained by active matter theory. Biophys. J. 2011;101:L33–L35. doi: 10.1016/j.bpj.2011.08.023. [DOI] [PMC free article] [PubMed] [Google Scholar]
- 44.Mitrossilis D., Fouchard J., Asnacios A. Single-cell response to stiffness exhibits muscle-like behavior. Proc. Natl. Acad. Sci. USA. 2009;106:18243–18248. doi: 10.1073/pnas.0903994106. [DOI] [PMC free article] [PubMed] [Google Scholar]
- 45.Guo W.H., Frey M.T., Wang Y.L. Substrate rigidity regulates the formation and maintenance of tissues. Biophys. J. 2006;90:2213–2220. doi: 10.1529/biophysj.105.070144. [DOI] [PMC free article] [PubMed] [Google Scholar]
- 46.Beningo K.A., Dembo M., Wang Y.L. Nascent focal adhesions are responsible for the generation of strong propulsive forces in migrating fibroblasts. J. Cell Biol. 2001;153:881–888. doi: 10.1083/jcb.153.4.881. [DOI] [PMC free article] [PubMed] [Google Scholar]
- 47.Gardel M.L., Sabass B., Waterman C.M. Traction stress in focal adhesions correlates biphasically with actin retrograde flow speed. J. Cell Biol. 2008;183:999–1005. doi: 10.1083/jcb.200810060. [DOI] [PMC free article] [PubMed] [Google Scholar]
- 48.Califano J.P., Reinhart-King C.A. A balance of substrate mechanics and matrix chemistry regulates endothelial cell network assembly. Cell. Mol. Bioeng. 2008;1:122–132. [Google Scholar]
- 49.Reinhart-King C.A., Dembo M., Hammer D.A. Endothelial cell traction force on RGD-derivatized polyacrylamide substrata. Langmuir. 2003;19:1573–1579. [Google Scholar]
- 50.Reinhart-King C.A., Dembo M., Hammer D.A. Cell-cell mechanical communication through compliant substrates. Biophys. J. 2008;95:6044–6051. doi: 10.1529/biophysj.107.127662. [DOI] [PMC free article] [PubMed] [Google Scholar]
- 51.Reinhart-King C.A., Dembo M., Hammer D.A. The dynamics and mechanics of endothelial cell spreading. Biophys. J. 2005;89:676–689. doi: 10.1529/biophysj.104.054320. [DOI] [PMC free article] [PubMed] [Google Scholar]
- 52.Leach J.B., Brown X.Q., Wong J.Y. Neurite outgrowth and branching of PC12 cells on very soft substrates sharply decreases below a threshold of substrate rigidity. J. Neural Eng. 2007;4:26–34. doi: 10.1088/1741-2560/4/2/003. [DOI] [PubMed] [Google Scholar]
- 53.Paszek M.J., Zahir N., Weaver V.M. Tensional homeostasis and the malignant phenotype. Cancer Cell. 2005;8:241–254. doi: 10.1016/j.ccr.2005.08.010. [DOI] [PubMed] [Google Scholar]
Associated Data
This section collects any data citations, data availability statements, or supplementary materials included in this article.