Abstract
Inherent uncertainties in surgery durations impact many critical metrics about the performance of an operating room (OR) environment. OR schedules that are robust to natural variability in surgery durations require surgery duration estimates that are unbiased, with high accuracy, and with few cases with large absolute errors. Earlier studies have shown that factors such as patient severity, personnel, and procedure type greatly affect the accuracy of such estimations. In this paper we investigate whether operational and temporal factors can be used to improve these estimates further. We present an adjustment method based on a combination of these operational and temporal factors. We validate our method with two years of detailed operational data from an electronic medical record. We conclude that while improving estimates of surgery durations is possible, the inherent variability in such estimates remains high, necessitating caution in their use when optimizing OR schedules.
Introduction
The operating room (OR) is a critical resource in the hospital, and OR scheduling is a challenging and critical problem that affects patient throughput, utilization, revenue, clinical outcomes, staff overtime, Post-Anesthesia Care Unit arrival rates, as well as patient and staff satisfaction metrics such as number of on-time starts and waiting times. We are in the process of a research project to create an integrated planning and scheduling system that enables prediction of the impact of an OR schedule on key performance indicators of interest, thus enabling understanding of the likely consequences of any given plan and optimization across multiple criteria [12]. Accurate prediction of surgery durations is an important component. When surgeries take longer than predicted, subsequent cases get postponed (resulting in decreases in on-time starts and extra demands on staff time) or cancelled (creating throughput issues); on the other hand, overly conservative estimates result in empty ORs and lower utilization and throughput. Overall, unbiased and highly accurate estimates will enable more efficient OR suites as well as better patient experiences and outcomes.
Due to the inherent uncertainty and unpredictable variability from case to case, predicting duration of surgery reliably is a very difficult problem. There are three main lines of approach among research on procedure duration estimations in the literature.
The first line of research intends to identify the most significant factors that contribute to the variability of procedure durations. For example, Gillespie et al. conducted structured observations to unveil to what extent the factors such as interruptions, communication failures, team familiarity and unplanned operations prolong the expected length of an operation [5]. They found that the most significant factor is the number of communication failures. Cassera et al. specifically analyzed the effect of the surgery team size on surgery time and found that when procedure complexity and patient condition were held constant, adding one individual to a team predicted a 15.4 minutes increase in procedure time [1].
The second line of research studies the goodness fit of known distributions, especially the normal distribution and lognormal distribution, and identifies the best parameters for procedure duration estimation for predicting procedure durations. Strum et al. tested the goodness of fit of both lognormal and normal models to their data and found that the lognormal model is statistically superior to the normal model for modeling dual-procedure surgeries [10]. Stepaniak et al. found that the 3-paramter lognormal distribution (i.e., including location parameter) provides the best results for the case durations of Current Procedural Terminology (CPT)-anesthesia combinations, with an acceptable fit for almost 90% of the CPTs when segmented by the factor surgeon [8]. Spangler et al. identified the best order statistics to use for the location parameter of the lognormal distribution of surgical procedure time [11].
The third line of research relies on regression models to develop predictive models. Dexter et al. found that the precise procedure types, represented by CPT codes, are the most important factor in predicting surgical case durations [2, 3], and Li et al. [7] build a linear regression model and a log-regression model based on CPT codes. Stepaniak et al. [9] build predictive models of procedure times by specifically investigating the possible effect of surgeon factors like age, experience, gender and team composition. The factors found most often to be significant are team composition, experience and time of the day. Eijkemans et al. [4] devised a prediction model using a much richer set of factors including the surgeon’s estimate and characteristics of the surgical team, the operation, and the patient. In their model, the potential predictive factors were surgeon’s estimate, number of planned procedures, number and experience of surgeons and anesthesiologists, patient’s age and sex, number of previous hospital admissions, body mass index, and eight cardiovascular risk factors. Using the prediction model instead of the surgeon’s prediction based on historical averages would reduce shorter-than-predicted and longer-than-predicted OR time by 2.8 and 6.6 minutes per case.
Methods
We focused on the cases performed from January 2010 through December 2011 in the main OR suite (with seven operating rooms) at Lucile Packard Children’s Hospital. During this period, a total of 10,305 surgeries were completed in the seven ORs under consideration. Almost all of these surgeries were elective. We used surgery durations obtained from EMR data; detailed electronic documentation was available to give us up-to-the-minute accurate surgery durations.
Before estimating the durations, we first investigated whether actual surgery durations follow a well-known parametric distribution, such as log-normal and normal. This was necessary to determine whether we could use a simpler parametric method or should look for an estimation method that is more robust to different distributional forms.
Our base estimation method was Last 5 Case estimate, which is currently in widespread use. This method is procedure-surgeon specific if enough historical data is available (i.e., the particular surgeon has performed at least 5 surgeries of the particular type in the last year), and otherwise the estimates are generated from all the same type of procedures performed by any surgeon (again, if enough history is available), as advocated by Macario et al. [6]. They also showed that in the absence of sufficient historical data for a procedure-surgeon pair, procedure-specific estimates perform very well as compared to more sophisticated alternatives. If the above conditions hold, Last 5 Case estimate is the mean of the last 5 surgeries in the relevant history. We excluded all cases for which the considered procedure did not appear in our data at least 5 times prior to scheduling, although operationally for such cases one could use a static procedure-specific estimate (i.e., procedure cards).
First, we evaluated the performance of Last 5 Case estimation method using two metrics: bias and mean absolute deviation (MAD) (in minutes) as an indication of accuracy. The (systematic) bias is measured by the mean difference between the actual and estimated duration. A value close to zero implies that there is no systematic bias, whereas a negative (or positive) bias implies that the estimation method is systematically overestimating (underestimating) the duration. The second metric, MAD, is the mean absolute difference between the actual and estimated duration, which measures the spread of the error in the estimation. Finally, we measured the distribution (in 15 minute intervals) of the number and percentage of cases with various errors, focusing especially on cases with large errors (defined as absolute deviation of greater than an hour), and also on those cases with negligible (less than 5 minutes) or small (less than 15 minutes) absolute deviations.
We further investigated whether operational or temporal factors could be used to improve the quality of these estimates or at least reduce the number of large errors (as these affect the surgical schedule most significantly). Since our main goal is to derive estimates that can be used in scheduling surgeries a day in advance, we focus on factors that are known at scheduling time. Moreover, to maximize the general replicability of our method, we minimize reliance on detailed clinical case data (other than procedure type to be scheduled) and focus instead on leveraging operational and temporal data typically available easily at the time of scheduling. On the operational side, we use order of a surgery, OR assignment, and surgical staff. On the temporal side, we use the weekday, month, year, and time of day. Even though Last 5 Case estimate is procedure-surgeon specific, we include surgeon information in the explanatory variables to understand if Last 5 Estimate has to be adjusted for each surgeon (due to the specific surgeon’s style) if the estimate is only procedure specific. Other factors include whether the case is an add-on, the type of patient stay (inpatient or surgical day care).
In order to understand the effect of each of these factors, we set up a regression model in order to explain the difference between log (Actual Duration) and log (Last 5 Estimate). Hence we solve the following model:
where n = 195. Given the high number of explanatory variables, we use elastic-net regularized generalized linear model [13]. This approach helps us do model selection and identify the factors have more explanatory power compared to others. To minimize the possibility of model overfit due to large number of independent variables, we cross-validated the model on a testing sample of 748 randomly selected cases.
Results
Out of 10305 surgeries, surgeon-procedure-specific estimates were available for 4756 cases and multi-surgeon, procedure-specific estimates for 2729 cases. The remaining 2820 cases had to be excluded due to limited historical data for that procedure prior to scheduling.
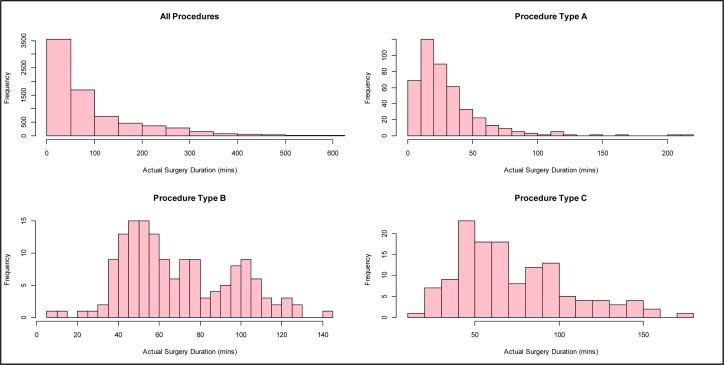
As Figure 1 shows, we found that a log-normal fits well when all cases are grouped together as well as for some procedures (e.g., Procedure Type A). However, at the procedure-specific level, the log-normality assumption is not valid for many of the most common procedures; for example, Procedure Type B has a multi-modal distribution, and Procedure Type C is neither normal nor log-normal. Hence we conclude that any estimation method should be robust to different distributional forms.
Figure 1.
Histograms of the actual surgery durations for all procedures and three of the most frequent surgeries.
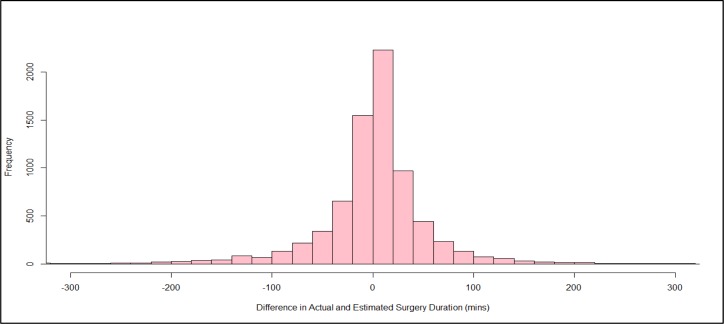
As the last row of Table 1 shows, we found that Last 5 Estimate produced an almost unbiased estimate with a bias across all cases of 0.3 minutes. MAD across all cases indicated an average 35 minute difference between the estimate and the actual duration (due to either underestimation or overestimation). Figure 2 shows a histogram for the difference in actual and estimated surgery duration, showing that estimation errors appear symmetrical with relatively long tails.
Table 1.
Bias and Accuracy of Last 5 Estimate Method by specialty.
| Specialty | Number of Cases | Bias (min) | MAD (min) | CV |
|---|---|---|---|---|
| General | 1621 | 0 | 24 | 55% |
| Otolaryngology | 1341 | −1 | 25 | 103% |
| Urology | 1003 | 1 | 33 | 85% |
| Orthopedics | 804 | 0 | 40 | 67% |
| Cardiothoracic Surgery | 759 | 0 | 79 | 154% |
| Plastic | 518 | 2 | 35 | 78% |
| Ophthalmology | 488 | 2 | 19 | 73% |
| Neurosurgery | 480 | 3 | 52 | 86% |
| Transplant-related | 183 | 0 | 42 | 225% |
| Anesthesia | 179 | −3 | 47 | 75% |
| Hematology & Oncology | 30 | −4 | 22 | 67% |
| Gastroenterology | 26 | 4 | 13 | 140% |
| Others | 53 | −4 | 44 | 84% |
| All | 7485 | 0.271612 | 35.83718 | 89% |
Figure 2.
Histogram of the difference between the estimated and actual values of surgery durations.
We examined the performance across several groups, including specialty, procedure, surgeon, sequence, and temporal groups. We did not find a significant bias in any of these groupings, as the bias column of Table 1 shows for the grouping by specialty (which is representative for other groupings).
What Table 1 also shows is that there was strong heterogeneity both within and across specialties in terms of MAD, ranging from a mean of 13 minutes for Gastroenterology to 79 minutes for Cardiothoracic Surgery. To determine the effect of average surgery duration for each specialty, we also provide an estimate of coefficient of variation (CV) for MAD. From this perspective, general surgery had the lowest CV at 55%, and transplant-related surgeries the highest at 225%. The average CV across all cases was 89%, indicating significant spread for all specialties. Results for all other groupings were similar.
We then investigated the effect of operational or temporal factors on errors, as this could potentially offer a means to improve predictability. We found that indeed there are some factors that are significant. Table 2 lists the results of our regression, showing significant temporal and operational factors along with their respective percentage adjustment. The strongest factors were whether the procedure was performed for an outpatient (−14%), whether the case was an add-on case (−11%), or whether the case started after 5pm (−7%). The statistically significant factors, out of a possible 195, are shown in Table 2.
Table 2.
Significant factors that affect Last 5 surgery duration estimates.
| Factors | Percentage Adjustment to Last 5 Estimate |
|---|---|
| Month: January | 5% |
| Case: Add On | −11% |
| Encounter: Inpatient | 4% |
| Encounter: Outpatient | −14% |
| Sequence: 6 | −4% |
| Time of Day: After 5 pm | −7% |
In addition to the factors in Table 2, our model also identified a subset of surgical staff for which an adjustment to the Last 5 Estimate could improve the predictability of surgery durations when only procedure-specific estimation is available. This would suggest a hybrid solution for the cases with limited procedure-surgeon specific history and adjust procedure-specific estimates.
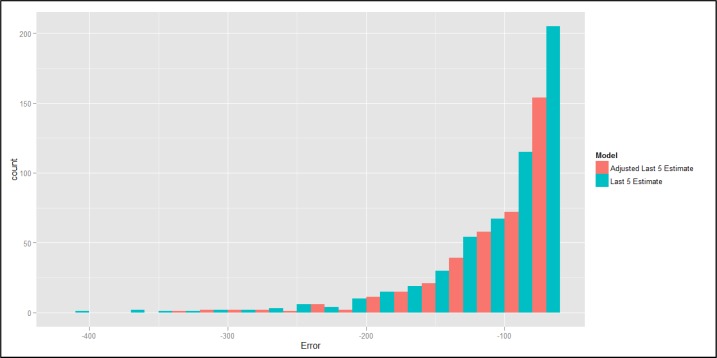
The overall fit of the adjusted model improved MAD by 3%, from 36 minutes to 34.8 minutes in the training sample and from 35.1 minutes to 34.1 minutes in the validation set. However, for cases with long durations, the improvement was much greater, as suggested in Figure 3 for a comparison of errors produced with Last 5 Estimation and the proposed adjustment to that method. We find that the adjusted model is quite effective in reducing large negative errors. Last 5 Estimation produces large negatives errors (more than 60 minutes) for 8% of cases, whereas the adjusted model produces large negative errors for only 5.7% of cases.
Figure 3.
A histogram of the large negative difference between the estimated and actual values of surgery durations between two models.
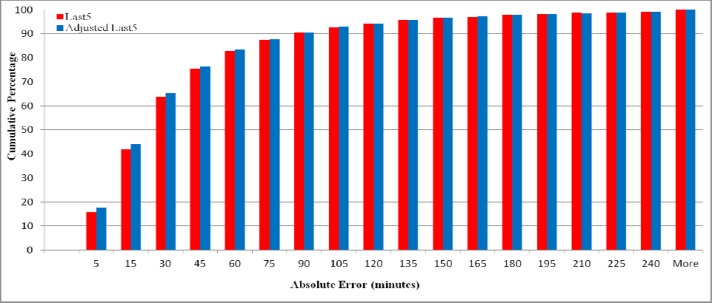
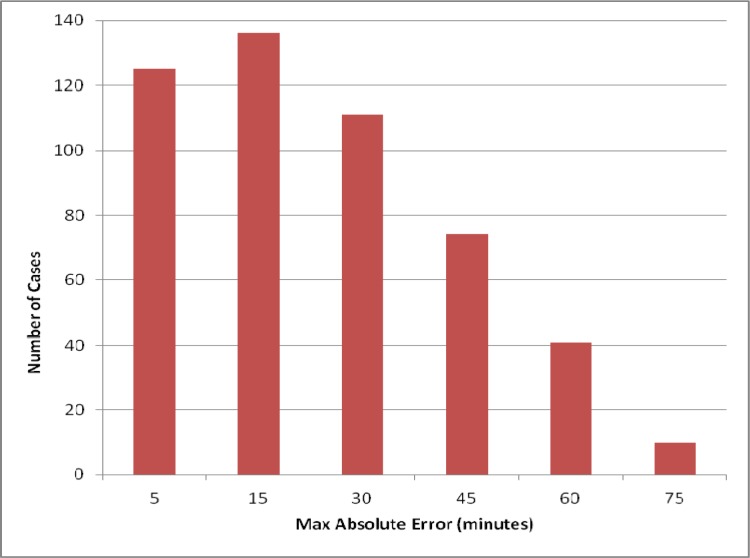
The effect of the proposed model on relatively good estimates is interesting as well, as shown in Figures 4 and 5. The adjusted model (shown in blue in Figure 4) had an absolute error of 5 minutes or less for 17.64% of cases (1186 cases) versus 15.76% (1061 cases) using Last 5 Estimation (shown in red). Similarly, the adjusted model had an absolute error of 15 minutes or less in 44% of cases (2957 cases) versus 42% (2821 cases). In other words, as shown in Figure 5, for an extra 121 cases the absolute forecast error was negligible, and for an extra 136 cases the error was 15 minutes or less.
Figure 4.
Cumulative percentage of cases with absolute error estimation times up to the number of minutes shown in the x-axis.
Figure 5.
Number of additional cases in which the proposed model is within the number of minutes shown on the horizontal axis.
Discussion
While MAD of Last 5 Estimate was much better in our two years of data than that reported as representative in the literature (e.g. 66 minutes in [6] compared to 35 minutes in our data), the inherent variability in such estimates remains high. This high variability in duration leads to inefficiencies in OR schedules, both in terms of utilization (throughput) as well as in on-time starts. The classic approach has been to prioritize utilization (as the OR is a critical and expensive resource), thus creating an expectation of long delays and much staff overtime, and overall poor experiences for both patients and staff.
We see that operational factors are promising in improving predictability of surgery durations. We believe these estimates could be improved additionally with patient severity measures, like data from ASA physical status classification systems and other variables under investigation. We are currently investigating the extent to which the regression model can be improved further, although such improvements require significant data integration in operational settings (something that would limit the generalizability of the results).
We were pleased to see a substantial improvement in the number of cases for which the absolute error was less than 5 minutes or less than 15 minutes, as these highly accurate forecasts enable us to have a better schedule. On the other end of the distribution, we also saw improvements in long tails in the error distribution. These can be especially disruptive, as a single bad case can throw off the entire day for an OR. Large negative errors are not necessarily better than large positive ones, nor do they cancel one another: When a surgery finishes much earlier than estimated, the OR may have to stay empty until the next scheduled case, which may then run over.
The variability in estimates necessitates caution in their use when optimizing OR schedules. Clearly, when on average the best method is off by half an hour, it makes it very difficult to create an accurate surgical schedule a day in advance by mere forecasting. In this light, there are several strategies. First, in the scheduling system, we have made available quantiles in addition to single point estimates on procedure duration, thus providing the scheduling staff with further flexibility, for example to take into account the anticipated complexity of a case or to schedule more or less aggressively depending on the circumstances. Second, we have developed a simulation system that takes an entire surgical schedule and generates anticipated next-day metrics as well as bounds on those metrics given the entire distribution of case durations for the types of cases scheduled for the next day. Thus, we can get an expectation of number of on-time starts, likely PACU bottleneck times, utilization for each of the rooms, and probability of various amounts of overtime needed. This enables more rational tradeoffs among such target variables. Our early results indicate that our system could decrease the average patient waiting time by up to 60% and increase on-time starts by up to 30%, while maintaining the current total overtime and OR utilization levels [13]. Other tradeoffs are possible as well, of course.
References
- 1.Cassera MA, Zheng B, Martinec DV, Dunst CM, Swanström LL. Surgical Time Independently Affected By Surgical Team Size. Am J Surg. 2009;198(2):216–22. doi: 10.1016/j.amjsurg.2008.10.016. [DOI] [PubMed] [Google Scholar]
- 2.Dexter F, Traub RD, Qian F. Comparison Of Statistical Methods To Predict The Time To Complete A Series Of Surgical Cases. Journal of Clinical Monitoring and Computing. 1999;15:45–51. doi: 10.1023/a:1009999830753. [DOI] [PubMed] [Google Scholar]
- 3.Dexter F, Dexter EU, Masursky D, Nussmeier NA. Systematic Review Of General Thoracic Surgery Articles To Identify Predictors Of Operating Room Case Durations. Anesth Analg. 2008;106(4):1232-4.1. doi: 10.1213/ane.0b013e318164f0d5. [DOI] [PubMed] [Google Scholar]
- 4.Eijkemans MJ, van Houdenhoven M, Nguyen T, Boersma E, Steyerberg EW, Kazemier G. Predicting The Unpredictable: A New Prediction Model For Operating Room Times Using Individual Characteristics And The Surgeon’s Estimate. Anesthesiology. 2010;112(1):41–9. doi: 10.1097/ALN.0b013e3181c294c2. [DOI] [PubMed] [Google Scholar]
- 5.Gillespie BM, Chaboyer W, Fairweather N. Factors That Influence The Expected Length Of Operation: Results Of A Prospective Study. BMJ Qual Saf. 2012;21(1):3–12. doi: 10.1136/bmjqs-2011-000169. [DOI] [PubMed] [Google Scholar]
- 6.Macario A, Dexter F. Estimating the Duration of a Case When The Surgeon Has Not Recently Scheduled The Procedure At The Surgical Suite. Anesth Analg. 1999;89:1241–5. [PubMed] [Google Scholar]
- 7.Li Y, Zhang S, Baugh RF, Huang JZ. Predicting Surgical Case Durations Using Ill-Conditioned CPT Code Matrix. IIE Transactions. 2010;42(2):121–135. [Google Scholar]
- 8.Stepaniak PS, Heij C, Mannaerts GH, de Quelerij M, de Vries G. Modeling procedure and surgical times for current procedural terminology-anesthesia-surgeon combinations and evaluation in terms of case-duration prediction and operating room efficiency: a multicenter study. Anesth Analg. 2009;109(4):1232–45. doi: 10.1213/ANE.0b013e3181b5de07. [DOI] [PubMed] [Google Scholar]
- 9.Stepaniak PS, Heij C, De Vries G. Modeling and prediction of surgical procedure times. Statistica Neerlandica. 2010;64(1):1–18. [Google Scholar]
- 10.Strum DP, May JH, Sampson AR, Vargas LG, Spangler WE. Estimating times of surgeries with two component procedures: comparison of the lognormal and normal models. Anesthesiology. 2003;98(1):232–40. doi: 10.1097/00000542-200301000-00035. [DOI] [PubMed] [Google Scholar]
- 11.Spangler WE, Strum DP, Vargas LG, May JH. Estimating procedure times for surgeries by determining location parameters for the lognormal model. Health Care Manag Sci. 2004;7(2):97–104. doi: 10.1023/b:hcms.0000020649.78458.98. [DOI] [PubMed] [Google Scholar]
- 12.Wang H, Kayis E, Patel M, Santos C, Gonzalez T, Jain S, Singhal S, Ramamurthi RJ, Longhurst C, Suermondt J, Sylvester K. An Integrated Next-Day Operating Room Scheduling System. 2012. Submitted as poster to AMIA.
- 13.Zou H, Hastie T. Regularization and variable selection via the elastic net. J R Statist Soc B. 2005;67:301–320. Part 2. [Google Scholar]


