

Abstract
Health information systems receive data through various methods. These data exchange methods have the potential to influence data quality. We assessed a de-identified 2010 dataset including 757,476 demographic records and 2,634,101 vaccination records from Washington State’s Immunization Information System (IIS) to describe timeliness and completeness of IIS data across several data exchange methods: manual entry, HL7, and flat file upload. Overall, manually-entered data and HL7 records were more timely than records imported as flat files. Completeness, though very high overall, was slightly higher for records arriving via flat file. Washington State IIS users, including clinicians and public health, rely on its data to inform patient care and determine population coverage of immunizations. Our results suggest that although data element completeness in systems like Washington’s IIS will likely not be immediately or significantly impacted by provider’s migration to HL7 connections with IISs, timeliness could be substantially improved when using HL7 connections.
Introduction
Immunization Information Systems (IISs) were originally intended to record vaccination data for the residents of a geographic area. However, over the last 8 years their functionality has been extended to include sending caregiver reminders, forecasting recommended immunizations, running reports, assessing coverage, managing inventory, and generating immunization certificates.1–3 In 2010 the Taskforce on Community Preventive Services, citing a large body of evidence backing the assertion that IISs are effective in increasing immunization rates,4 advocated expanded support of using IISs. Despite the Healthy People 2020 objective of 95% IIS coverage rate for children under six5 only 77% of children in this age group in the United States have 2 or more vaccinations records stored in a fully functional IIS6. Expanding coverage may increase usage of IISs,7 but utility of any information system or data source depends on a combination of its administrative and technical characteristics and the data and information contained within it. Data quality, most often measured by characterizing the timeliness, completeness and accuracy of data, describes an important and multi-faceted predictor of system usefulness.8 Data quality has been well-studied within and outside the field of public health, in the fields of business management, manufacturing, and computing.9–11 The health and informatics literature have identified numerous additional dimensions of data quality: clarity, comprehensiveness, conciseness, consistency, content, coverage, credibility, efficiency, flexibility, format, freedom from bias, importance, level of detail, precision, relevance, reliability, scope, specificity, sufficiency, usability, and validity.9; 12–14 For healthcare professionals, information systems are important resources that are essential for daily work and several studies emphasize quality as an important factor in choosing an information source,15–18 including for public health information seekers.19
However, technical and sociotechnical barriers as well as resource constraints continue to impede the pursuit of high quality data in IISs. Studies have shown that IIS data are often incomplete and inaccurate.20–22 Timeliness of immunization data is also a concern; a 2006 CDC report2 and an independent study23 found that less than 75% of all immunizations were recorded in an IIS within 30 days of administration. IISs and the general health information environment are evolving rapidly, offering opportunities for improvement in data quality.
Kolasa, et al (2006) reported that providers working in a high risk area of Philadelphia who used electronic submission of Electronic Health Record (EHR) data had significantly more children in the IIS and higher registry-reported immunization coverage rates than providers using billing records or log forms for data submission. Since the Kolasa study, the CDC has suggested that an increase in uptake of standards such as Health Level Seven (HL7) messaging in both IISs and EHR systems and increased connections between IISs and EHRs may benefit the general quality, timeliness5 and completeness of IIS data.24 Data from the 2009 Immunization Information Systems Annual Report (IISAR) survey indicated that 59% of CDC IIS grantees were capable of using HL7 messaging standards to send and receive data.5 Creating, processing and receiving HL7 messages has been a part of the National Immunization Program’s Minimum Functional Standards for Registries since 2001.24 In addition, the proportion of providers using HL7 is expected to increase in response to Health Information Technology for Clinical and Economic Health (HITECH) Act incentives which encourage the adoption of certified EHR systems.26 Under HITECH, Medicare and Medicaid provide financial incentives for the Meaningful Use (MU) of EHR technology and specify several objectives related to connections between EHRs and public health systems. One IIS-related criterion requires that a provider’s EHR systems be capable of submitting immunization data to a registry using HL7 V2 messaging standards. Though some have speculated that MU incentives will lead to an improvement in data quality, it is not clear exactly what the impact of an increased proportion of HL7 connections will be on the quality of IIS data.
The immunization community has long recognized the importance of data quality for the function of programs and systems, and, in 2007, the National Vaccine Advisory Committee recommended “...the adoption of a guidebook and best practices for IIS…to adopt uniform operational guidance and quality control procedures that ensure good data quality”.27 This guidebook describes best practices for IIS functional areas including data quality28 and have been adopted by several states, including Washington.29 Healthcare providers across Washington State currently contribute immunization data to the Child Profile system. Child Profile was implemented in 199330 and currently covers 96% of children under 6 years old and is used by 100% of public providers and 81% of private providers in the state.31 Child Profile uses several types of data exchange: HL7 connections between EHR systems and the IIS, batch uploads of flat files, and web data entry and record retrieval. Generally, vital records (birth certificates) are a definitive source for patient date of birth and provider records are accepted as the best source for immunization information and updates to demographic data. On the other hand, electronic billing records are a less ideal source of data.32
Not only are IISs immensely useful for providers and public health professionals administering immunizations, but they offer great potential as a population data source for other uses such as community health planning, vital records and epidemiologic studies.33 Because of the prevalence of IISs, their relative maturity, and their demonstrated success in linking clinical practice with public health, they may be important building blocks for national health information systems.34 As such, IISs offer a unique opportunity to study data quality across different methods of data exchange in a system used by both clinical and public health practitioners. In coming years, MU incentives have the potential to change the quantity and quality of provider-IIS connections across the United States. However, evidence of data quality differences across different types of information exchange is sparse. This paper reports on our investigation of the impact of different types of provider-IIS exchanges on IIS data quality. We used a de-identified dataset from 2010 to describe the timeliness and data element completeness, stratified by data exchange type, of immunization data in Washington’s IIS.
Methods
Sample Dataset, Inclusion and Exclusion Criteria
Our sample included childhood immunization data submission transactions for which the recorded service date was between 1/1/2010 and 12/31/2010 (inclusive). The sample included all records existing in the Washington State IIS database as of July 27, 2011 for individuals who had at least one immunization administered during 2010 to patients reported to be between the ages of 0 and 18 at some time during this period (1/1/1991<DOB<12/31/2010). We excluded “historical” immunizations, for which data were entered after the vaccine was administered. We included demographic records from birth certificate data, but excluded vaccinations from birth certificate data as they made up a very small proportion of the recorded vaccinations and are different in many ways from the vaccination data transferred to the IIS by providers. Data exchange types were recorded in the IIS for each record and included web data entry, HL7 messages and batch uploads of flat files. Flat files were uploaded using Child Profile’s Data Transfer Tool and include records received as flat files from providers, Medicaid, or other insurers.
The sample dataset included individual person records, but excluded most Protected Health Information (PHI). In all fields for which PHI was redacted, data completeness was indicated: “1” - complete and “0” - incomplete. We were granted approval for the study and a waiver of informed consent by the institutional review boards of the Washington State Department of Health and the University of Washington.
Timeliness
Based on preliminary work and literature review, we determined that the appropriate immunization-level timeliness measure (ImTM) was the number of days between immunization administration (Service Date) and submission of data to the IIS (Entry Date).35 Saarlas (2003) specified three categories of timeliness: ImTM ≤ 7 days, ImTM = 8–30 days, and ImTM ≥ 31 days.35 We calculated this measure for each vaccine record in our sample and also examined the data aggregated by visit in order to consolidate all immunizations that were administered during the same visit into a single record.
Completeness
The MIROW Data Quality Assurance Guidelines specify two types of completeness: comprehensive reporting of vaccination events (population coverage) and complete recording of vaccination data elements (record or data element completeness).32 Comprehensive reporting is an important characteristic of any population registry, however, our study focused on the complete recording of data elements. In addition, it was not feasible to perform the chart reviews necessary to assess population coverage as part of this study.
We measured the completeness of demographic and vaccination data elements and calculated the number of complete fields per record for demographic records and vaccination records. We calculated the following measures as proportions for each record in the sample:
DC = Number of demographic fields complete /Total number of demographic fields (13 fields)
IC = Number of immunization-level fields complete/Total number of immunization-level fields (6 fields)
We examined the following fields to calculate demographic completeness: First Name, Middle Name, Last Name, Address, City, State, Zip, Phone, Social Security Number (SSN), Birthdate, Medical Organization and Facility. To calculate immunization level completeness and visit-level completeness we examined: Date of Service, Date of Entry, Current Procedural Terminology (CPT) Code, Immunization Description, Medical Organization, and Facility.
In addition to overall completeness measures, we examined the completeness of the minimum/mandatory data items as defined in the MIROW Data Quality Assurance document.32 This minimum dataset comprises: First Name, Last Name and Birthdate, Provider Organization Information, Vaccine Encounter Date, and Vaccine Type.
Timeliness and Completeness Measured across Data Exchange Types
We compared timeliness and completeness measures across data exchange types: HL7, batch upload of flat files, manual web entry, and in the case of demographic records, birth certificate data. Statistical analyses were performed using SAS ® software, Version 9.2.36
Results
After excluding 482 vaccination records originating from the birth certificate file and three immunization records with negative timeliness measures, our sample included 757,476 individual records and 2,634,101 vaccination records.
Twenty-eight percent of the patients included in the sample were born between 2008 and 2010 (approximately ages 3 and under during 2010), 26% between 2004 and 2007 (approximately ages 4–6 during 2010) and 46% between 1991 and 2003 (approximately ages 7–18 during 2010). Each patient included in the sample was linked to 1– 29 vaccination records; the mean number of vaccination records per patient record was 3.5. Within the 2,634,101 vaccination records, 1,269,347 unique visit records were identified for which Patient ID, Service Date, Entry Date, Medical Organization and Facility were equal. For example, if a child received three immunizations during one visit to their provider, these three immunizations were consolidated into a single visit record.
All patient demographic records had a complete data transmission mode field: 55% were listed as batch flat file, 15% as birth certificate (vaccination records with transmission type birth certificate were excluded, however demographic records remained), 17% as HL7 and 14% as manual web data entry (hereafter referred to as manual data entry). The data transmission mode field was also complete for all vaccination records in our sample: 53% of vaccination records were listed as batch flat file, 30% as manual data entry and 18% as HL7 transmission type.
Timeliness
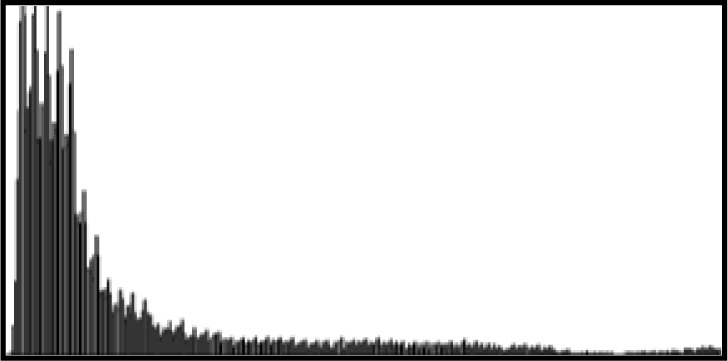
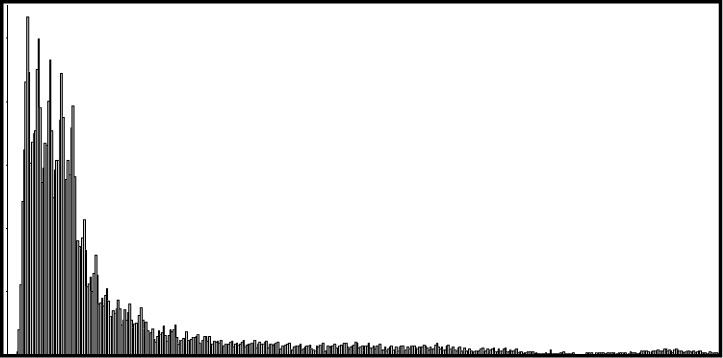
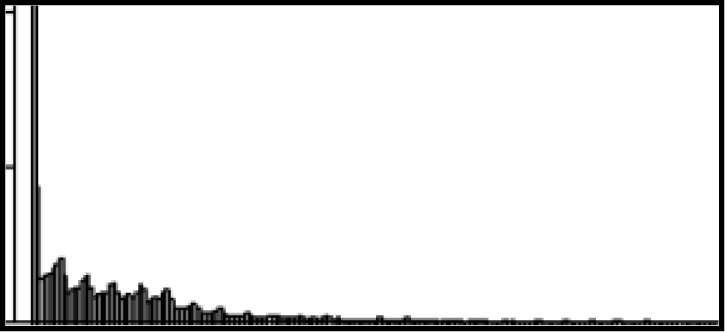
The median timeliness measure for all vaccination records was 11 days. When aggregated by visit, the median timeliness measure for the sample was 12 days. Mean, standard deviation (SD), median, and interquartile ranges (IQR) for timeliness were similar when data were analyzed for both data aggregated by vaccination record and by visit. In both cases, the greatest median timeliness measure (longest delay) was 31 days for the batch flat file category (mean 66.02 and 63.87 days for vaccination level and visit level, respectively). Both groupings showed the mean timeliness for manual data entry much lower, at around 9 days and the median at 0 (Entry Date = Service Date). Table 1 shows sample size, mean, SD, median, IQR and a histogram to demonstrate skew for each data exchange type.
Table 1.
Descriptive statistics and histograms* of timeliness of vaccination and visit records by exchange type
| Dataset | ||||
|---|---|---|---|---|
|
| ||||
| Vaccination Record | Visit Record | |||
| Manual Entry | ||||
|
| ||||
| N |

|
792,402 |

|
361,712 |
| Mean | 8.31 | 9.63 | ||
| SD** | 40.26 | 43.74 | ||
| Median | 0 | 0 | ||
| IQR*** | 0–1 | 0–2 | ||
|
| ||||
| HL7 | ||||
|
| ||||
| N |

|
477,652 |

|
227,101 |
| Mean | 29.23 | 28.51 | ||
| SD | 84.69 | 82.42 | ||
| Median | 0 | 0 | ||
| IQR | 0–3 | 0–4 | ||
|
| ||||
| Batch Flat File | ||||
|
| ||||
| N |
|
1,364,047 |
|
680,534 |
| Mean | 66.02 | 63.87 | ||
| SD | 88.95 | 85.84 | ||
| Median | 31.00 | 31.00 | ||
| IQR | 16–67 | 16–65 | ||
|
| ||||
| Total | ||||
|
| ||||
| N |

|
2,634,101 |
|
1,269,347 |
| Mean | 41.99 | 42.09 | ||
| SD | 80.97 | 79.36 | ||
| Median | 11.00 | 12.00 | ||
| IQR | 0–37 | 0–38 | ||
Histograms are of identical scale across rows but not columns (for comparison and to demonstrate skewness)
SD = Standard Deviation,
IQR = Interquartile Range
We categorized timeliness using the Saarlas categorization described above. Most visit records fell into the <7 days category (44.13%) while 24.78% fell in the 7–30 days category and 31.09% fell into the over 30 days category. Overall, manual data entry (88.52%) and HL7 (80.40%) had a far greater proportion of records in the <7 days category than batch flat file records (8.43%).
The CDC’s IIS Technical Working Group established a limit of 30 days post vaccine administration for the arrival of records into the IIS;25 we used this limit (≤30 days or >30 days) to categorize timeliness measures and explored the effect of data exchange type on this binary variable. Relative to manual entry, HL7 records had more than twice the likelihood (OR=2.79; 95% CI 2.74–2.84) of arriving after 30 days. Batch flat file records were over 18 times more likely than Manual records to arrive after 30 days (OR=18.77; 95% CI 18.49–19.07). Details and proportion of records in each category are shown in Table 2.
Table 2:
Association of Data Exchange Type with Timeliness Measure
| Exchange Type | Timeliness Measure (%) | ||||
|---|---|---|---|---|---|
| N | <7 days | 7–30 days | >30 days | OR (CI)* | |
| Manual | 361,712 | 88.52 | 6.27 | 5.21 | 1 (ref) |
| HL7 | 227,101 | 80.40 | 6.31 | 13.29 | 2.79 (2.74–2.84) |
| Batch Flat File | 680,543 | 8.43 | 40.78 | 50.78 | 18.77(18.49–19.07) |
|
| |||||
| Total | 1,269,347 | 44.13 | 24.78 | 31.09 | - |
OR indicates odds ratio, CI indicates confidence interval calculated for a timeliness measure categorized as ≤30 days or >30 days, test of null hypothesis (regression coefficient equal to zero, Chi-square DF=2) was significant, P <.0001
Completeness
The mean completeness measure for all vaccination records was 99.28%. Date of Service, Immunization Description and Medical Organization fields were complete for all vaccination records in the sample. Mean completeness differed only slightly by exchange type. For demographic information, batch flat file records had the highest mean completeness at 90.76%. HL7 records had the highest mean completeness (99.50%) for vaccination records. Mean completeness measures for both demographic and vaccination records across data transmission methods are shown in Table 3.
Table 3:
Mean record completeness for demographic and vaccination records by method of data transmission
| Percent Completeness–Mean | |||||
|---|---|---|---|---|---|
| Demographic Records | Manual Entry | HL7 | Batch Flat File | Birth Cert | Total |
| 87.66 | 89.98 | 90.76 | 89.84 | 90.07 | |
| Vaccination Records | Manual Entry | HL7 | Batch | -- | Total |
| 99.76 | 99.50 | 98.93 | -- | 99.28 | |
We also calculated the percent completeness for each demographic field. Fields that were 100% complete for each exchange type included: First Name, Last Name and Birth Date. Fields that were 98% complete or higher included: Address, City, State, and Zip Code. Middle Name was incomplete in many cases. We used logistic regression to calculate the OR for a complete Middle Name field. HL7 records were less likely to have a complete Middle Name field than manual entry records, but both batch flat file and Birth Certificate records were significantly more likely to have a complete Middle Name field than manual entry records (OR=1.45, 95% CI 1.43–1.47 and OR=3.52, 95% CI 3.45–3.58, respectively). Phone number varied in completeness by exchange type: 80.86% for manual entry records and 95.46% for HL7 records. Social Security Number also varied by transmission method: 9.44% of Birth Certificate records were complete and 32.95% of batch flat file records carried an entry for SSN. Medical Organization and Facility were both relatively complete fields. Table 4 shows data element completeness and OR by exchange type.
Table 4:
Percent Completeness and Association of Data Exchange Type with Complete Data Elements
| Data Element | Data Transmission Mode | Pct Complete Records | OR (CI)* |
|---|---|---|---|
| Middle Name | Manual | 54.98% | 1 (ref) |
| HL7 | 48.92% | 0.78 (0.77–0.80) | |
| Batch Flat File | 63.95% | 1.45 (1.43–1.47) | |
| Birth Certificate | 81.10% | 3.52 (3.45–3.58) | |
|
| |||
| Address | Manual | 98.44% | 1 (ref) |
| HL7 | 99.94% | 27.78 (21.97–35.13) | |
| Batch Flat File | 99.95% | 30.03 (26.07–34.59) | |
| Birth Certificate | 99.96% | 41.32 (30.52–55.95) | |
|
| |||
| City | Manual | 98.81% | 1 (ref) |
| HL7 | 99.99% | 81.30 (51.68–127.94) | |
| Batch Flat File | 99.99% | 161.58 (113.13–230.78) | |
| Birth Certificate | 99.97% | 36.57 (26.37–50.73) | |
|
| |||
| State | Manual | 99.21% | 1 (ref) |
| HL7 | 99.99% | 59.69 (36.92–96.49) | |
| Batch Flat File | 99.99% | 64.52 (48.62–85.62) | |
| Birth Certificate | 99.96% | 20.68 (15.22–28.11) | |
|
| |||
| Zip Code | Manual | 98.76% | 1 (ref) |
| HL7 | 99.98% | 69.60 (46.08–105.13) | |
| Batch Flat File | 99.98% | 70.17 (55.50–88.71) | |
| Birth Certificate | 99.96% | 31.16 (23.14–41.96) | |
|
| |||
| Phone | Manual | 80.86% | 1 (ref) |
| HL7 | 95.46% | 4.98 (4.83–5.14) | |
| Batch Flat File | 88.22% | 1.77 (1.74–1.81) | |
| Birth Certificate | 88.29% | 1.79 (1.74–1.83) | |
|
| |||
| SSN | Manual | 19.32% | 1 (ref) |
| HL7 | 29.93% | 1.78 (1.75–1.82) | |
| Batch Flat File | 32.95% | 2.05 (2.02–2.09) | |
| Birth Certificate | 9.444% | 0.44 (0.43–0.45) | |
|
| |||
| Medical Organization | Manual | 98.22% | 1 (ref) |
| HL7 | 99.92% | 22.78 (18.28–27.15) | |
| Batch Flat File | 99.43% | 3.15 (2.96–3.35) | |
| Birth Certificate | 96.07% | 0.44 (0.42–0.47) | |
|
| |||
| Facility | Manual | 94.60% | 1 (ref) |
| HL7 | 95.61% | 1.24 (1.20–1.30) | |
| Batch Flat File | 95.51% | 1.21 (1.18–1.25) | |
| Birth Certificate | 93.20% | 0.78 (0.76–0.81) | |
|
| |||
| First Name, Last Name and Birthdate (all types) | 100% | No OR Calculated | |
OR indicates odds ratio, CI indicates 95% confidence interval calculated for a complete data element, test of null hypothesis(regression coefficient equal to zero, Chi-square DF=3) was significant, P <.0001
Total field completeness by record was high, but varied by field and type of record (demographic vs. vaccination records). The mean field completeness measure (number of completed fields/total number of fields) for the demographic records was 90.07%, indicating an average of 11.70 out of 13 fields completed per record. First Name, Last Name and Date of Birth, fields identified in MIROW’s minimum dataset,32 were 100% complete.
Field completeness for vaccination data elements was very high. Most fields (Date of Entry, Date of Service, Immunization Description, and Medical Organization) were 100% complete for all exchange types. CPT Code was more than 99% complete for all exchange types. Facility was 98.80% complete for manual entry records but only 93.58% complete for batch flat file records. Logistic regression to detect an association between exchange type and field completeness showed that HL7 records were 6 times more likely than Manual records to have a complete CPT Code field (95% CI 5.16–7.07). HL7 and batch flat file records were both less likely than Manual records to have a complete Facility field. A report of completeness measures, OR and 95% CI for vaccination fields is shown in Table 5.
Table 5:
Percent completeness of immunization fields – one record per vaccination
| Data Element | Data Exchange Type | Pct Complete Records | OR (CI)* |
|---|---|---|---|
| Date of Entry | All | 100% | ** |
|
| |||
| Date of Service | All | 100% | ** |
|
| |||
| CPT Code | Manual | 99.79% | 1 (ref) |
| HL7 | 99.96% | 6.04 (5.16–7.07) | |
| Batch Flat File | 100% | 485.88 (2.17.98 - >999) | |
|
| |||
| Imm. Desc. | All | 100% | ** |
|
| |||
| Med Org | All | 100% | ** |
|
| |||
| Facility | Manual | 98.80% | 1 (ref) |
| HL7 | 97.03% | 0.18 (0.17–0.18) | |
| Batch Flat File | 93.58% | 0.40 (0.39–0.41) | |
OR indicates odds ratio, CI indicates confidence interval calculated for complete data element, test of null hypothesis (regression coefficient equal to zero, Chi-square DF=2) was significant, P <.0001
No OR calculated
We also examined the vaccination data by number of fields complete and transmission mode. We found no vaccination records in the sample with fewer than 4 completed fields, and 98.60% of manual entry records had all 6 fields complete. Only 93.58% of records entered using batch flat file uploads were 100% complete.
Discussion
Quality checks on data entering the system are standard for all types of data exchange and IIS administrators spend substantial time and effort ensuring the quality of the data in their systems. Data quality checks and de-duplication processes often take place before data are made available to system users. In the system we studied, all incoming records are held as reserve records until de-duplication and other quality rules are applied. These rules determine which records will be used to populate the master record in the live system. It is important to consider these details of data flow as the context for our results. We examined master records, which are, in general, of higher overall quality than reserve records, with fewer duplicate records. The data we analyzed are the data available to IIS users and those granted access to immunization datasets from the State of Washington.
Timeliness
We compared descriptive statistics (Table 1) for the vaccination dataset and the dataset aggregated by visit; the results were similar for the two methods of grouping. Based on the similar results for the totals and within transmission mode, we aggregated data by visit for all subsequent analyses related to timeliness.
Overall, we found that the timeliness of vaccination data was highly variable (See Table 1). However, most data entered manually (88.52%) and most HL7 records (80.40%) fell into the category indicating they were relatively timely, with less than 7 days between date of immunization and date entered into the IIS. Vaccination records that arrived via a batch data transfer had a significantly smaller proportion arriving within a week to the IIS: only 8.43% of batch vaccination records fell into the less than 7 days category.
Our dataset was very large; even when reduced to records aggregated by visit, over 1.2 million records remained. Because of the size of the dataset, it is not surprising that we found a statistically significant association between each type of data exchange and acceptable timeliness measures (timeliness measure ≤30 days vs. >30 days). Although statistical significance does not imply practical significance, the summary data and relative ORs and 95% CIs convey differences that could impact the decision to use data for a particular purpose. For example, those reaching out to parents with reminders for upcoming recommended vaccinations will have more trust in a more timely dataset. Also, epidemiologists considering use of IIS data for outbreak control activities and reportable condition case investigation require a certain level of timeliness in order for the data to be useful. Both the significance test and the raw differences in median timeliness measures point to the need for improvements in batch entry procedures or the conversion of organizations using batch to transition to HL7. Unfortunately, both of these options create more work, at least initially, for IIS administrators. Setting up and testing HL7 field mapping and connections to provider EHRs is a labor intensive process. Although use of flat files for exchanging data also involves mapping, anecdotal reports indicate that the HL7 process may require more time and resources to set up than a traditional batch flat file upload. In addition, many of the quality checks run on data before they move into the production system require manual, human-driven analysis of the data.
Completeness
Our examination of data element completeness includes two types of data: demographic data and vaccination level data. For our analysis, we used the vaccination dataset and not the visit-level dataset. Both demographic data and vaccination data were quite complete. All demographic fields were at least 93% complete except: Middle Name (62.73%), SSN (27.11%), and Phone Number (88.45%); completeness percentages are shown in Table 4. Because not all patients have a middle name, the field legitimately may be empty. Middle name is nonetheless an important field for use in de-duplication processes (29). Social Security Number brings another set of concerns, and it is not surprising that Birth Certificate Data (newborns may not have an SSN assigned at the time Birth Certificate Data is issued) and manual entry (privacy concerns) had low completeness rates for these fields: 9.44% and 19.32%. SSN is not often relied upon in IIS work, but is potentially useful for population level studies where linking to other datasets (birth, death, registries from other states) may be necessary. Similarly, Phone Number presents challenges because it may not be consistent, however, it is useful for record matching and for epidemiologic outbreak control activities, and it can be a way to contact patients or parents for recall and reminder activities. We suspect that it will be of practical significance to those making use of the Phone Number field for outreach activities that the field is almost 5 times more likely to be complete for HL7 records.
Vaccination level data were even more complete than demographic data: on average vaccination fields were 99.79% complete. The only field with a higher proportion of missing values was the Facility field. Levels of completeness differences in the vaccination data, though statistically significant, are likely not practically significant (0.83%); however, the differences we found in completeness of some demographic data elements may be of concern to data consumers. Our earlier investigation of information needs in public health related to immunizations found that concerns about both population completeness and data element completeness may prevent secondary users of IIS data from accessing the data for population analyses and assessments. Although flat-file records from billing systems and Medicaid are sometimes considered a source of data element incompleteness, batch transmission actually had the highest mean completeness for demographic records (90.76%).
Implications
Numerous timeliness, completeness, de-duplication and logic checks take place before data are made available to users. The Data Quality Manager for the IIS recently implemented new business rules resulting in an improvement in the quality of data entering the system.28;29 The increasing use of standards for data storage and transmission may decrease the need for these types of checks, putting more of the burden of data quality assurance on IIS and EHR system managers and developers.
Although the National Immunization Program, in its Minimum Functional Standards for Registries in 2001 included an official recommendation to use HL7 messaging,25 the MU incentives of the HITECH Act may be even more effective in encouraging adoption. Financial incentives and the even stronger encouragement in the form of penalties for non-compliance are likely to significantly increase the number of providers submitting data to IISs using HL7 messaging. If the type of HL7 messaging used most often in 2010 (Version 2) remains the same, we can say with some level of confidence that this could move the timeliness and completeness measures toward the levels we see in these analyses for HL7 messages. If the migration to HL7 messaging comes from currently unenrolled providers, or those currently submitting flat files for import, this will mean an improvement in timeliness, as seen in Table 2. Although our results show that manual entry is more timely than HL7, the details of HL7 are highly dependent on the implementation. Ideally, HL7 messages are be sent in real-time or at least daily.
The quality of data contained in HL7 messages is dependent on the quality and the consistency of source system data. Certified EHRs should offer improvements in these areas and could lead to overall improvements in data element completeness within an IIS, but this improvement would be bolstered by increased levels of specification in the certification criteria with respect to fields required by an IIS.
Based on our analysis, the migration of providers to HL7 connections with IISs will likely not have an immediate or significant impact on the data element completeness of IIS data in systems similar to the Washington State IIS. Depending on the frequency of the HL7 messaging, timeliness however, could improve significantly. The migration of providers currently sending billing batch files, to use of HL7 messaging, could decrease the proportion of records transmitted more than 30 days after vaccine administration (Table 2). If EHR-IIS connections make use of near-real time HL7 messaging for communication, the overall timeliness could improve even more. Near-real time HL7 connections offer the potential to improve data quality. Real-time bi-directional interfaces provide advantages to providers at the time of vaccine administration by allowing the provider’s system to display or import IIS data, which could contain records from other providers, therefore rendering a more complete picture of the individual’s current vaccine status. Overall, the potential and likely benefits of migration to HL7 interfaces, especially when many of the existing batch interfaces are migrated, could have a positive impact on data quality.
Limitations
The most significant limitation of this study was that we were not able to examine two highly relevant components of data quality: vaccination record coverage completeness and accuracy, both of which would ideally be measured using chart review and interview methods. Additionally, conclusions made from our analysis about data quality must be interpreted only with respect to this specific IIS implementation. Our study examined data in the production version of the Washington IIS which includes master records only. The IIS also maintains reserve records that may include duplicates or other errors, which have been eliminated by the numerous data quality and logic checks run on the data before the reserve record is moved to a master record. An analysis including records in the reserve dataset may find different associations between method of information exchange and timeliness and completeness measures.
We also limited our analysis to records with a “Service Date” in 2010. The distribution of data exchange types used by providers and other organizations and those exchange types accepted and encouraged by IISs administrators is changing quickly. Inclusion of additional years of data may be advantageous in drawing conclusions about the quality of data in the system.
An additional limitation of our analysis is the lack of information about the source of the data. In the case of batch flat file records, it is likely to be important to differentiate between Medicaid, Billing and EHR data. We were unable to distinguish between these sources with the available dataset.
Conclusions
Although data quality is an important characteristic of a data source for providers and those operating immunization programs, it is also important for ensuring that IIS data are a useful and trusted source of population level data for public health practitioners and researchers. Our work takes steps to describe the timeliness and data element completeness of data in Washington’s IIS. In doing so, we have attempted to provide information that may be of use for persons or organizations considering the use of IIS data or data exchange with an IIS. Though the transition to HL7 messaging will be a challenging road for many immunization programs and providers, we believe there is demonstrated evidence that while the transition may not immediately impact completeness in systems with a similar demographic makeup as the Washington State IIS, it could lead to improvements in timeliness.
IISs are one of the most mature public health information systems used in the United States. As Hinman and Ross posited in 2010, “registries provide a model for how public health information systems can support clinical decision making, meet public health demands for assessment and assurance, improve quality of care and contain costs”.34 The systems’ maturity, the experience that public health and providers have with them, their interfaces, and the resulting population data sources, allow them to serve as exemplars for future connections between the two entities. We hope that in a similar way this work can be useful beyond the realm of Immunization Information Systems, to inform and direct the development of other types of electronic provider-public health connections for purposes of assessment, assurance, and ultimately to safeguard the health of the population.
Acknowledgments
This project was funded in part by the National Library of Medicine Medical Informatics Training Grant T15 LM007442-07. The authors would like to thank Sherry Riddick at Public Health Seattle & King County for her guidance, support, and feedback on this project.
References
- 1.Immunization registry strategic plan, 2002–2007. Atlanta, GA: CDC; 2005. www.cdc.gov/vaccines/programs/iis/activities/downloads/strat-plan.pdf [Retrieved 08/18/2011] [Google Scholar]
- 2.Canavan BC, Kurilo M, Moss T, McLaren R, Berry K, Thomas C, Rasulnia B, Kelly J, Urquhart G. Immunization information systems progress - United States, 2005. MMWR Morb Mortal Wkly Rep. 2006;55(49):1327–9. [PubMed] [Google Scholar]
- 3.Boom JA, Dragsbaek AC, Nelson CS. The success of an immunization information system in the wake of Hurricane Katrina. Pediatrics. 2007;119(6):1213–17. doi: 10.1542/peds.2006-3251. [DOI] [PubMed] [Google Scholar]
- 4.Guide to Community Preventive Services . Universally recommended vaccinations: immunization information systems. Atlanta GA: CDC; 2010. www.thecommunityguide.org/vaccines/universally/imminfosystems.html [Retrieved 07/15/2011] [Google Scholar]
- 5.US Department of Health and Human Services . Healthy People 2020 Objectives. Washington DC: US DHHS; 2010. www.healthypeople.gov/2020/topicsobjectives2020/pdfs/Immunization.pdf [Retrieved 07/16/2011] [Google Scholar]
- 6.CDC Progress in Immunization Information Systems --- United States, 2009. MMWR Morb Mortal Wkly Rep. 2011;60(01):10–2. [PubMed] [Google Scholar]
- 7.Goldstein ND, Maiese BA. A Brief Review of Vaccination Coverage in Immunization Registries. Online J Public Health Inform. 2011;3(1):1–7. doi: 10.5210/ojphi.v3i1.3385. [DOI] [PMC free article] [PubMed] [Google Scholar]
- 8.Arts DG, De Keizer NF, Scheffer GJ. Defining and improving data quality in medical registries: a literature review, case study, and generic framework. J Am Med Inform Assoc. 2002;9(6):600–11. doi: 10.1197/jamia.M1087. [DOI] [PMC free article] [PubMed] [Google Scholar]
- 9.English LP. Total Information Quality Management: a complete methodology for IQ management. DM Review. 2003;9(03) online. www.information-management.com/issues/20030901/7320-1.html [Retrieved 03/13/2012] [Google Scholar]
- 10.Power D. Data quality and MDM: a data quality mindset increases MDM program success. Inform Manage. 2009;19(2):40–1. [Google Scholar]
- 11.Watts S, Shankaranarayanan G, Even A. Data quality assessment in context: A cognitive perspective. Decision Support Syst. 2009;48(1):202–11. [Google Scholar]
- 12.Case DO. Looking for Information: A Survey of Research on Information Seeking, Needs, and Behavior. 2nd ed. Boston: Elsevier/Academic Press; 2007. [Google Scholar]
- 13.Lima CR, Schramm JM, Coeli CM, da Silva ME. Review of data quality dimensions and applied methods in the evaluation of health information systems. Cad Saúde Pública. 2009;25(10):2095–109. doi: 10.1590/s0102-311x2009001000002. [DOI] [PubMed] [Google Scholar]
- 14.Wand Y, Wang RY. Anchoring data quality dimensions in ontological foundations. Comm ACM. 1996;39(11):86–95. [Google Scholar]
- 15.Landry CF. Work roles, tasks, and the information behavior of dentists. J Am Soc Inform Sci Techn. 2006;57(14):1896–1908. [Google Scholar]
- 16.Leckie GJ, Pettigrew KE, Sylvain C. Modeling the information seeking of professionals: A general model derived from research on engineers, health care professionals and lawyers. Library Qtrly. 1996;66:161–93. [Google Scholar]
- 17.Turner AM, Petrochilos D, Nelson DE, Allen E, Liddy ED. Access and use of the Internet for health information seeking: a survey of local public health professionals in the northwest. J Public Health Manag Pract. 2009;15(1):67–9. doi: 10.1097/01.PHH.0000342946.33456.d9. [DOI] [PubMed] [Google Scholar]
- 18.Covell DG, Uman GC, Manning PR. Information needs in office practice: are they being met? Ann Intern Med. 1985;103(4):596–9. doi: 10.7326/0003-4819-103-4-596. [DOI] [PubMed] [Google Scholar]
- 19.Revere D, Turner AM, Madhavan A, Rambo N, Bugni PF, Kimball A, Fuller SS. Understanding the information needs of public health practitioners: a literature review to inform design of an interactive digital knowledge management system. J Biomed Inform. 2007;40(4):410–21. doi: 10.1016/j.jbi.2006.12.008. [DOI] [PubMed] [Google Scholar]
- 20.Khare M, Piccinino L, Barker LE, Linkins RW. Assessment of immunization registry databases as supplemental sources of data to improve ascertainment of vaccination coverage estimates in the national immunization survey. Arch Pediatr Adolesc Med. 2006;160(8):838–42. doi: 10.1001/archpedi.160.8.838. [DOI] [PubMed] [Google Scholar]
- 21.Kolasa MS, Lutz JP, Cofsky A, Jones T. Provider chart audits and outreach to parents: impact in improving childhood immunization coverage and immunization information system completeness. J Public Health Manag Pract. 2009;15(6):459–63. doi: 10.1097/PHH.0b013e3181abbee6. [DOI] [PubMed] [Google Scholar]
- 22.White KE, Anderson J, Stanley M, Ehresmann K. Evaluating hepatitis B universal birth dose vaccination at Minnesota birthing hospitals by utilizing immunization information systems, birth certificates, and chart reviews, 2007–2008. J Public Health Manag Pract. 2009;15(6):464–70. doi: 10.1097/PHH.0b013e3181aab5e0. [DOI] [PubMed] [Google Scholar]
- 23.Zimmerman LA, Bartlett DL, Enger KS, Gosney K, Williams WG. Influenza vaccination coverage: findings from immunization information systems. BMC Pediatr. 2007;7:28. doi: 10.1186/1471-2431-7-28. [DOI] [PMC free article] [PubMed] [Google Scholar]
- 24.CDC Progress in immunization information systems - United States, 2008. MMWR Morb Mortal Wkly Rep. 2010;59(5):133–5. [PubMed] [Google Scholar]
- 25.CDC . IIS: 2001 Minimum Functional Standards for Registries. Atlanta, GA: CDC; 2011. www.cdc.gov/vaccines/programs/iis/stds/min-funct-std-2001.htm [Retrieved 08/18/2011] [Google Scholar]
- 26.“Medicare and Medicaid Programs; Electronic Health Record Incentive Program: Final Rule” 75 Federal Register 144 (28 July 2010) pp. 44314–588. 42 CFR Parts 412, 413, 422 et al. GPO Access: edocket.access.gpo.gov/2010/pdf/2010-17207.pdf. [PubMed]
- 27.National Vaccine Advisory Committee . Immunization Information systems: National Vaccine Advisory Committee (NVAC) Progress Report 2007;38. www.hhs.gov/nvpo/nvac/NVACIISReport20070911.doc [Retrieved 08/16/2011] [DOI] [PubMed] [Google Scholar]
- 28.Williams W, Lowery NE, Lyalin D, Lambrecht N, Riddick S, Sutliff C, Papadouka V. Development and Utilization of Best Practice Operational Guidelines for Immunization Information Systems. J Publ Health Manag Pract. 2011;17(5):449–56. doi: 10.1097/PHH.0b013e31821138fe. [DOI] [PubMed] [Google Scholar]
- 29.Riddick S, Warren J. Data Quality Improvement: An Example of Using Consensus-Based Best Practice Guidelines to Improve IIS Operations. 43rd National Immunization Conference; 2009. cdc.confex.com/cdc/nic2009/recordingredirect.cgi/id/4532 [Retrieved 08/28/2011] [Google Scholar]
- 30.Baker B. CHILD profile: an immunization registry and more--a new approach to tracking and surveillance. Children’s Health, Immunization, Linkages and Development. Vaccine. 1998;16(18):v–vi. doi: 10.1016/s0264-410x(97)00187-4. [DOI] [PubMed] [Google Scholar]
- 31.CDC IISAR Data Participation Rates. 2009. www.cdc.gov/vaccines/programs/iis/rates/data-rates.htm [Retrieved 07/16/2011]
- 32.AIRA Modeling of Immunization Registry Operations Working (MIROW) Group, editor. Data Quality Assurance in Immunization Information Systems: Incoming Data. American Immunization Registry Association (AIRA) 2008. p. 100. www.immregistries.org/pdf/AIRA_MIROW_Chap3_DQA_02112008pdf [Retrieved 01/08/2011]
- 33.Freeman V a, DeFriese GH. The challenge and potential of childhood immunization registries. Annu Rev Public Health. 2003;24(20):227–46. doi: 10.1146/annurev.publhealth.24.100901.140831. [DOI] [PubMed] [Google Scholar]
- 34.Hinman AR, Ross DA. Immunization registries can be building blocks for national health information systems. Health Aff. 2010;29:676–82. doi: 10.1377/hlthaff.2007.0594. [DOI] [PubMed] [Google Scholar]
- 35.Saarlas KN, Edwards K, Wild E, Richmond P. Developing performance measures for immunization registries. J Publ Health Manag Pract. 2003;9(1):47–57. doi: 10.1097/00124784-200301000-00007. [DOI] [PubMed] [Google Scholar]
- 36.SAS 9.2 for Windows. Cary, NC: SAS Institute; 2011. [Google Scholar]