Abstract
We consider the task of predicting which patients are most at risk for post-hospitalization venothromboembolism (VTE) using information automatically elicited from an EHR. Given a set of cases and controls, we use machine-learning methods to induce models for making these predictions. Our empirical evaluation of this approach offers a number of interesting and important conclusions. We identify several risk factors for VTE that were not previously recognized. We show that machine-learning methods are able to induce models that identify high-risk patients with accuracy that exceeds previously developed scoring models for VTE. Additionally, we show that, even without having prior knowledge about relevant risk factors, we are able to learn accurate models for this task.
Introduction
The proliferation of electronic health records (EHRs) is providing unprecedented opportunities to analyze the medical histories of large patient populations in order to improve clinical practice in areas such as prognosis, adverse event detection, and risk assessment. The promise of this type of analysis is that by considering associations between patient histories recorded in the EHR and clinical outcomes, we can detect previously unknown risk factors, identify important interactions among the variables considered, and learn decision rules that can be applied in clinical settings.
Here we consider the task of predicting which patients are most at risk for post-hospitalization1,2 venothromboembolism (VTE). Using representations of patient histories that are automatically elicited from an EHR, we apply machine-learning methods to induce models that classify patients according to their risk of VTE. Our models consider variables representing demographics, vital signs, diagnoses, procedures, medications, and several relevant genetic markers.
The contributions of this work are severalfold. First, we show that we are able to identify high-risk patients with high accuracy using patient representations that are automatically extracted from EHRs. Second, we demonstrate that our learned models exceed the predictive accuracy of previously devised scoring systems for VTE. Third, we show that, even without having advance information about relevant risk factors, we are able to learn accurate models for this task. Fourth, we identify a number of risk factors that were not previously used in VTE risk assessments or discussed in the relevant literature.
Background
Venothromboembolism, including deep vein thrombosis (DVT) and pulmonary embolism (PE), is a significant health care problem causing considerable morbidity, mortality, and health-care expenditures3. VTE is estimated to affect 30 million persons in the USA with an annual incidence of 1.17 per 1,0004. According to the 2008 U.S. Surgeon General’s Call to Action, the problem is often unrecognized and the actual incidence rate is likely closer to 2 per 1,0005. Hospitalization for an acute medical illness is associated with over a 10-fold increase in risk of VTE2,6. The seriousness of these conditions is underscored by an estimated hospital mortality rate of 10% attributed to pulmonary embolism7 and an annual mortality rate exceeding that attributed to prostate and breast cancer combined. VTE also presents a strong economic burden due to hospitalization costs and a high rate of hospital readmission3.
Current medical practice involves administration of prophylactic anticoagulation with subcutaneous heparin (unfractionated or low-molecular weight) to hospitalized patients identified at moderate to high-risk for developing VTE. However, prophylactic anticoagulation is often discontinued upon discharge by providers, without regard for the continuing risks of VTE in post-discharge settings.
Recent research has highlighted the significance of post-hospitalization management to avoid VTE. A 1992 retrospective study utilizing data from the U.S. claims database revealed that of 92,162 hospitalized medical patients followed over 90 days from their hospital admission date 1,468 (1.59%) developed a VTE with 18% occurring after hospital discharge1. These data suggest that significant risk of VTE persists after hospital discharge.
Since prophylactic anticoagulation can help diminish the risk of post-hospitalization VTE, there is a substantial benefit to being able to predict which patients are most at risk. Although many well-known risk factors have been identified, minimal progress has been made in decreasing the mortality and morbidity of this condition.
A number of studies have investigated the task of inferring risk-assessment models from EHR data. These studies have considered predicting risk for outcomes such as clinical deterioration8, mortality from type 2 diabetes9, heart failure10, virologic failure11, hospital-acquired infections12, and pancreatic cancer13. A number of recent studies have also considered the problem of using automated methods to identify patients who are at high risk for VTE14,15,16. However, to our knowledge, the present study is the first to address the coupled tasks of learning a model and predicting VTE risk directly from EHR-extracted variables.
Methods
Patient population:
The patients we consider in this study are drawn from the Marshfield Clinic Research Foundation’s Personalized Medicine Research Project (PMRP) cohort. Participants were selected for inclusion in this cohort if they were over 18 years of age and lived in one of 19 zip codes surrounding the city of Marshfield, Wisconsin, and if at least one member of the household had received care at the Marshfield Clinic within the previous three years. Over 90% of this population receives its all of its healthcare from the Marshfield Clinic System. These individuals agreed to provide blood for DNA, plasma, and serum collection as well as use of their dynamic medical record. Over 60% of the participants over the age of 20 have 20 or more years of retrospective clinical data from the Marshfield Clinic system available for use. For those over the age of 60, the percentage of individuals with retrospective clinical data available increases to 80%. Within the PMRP cohort, about 5,000 individuals over the age of 40 have been genotyped with an Illumina 660 GWAS chip through the Electronic Medical Records and Genomic (eMERGE) network as part of a National Institute of Health initiative eMERGE project.
Since individuals in this cohort receive care within the Marshfield Clinic system, a wide variety of health information characterizing them is available electronically. The Marshfield Clinic uses a fully implemented EHR with an integrated data collection and validation system for medical information. Data is captured from the Cattails Software Suite via an in-house electronic medical record. This is a highly integrated system automating the financial, practice management, clinical, and real time decision-support processes of the clinic. The EHR has been used for over two decades by clinical staff with 100% physician usage for patient care since 1994. The EHR provides real-time access to a patient’s medical history and health-related events such as length of hospital stay. Most of the “coded” data captured in the EHR is transferred daily to the clinic’s data warehouse where it is cleansed, standardized, and integrated with other related patient information. The data warehouse environment contains diagnostic, laboratory, procedure, practice-management, vital-sign, insurance, medication-inventory, and prescribing data on all patients. To expand medication history, the clinic has applied natural language processing methods to more than 27 million clinically transcribed documents to extract medication-related information dating back to the early 1990s.
Case and control selection:
The subjects selected for our study meet the following criteria: they had enrolled in the PMRP cohort between January 1992 and April 2011, were age 40 and over, and had been hospitalized and subsequently experienced a VTE within 90 days post hospitalization. VTE codes were identified in the data warehouse based on the following ICD-9 codes: 415.1, 415.11, 415.19, 451.1, 451.11, 451.2, 451.81, 451.83, 451.89, 451.9, 452.0 and 453.0 – 453.9. These candidate cases were then manually adjudicated to ensure that they actually did experience a VTE within the 90-day window. Controls were matched to cases such that the fraction of patients who were hospitalized for surgical and medical procedures is the same in both groups. We excluded subjects who were pregnant or in their postpartum period. Within the eMERGE cohort, we identified a total of 720 subjects (144 cases and 576 controls) who had genetic information available on the DNA variants of interest.
Clinical data:
The clinical data we use consists of six types of records: demographics, diagnoses, labs, medications, procedures, and vitals. The demographic data consists of each patient’s gender, age at hospitalization, and age at VTE (if applicable). Each diagnosis a patient has received over the course of their enrollment in the PMRP cohort is indicated by a record listing the corresponding ICD-9 code, age at diagnosis, and other relevant data. The diagnosis records cover a wide range of information, including not only conventional diagnoses such as pneumonia or cancer, but also smoking habits and family histories of various ailments. Each lab-test record represents the patient’s age at the time of the test, an internal Marshfield-specific code indicating the category to which the test belongs, and a field stating whether the lab result is normal, abnormally high, or abnormally low. A medication record is created each time a patient starts or stops taking a medication. Each of these medication records also indicates the dosage and contains two internal Marshfield-specific codes indicating, at different levels of specificity, the category to which the medication belongs. Each procedure record indicates the patient’s age at the time of the procedure and the procedure’s CPT-4 code. The vitals records describe all of a patient’s measured vitals, including blood pressure, height and weight.
Genetic data:
We selected 32 specific single nucleotide polymorphisms (SNPs) that had been previously associated with VTE, either as risk factors or protective factors, and extracted our patients’ genotypes for each of these SNPs from the eMERGE data set.
Representations for machine learning:
We consider learning predictive models using two different sets of clinical variables. The first set, which we refer to as the curated representation, includes only a set of 119 variables based on 78 risk factors for VTE or thrombophilia that were reported in the prior literature. The second set of variables, which we refer to as the unabridged representation, contains virtually all of the variables that we can extract from our patient records.
In a given representation, we use a vector of binary variables to characterize each patient’s history. Most events (diagnosis, lab, medication, procedure or vitals measurement) of interest are represented by two variables in a patient’s vector – one indicating whether or not the patient experienced the event at any time before the relevant hospitalization, and the other indicating whether or not the event occurred recently (generally, within six months of the relevant hospitalization). For some of our curated variables, we have specific knowledge about the time-sensitivity of the event and we adjust the time window of the second variable accordingly (e.g. angioplasty causes the highest risk within three months). When instantiating the vector for a given patient, all variables represent events that occurred before the relevant hospitalization of the patient.
To extract patient vectors for our unabridged representation, we use the following process. As mentioned above, every record in the data warehouse contains some sort of code, whether it is from ICD-9, CPT-4 or a Marshfield-specific vocabulary. We consider every code present our patient histories as a potential pair of variables. However, we prune from the representation any variable that occurs with very low frequency (in fewer than 10 patients’ histories) or very high frequency (in all but 10 patients’ histories). After this frequency pruning, we end up with 3330 unique variables in our unabridged representation.
To extract patient vectors for the curated variable set, we manually identify the set of codes that correspond to each risk factor in our curated list. Many of these risk factors correspond to multiple codes within one type of record (e.g. a risk factor describing a diagnosis may map to multiple ICD-9 codes) or to multiple codes in different types of records. For example, oral contraceptive use can appear in a medications record, or it can be indicated by a specific ICD-9 code in a diagnosis record. Using this procedure, our 78 risk factors map to a set of 128 variables, which is then reduced to 119 variables after frequency pruning.
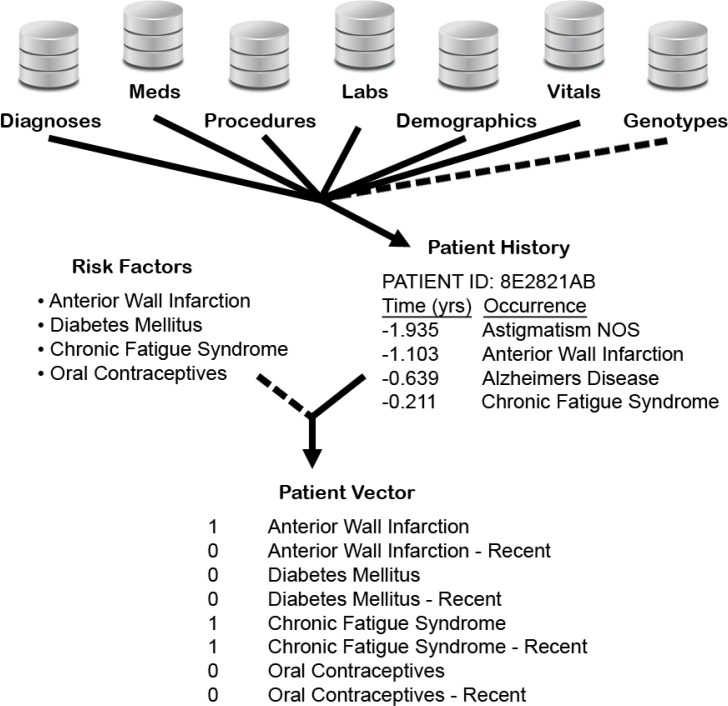
We represent our genetic data using three binary variables for each SNP of interest. For a given patient, these variables represent the mutually exclusive cases of the patient being heterozygous at the SNP, homozygous for the minor allele, or homozygous for the major allele. Altogether, our experiments evaluate four different variable sets: we consider using the curated and unabridged variable sets alone, and in conjunction with the set of genetic variables. Figure 1 provides a graphical overview of the process through which we generate patient vectors.
Figure 1.
A graphical overview of the data-extraction process. From the data warehouse, which contains six types of records, and the genetic data, we extract histories for each patient. We represent each patient history using a vector of binary variables. Pairs of variables are used to represent recent and not-necessarily-recent diagnoses, procedures, etc. We vary the representations considered by optionally (i) using a set of curated risk factors to limit the variables included in each patient vector, and (ii) adding the variables that represent the genetic profile of each patient.
Single variable analysis:
The first analysis we conduct is to discern which individual variables, if any, have a significant influence on VTE risk. We assess this in two ways. First, for each variable we compute the Kaplan-Meier curve (percent survival against time) for those patients who have the variable set to 1, and we compare these curves to the survival curve of our whole cohort. Here, “survival” means not having a VTE post-hospitalization. We quantitatively compare a pair of curves using a log-rank test and we compute a p-value for each variable where the null hypothesis is that the survival curve for the selected patient subset is no different than the curve for the entire cohort. To adjust for the large number of multiple comparisons, we perform the Holm-Bonferroni correction to determine an adjusted p-value for each variable. A limitation of using survival curves in this way is that they do not make readily apparent the fraction of cases covered by a given variable. Therefore, we also measure the predictive accuracy of each variable by computing its precision and recall. In this context, precision is the fraction of patients having a given variable set to 1 that are cases (i.e. experienced a post-hospitalization VTE), whereas recall (sensitivity) is the fraction of cases that have the given variable set to 1. More formally, precision is defined as P = TP / (TP + FP), and recall is defined as R = TP / (TP + FN), where TP indicates a true positive (a case that is predicted to be a case), FP indicates a false positive (a control predicted to be a case), and FN denotes a false negative (a case predicted to be a control).
Machine-learning analysis:
The second type of analysis we do is to apply machine-learning methods to our data set in order to determine if there are functions of multiple variables that have more predictive value than individual variables alone. With this goal in mind, we run several standard machine-learning algorithms on our different variable representations, using the Weka machine learning toolkit17. The primary algorithms we use are naïve Bayes, k-nearest neighbor (k-NN) (with filtered variables), support vector machine (SVM), C4.5, and random forest (using REPTree, a form of regression tree).
Additionally, we evaluated several ensemble learning methods. We used bagging and boosting in conjunction with several of the best-performing learning algorithms, and we evaluated a stacking approach in which we considered the average and the sum of the confidence scores given by models learned using a variety of algorithms. However, none of these ensemble approaches resulted in significantly improved predictive accuracy, and we do not report further results here.
We use a 10-fold cross-validation methodology to evaluate the predictive accuracy of the models induced by the machine-learning methods. After pooling the test-set predictions from all 10 iterations, we create both survival and precision-recall curves. Survival curves, which are more commonly used in clinical applications, have the advantage of showing the extent to which a predictor is able to isolate the patients at highest risk. In our application, however, the 90-day post-hospitalization window we consider is probably too short to differentiate cases according to their degree of risk at the time of their release from the hospital. Moreover, there are two limitations of survival curves for this type of application. First, they do not make apparent the level of recall (sensitivity) of a predictor. Second, a survival curve can characterize a fixed decision rule, but not how predictive accuracy varies as a threshold on the confidence of the model making the predictions is varied. Therefore, we also evaluate our models by constructing precision-recall curves, which portray the accuracy of the models at all possible confidence thresholds. The survival curves that can be generated for a learned model look different depending on the confidence threshold chosen to classify patients. To standardize our survival curves for comparison, we generate them by choosing thresholds that control recall at 50%.
We compare the predictive accuracy of our learned models to two existing risk-prediction questionnaires. One of these questionnaires was developed by Sanofi18, and one developed by the University of Chicago19. These risk assessments, which we note were not designed for the specific context of predicting post-hospitalization VTE, operate by assigning point values to a number of risk factors. The sum of the points for a given patient represents the predicted magnitude of VTE risk. We implement these questionnaires as automated processes by mapping the indicated risk factors to specific codes in the clinical records, as we do with our curated variable set.
Results
Assessing the predictive value of individual variables:
The first question we consider is whether there are previously unrecognized risk factors that are highly predictive of VTE occurrence. We address this question by measuring the predictive accuracy of every variable in our unabridged representation. This assessment of predictive accuracy is done using two methodologies, as discussed previously. First, we use a log-rank test to compare the Kaplan-Meier curves for single-variable predictors against the curve for the entire patient cohort. We compute adjusted p-values (via the Holm-Bonferroni method) to determine the significance of the differences between these curves. Second, we compute precision and recall of the single-variable predictors.
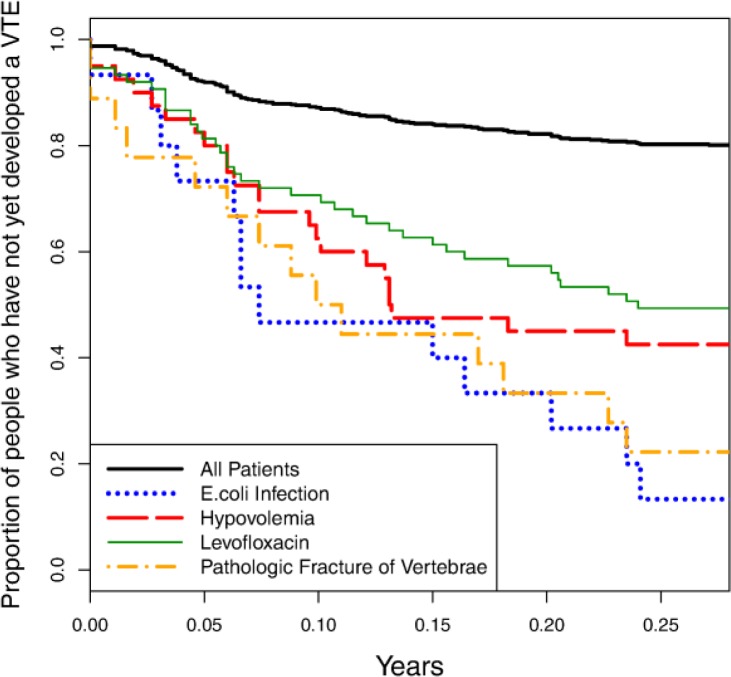
This analysis identifies 339 variables that have adjusted p-values < 0.01. Figure 2 shows the survival curves for four of these significant variables as compared to the survival curve for the entire patient cohort. Table 1 lists the precision and recall values for these variables and several additional ones, along with their adjusted p-values. These results indicate that there are a number of previously unrecognized risk factors that can be identified by analyzing patient histories elicited from EHRs.
Figure 2.
Survival curves for four relevant individual variables: E.coli infection, hypovolemia, levofloxacin use, and pathologic fracture of vertebrae. The solid curve shown at the top of the figure represents the survival curve for the entire patient cohort.
Table 1.
Precision, recall, and adjusted p-values for several relevant variables.
| Category | Risk Factor | Precision | Recall | Adjustedp-value |
|---|---|---|---|---|
| Low Blood Volume | Furosemide | 0.515 | 0.243 | 2.0999×10⁻⁹ |
| Hypovolemia | 0.575 | 0.160 | 3.0188×10⁻⁸ | |
| Hypo-osmolarity | 0.688 | 0.153 | 2.9348×10⁻¹² | |
| Posthemorrhagic Anemia | 0.600 | 0.146 | 3.0155×10⁻⁷ | |
| Acute Renal Failure | 0.824 | 0.097 | 1.3079×10⁻⁹ | |
| Infection | E.Coli Infection | 0.867 | 0.090 | 4.5499×10⁻¹¹ |
| Levofloxacin | 0.507 | 0.264 | 2.1155×10⁻¹⁰ | |
| Cephalexin | 0.441 | 0.313 | 2.9286×10⁻⁸ | |
| Inflammation | High Alpha-1 Globulin Count | 0.909 | 0.069 | 6.5975×10⁻⁸ |
| Angina Pectoris | 0.430 | 0.299 | 1.7934×10⁻⁷ | |
| Immobilization | Pathologic Fracture of Vertebrae | 0.778 | 0.097 | 4.8275×710−10 |
| Malnutrition | Protein Caloric Malnutrition | 1.000 | 0.083 | <2.2204×10⁻¹⁶ |
Many of the significant variables can be grouped into several distinct categories: low blood volume, infection, inflammation, immobilization, and malnutrition. The use of diuretics (e.g. furosemide) and hypovolemia may be markers for the treatment of an underlying volume overload state, such as that found in patients with congestive heart failure, liver failure or nephrotic syndrome. Hypo-osmolarity is often ascribed to hypotonic state seen in patients with hyponatremia (hypotonic hyponatremia). Hypo-osmolarity with hypovolemia is most commonly caused by diuretics. Anemia caused by acute blood loss (hemorrhage) may be another potential cause for hypovolemia. Other predictive variables for VTE include E. coli infection, and the antibiotics levofloxacin and cephalexin, which indicate treatment for an underlying infection. This finding is in accord with a recent study that found that infection was the most common exposure in the 90-day period before hospitalization for VTE20. Increased alpha-1 globulin protein may be indicative of acute or chronic inflammation. Although non-specific, acute or chronic inflammation caused by infection, malignancy or other conditions is associated with VTE. We also found that the presence of acute renal failure (ARF) and pathologic fracture were predictive of VTE. ARF can be caused by a number of conditions including hypovolemia due to diuretic use as well as infection, inflammation, or connective tissue disease. The presence of pathologic fracture contributing to VTE may be due to the underlying medical condition (e.g. malignancy) or related to bed rest and immobilization caused by acute pain. Immobilization is a well-known factor leading to venous stasis and increased risk of venous thrombosis especially of the lower extremities.
Assessing the predictive value of learned models:
Although there are numerous variables that have notable predictive value, the recall of these variables is generally quite low, as indicated in Table 1. Using machine-learning methods, however, we can learn models that combine evidence from numerous variables. To assess the value of representing VTE risk as a function of multiple variables, we evaluate models learned by a set of standard machine-learning algorithms, representing five different classes of methods – SVM, k-nearest neighbor, C4.5 decision tree induction, naïve Bayes, and random forest.
Our C4.5 trees and naïve Bayes classifiers are learned using the default Weka parameters. The k parameter for k-NN is selected using internal cross-validation (cross validation within each training set) with the maximum k=20, and the variables are filtered using correlation-based feature subset selection21. Our random forest models use default parameters, except for the number of trees generated, which is set to 100. The SVMs (learned with LibSVM22) use a radial basis function kernel, and the parameters γ and C are chosen for each fold using a grid search (γ from 0.005 to 0.1, step size 0.005, and C from 2.5 to 50, step size 2.5) using internal cross-validation within each set.
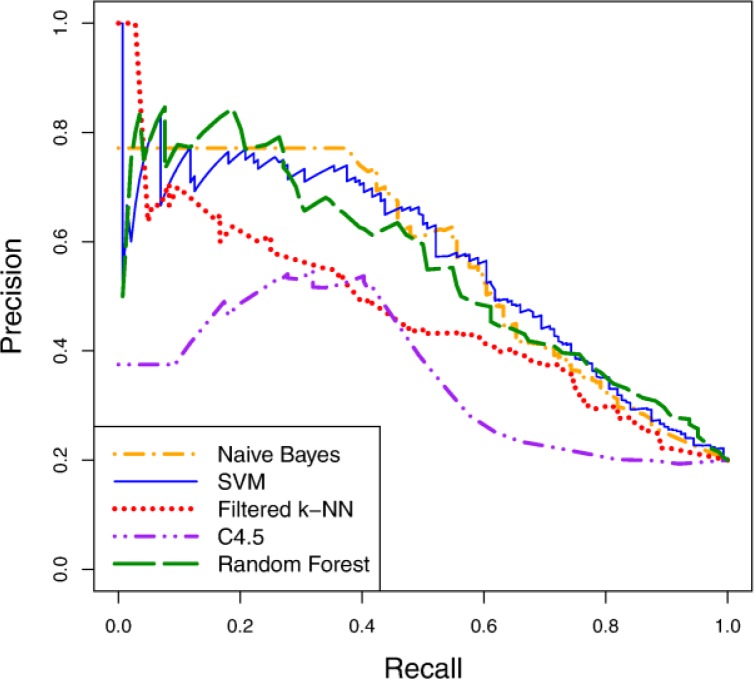
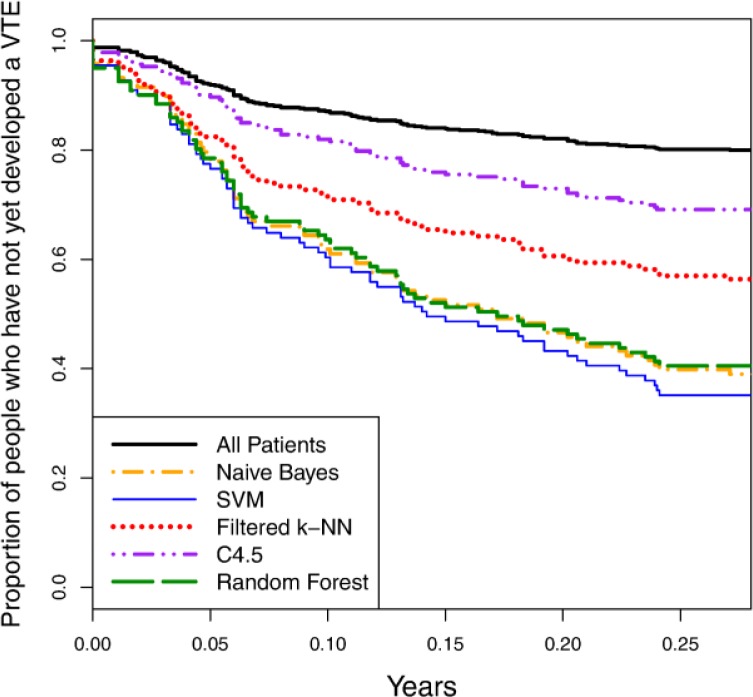
Figure 3 shows precision-recall curves for the five learning algorithms using the curated variable representation. Figure 4 depicts survival curves for the same algorithms and variable representation, along with the survival curve for the entire patient cohort. As both figures indicate, the predictive accuracy of the learned models is notably better than random guessing (i.e. since 20% of our patient cohort consists of cases, a predictor with random performance would be expected to have 20% precision at any level of recall). Some learning algorithms learn significantly more accurate models than others for this task, however. Naïve Bayes, random forest and SVM are among the best learners in this experiment and demonstrate comparable levels of accuracy. Moreover, comparing the precision-recall values from these curves to those reported in Table 1, we conclude that we can attain predictors with notably higher accuracy than our best single-variable predictors by learning models that incorporate multiple variables.
Figure 3.
Precision-recall curves for learned models on the curated representation.
Figure 4.
Survival curves for learned models on the curated representation.
Assessing the value of a curated variable set:
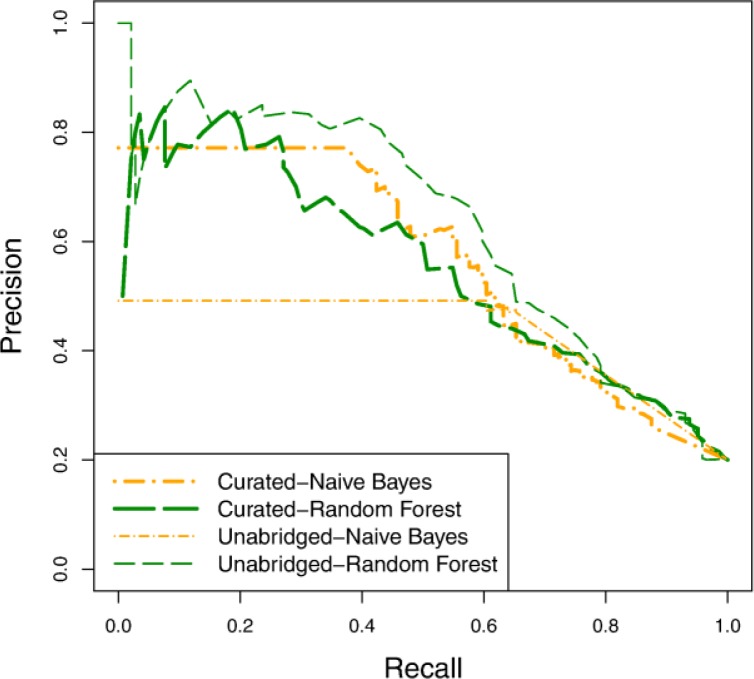
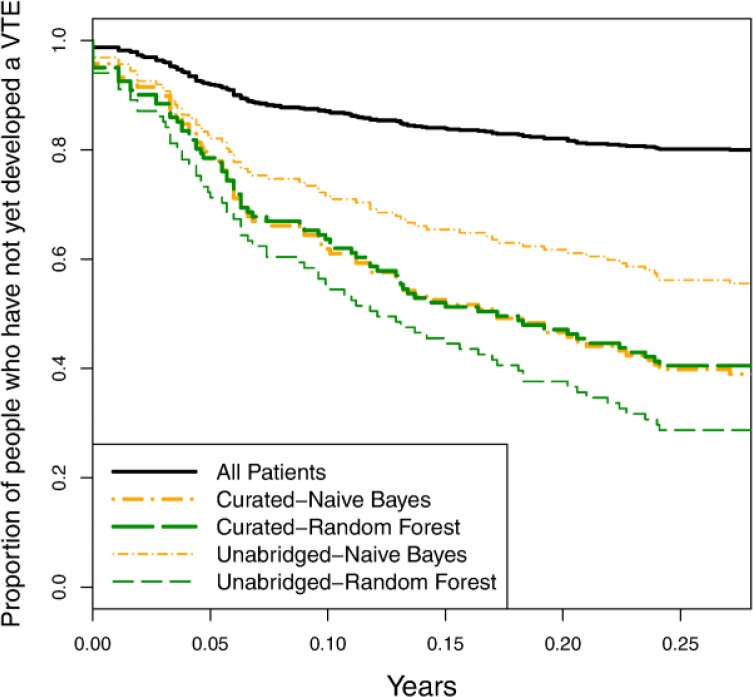
To determine how important it is to have a curated variable set, we compare the predictive accuracy of models learned using the curated and unabridged representations. Figure 5 and Figure 6 show the precision-recall and survival curves, respectively, for models learned using naïve Bayes and random forest. The accuracy of the naïve Bayes is markedly worse with the unabridged representation than with the curated representation. This is not surprising given that naïve Bayes is generally not robust when given a large number of highly dependent variables. The random forest models, on the other hand, are more accurate with the unabridged representation. Similarly the SVM models (not shown) are also more accurate with the unabridged representation. From these results, we can draw two important conclusions. First, there appear to be important, additional risk factors represented in the clinical records that were not included in our curated list of risk factors. Earlier in this section we discussed the discovery of additional risk factors (as highlighted in Figure 2 and Table 1), but the present result demonstrates that these additional risk factors are not merely redundant with previously identified ones. A second conclusion we can make is that, even when task-specific background knowledge is not provided, it is possible to induce accurate predictive models from EHR records.
Figure 5.
Precision-recall curves comparing models learned using the curated variable set and the unabridged variable set.
Figure 6.
Survival curves comparing models learned using the curated variable set and the unabridged variable set.
Assessing the predictive value of the genetic variables:
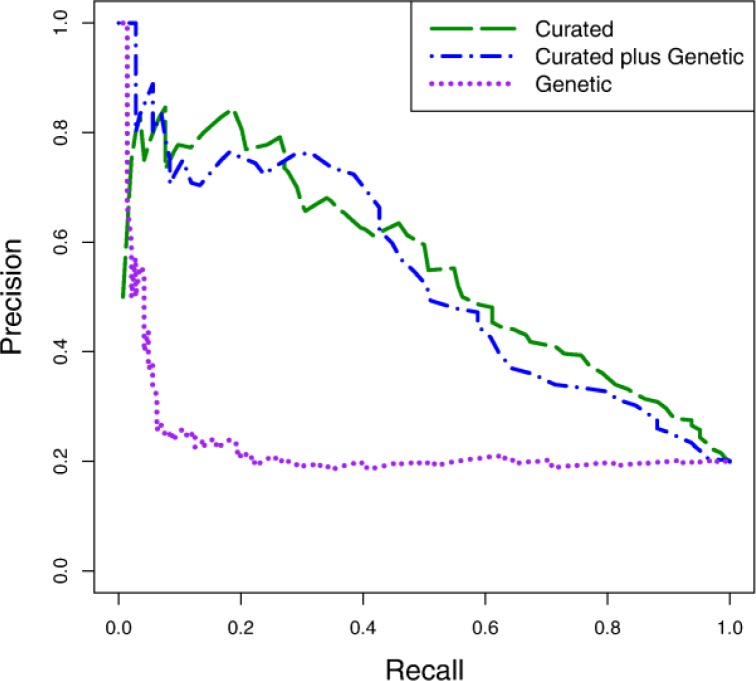
The empirical results we have presented so far consider only the clinical variables. We also conduct experiments to test the predictive value of the genetic variables. Figure 7 shows the precision-recall curves for random forest models learned using the curated variable set alone, the genetic variable set alone, and the two representations in conjunction. The genetic representation alone has little predictive value, except for a small number of cases that are represented in the low-recall, high-precision part of the curve. Moreover, when combined with the curated variables, the genetic representation does not offer a predictive advantage. The results shown here are representative of what we observed with all of the learning algorithms we evaluated.
Figure 7.
Precision-recall curves comparing the curated variable set, the genetic variable set, and the combined curated-genetic variable set using the random forest learning algorithm.
Because several of the SNPs we used have been shown to be associated with VTE risk23,24, we expected the genetic variables to provide more predictive value than they did. The lack of predictive value, however, is likely due to two issues: the risk/protective alleles for most of these SNPs are relatively rare, and our patient cohort is fairly small. In future work, we plan to incorporate additional risk-associated SNPs, and to investigate other representations of the SNP data that might make risk-prone genotypes more apparent to the learning algorithms.
Comparison against existing VTE scoring models:
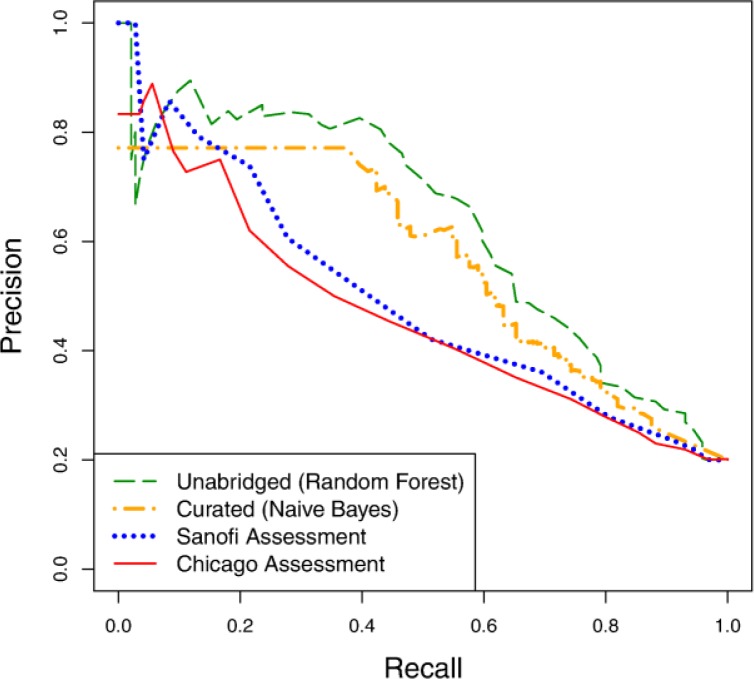
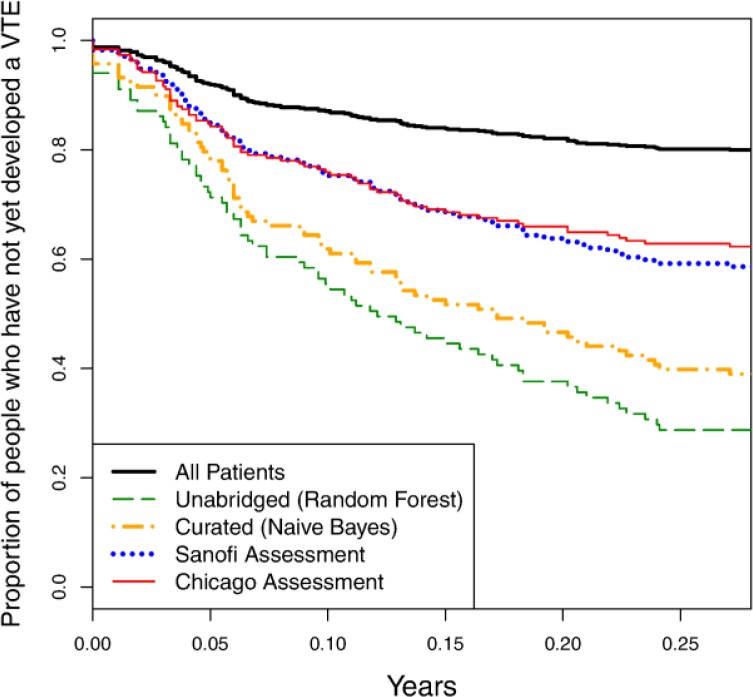
Finally, we compare the predictive value of our learned models against the previously developed Sanofi and Chicago risk assessment questionnaires. We generate precision-recall curves for the two questionnaires by varying a threshold on the patient scores tabulated by the questionnaires. We generate survival curves by picking a recall value (here, 50%), determining the confidence threshold that results in this recall value, and plotting all patients who fall above that threshold. Figure 8 and Figure 9 show the precision-recall and survival curves, respectively, for these approaches compared against the curves for our best models on curated (naïve Bayes) and unabridged (random forest) variable sets.
Figure 8.
Precision-recall curves comparing models learned using the curated and unabridged variable sets to the Sanofi and Chicago risk assessment questionnaires.
Figure 9.
Survival curves comparing models learned using the curated and unabridged variable sets to the Sanofi and Chicago risk assessment questionnaires.
The precision-recall curves of both assessment questionnaires are nearly dominated by both of our models, while the survival curves of our models completely dominate those of the risk assessment questionnaires. From this result, we conclude that there is significant value in learning such risk-assessment models from EHR, as opposed to hand-coding them.
Additional information about the representations and results from our machine-learning experiments is available at www.biostat.wisc.edu/~craven/amia2012/.
Conclusion
We have addressed the task of predicting which patients are most at risk for developing a post-hospitalization VTE. Given a set of cases and controls, we used machine-learning methods to induce models for making these predictions from patient histories automatically elicited from an EHR. Our study offers a number of interesting and important conclusions. First, our analysis of the variables extracted from patient records identifies a number of risk factors that were not previously used in VTE risk assessments or discussed in the relevant literature. Second, we show that we are able to use machine-learning methods to induce models that identify high-risk patients with relatively high accuracy. Third, we show that, even without having prior knowledge about relevant risk factors, we are able to learn accurate models for this task. Fourth, we demonstrate that our learned models exceed the predictive accuracy of previously devised scoring systems for VTE.
There are a number of directions that we plan to explore in future research. First, we have recently acquired a larger set of cases and controls that we can use to further validate our findings. Second, we plan to incorporate additional VTE-implicated SNPs in our genetic representation, and investigate alternative representations for the SNP variables that better expose the VTE predisposition of a given patient to the learning algorithms. For example, we might include variables that count the numbers of risk and protective alleles that a given patient has. Third, we plan to explore ways to discover and represent groups of risk factors that seem to represent common themes, such as the low blood volume and infection groups identified in our analysis of individual variables. The potential advantage of discovering such themes is that they might enable more accurate models to be learned from sparse patient records and infrequently occurring record types.
Acknowledgments
This research was supported by the Wisconsin Genomics Initiative, NIH/NLM grant R01 LM07050, and NIH/NCRR grant 1UL1RR025011 to the UW/Marshfield Institute for Clinical and Translational Research.
References
- 1.Edelsberg J, Hagiwara M, Taneja C, Oster G. Risk of venous thromboembolism among hospitalized medically ill patients. American Journal of Health-System Pharmacy. 2006;63:S16–S22. doi: 10.2146/ajhp060389. [DOI] [PubMed] [Google Scholar]
- 2.Anderson FA, Spencer FA. Risk factors for venous thromboembolism. Circulation. 2003;107(23 Suppl 1):I9–I16. doi: 10.1161/01.CIR.0000078469.07362.E6. [DOI] [PubMed] [Google Scholar]
- 3.Spyropoulos AC, Lin J. Direct medical costs of venous thromboembolism and subsequent hospital readmission rates: an administrative claims analysis from 30 managed care organizations. Journal of Managed Care Pharmacy. 2007;13(6):475–486. doi: 10.18553/jmcp.2007.13.6.475. [DOI] [PMC free article] [PubMed] [Google Scholar]
- 4.White RH. The epidemiology of venous thromboembolism. Circulation. 2003;107(Suppl 1):I4–I8. doi: 10.1161/01.CIR.0000078468.11849.66. [DOI] [PubMed] [Google Scholar]
- 5.U.S. Department of Health and Human Services . The Surgeon General’s call to action to prevent deep vein thrombosis and pulmonary embolism. 2008. [PubMed] [Google Scholar]
- 6.Heit JA, Silverstein MD, Mohr DN, Petterson TM, O’Fallon WM, Melton LJ. Risk factors for deep vein thrombosis and pulmonary embolism: a population-based case-control study. Archives of Internal Medicine. 2000;160(6):809–815. doi: 10.1001/archinte.160.6.809. [DOI] [PubMed] [Google Scholar]
- 7.Geerts WH, Pineo GF, Heit JA, et al. Prevention of venuous thromboembolism. Chest. 2004;126(Suppl 1):338S–400S. doi: 10.1378/chest.126.3_suppl.338S. [DOI] [PubMed] [Google Scholar]
- 8.Kho A, Rotz D, Alrahi K, et al. Utility of commonly captured data from an EHR to identify hospitalized patients at risk for clinical deterioration. AMIA Symposium Proceedings. 2007:404–408. [PMC free article] [PubMed] [Google Scholar]
- 9.Wells BJ, Jain A, Arrigain S, Yu C, Rosenkrans WA, Kattan MW. Predicting 6-year mortality risk in patients with type 2 diabetes. Diabetes Care. 2008;31:2301–2306. doi: 10.2337/dc08-1047. [DOI] [PMC free article] [PubMed] [Google Scholar]
- 10.Wu J, Roy J, Stewart WF. Prediction modeling using EHR data. Medical Care. 2010;48(6 Suppl 1):S106–S113. doi: 10.1097/MLR.0b013e3181de9e17. [DOI] [PubMed] [Google Scholar]
- 11.Robbins GK, Johnson KL, Chang Y, et al. Predicting virologic failure in an HIV clinic. Clinical Infectious Diseases. 2010;50:779–786. doi: 10.1086/650537. [DOI] [PMC free article] [PubMed] [Google Scholar]
- 12.Chang YJ, Yeh ML, Li YC, et al. Predicting hospital-acquired infections by scoring system with simple parameters. PLoS One. 2011;6(8):e23137. doi: 10.1371/journal.pone.0023137. [DOI] [PMC free article] [PubMed] [Google Scholar]
- 13.Zhao D, Weng C. Combining PubMed knowledge and EHR data to develop a weighted Bayesian network for pancreatic cancer prediction. Journal of Biomedical Informatics. 2011;44:859–868. doi: 10.1016/j.jbi.2011.05.004. [DOI] [PMC free article] [PubMed] [Google Scholar]
- 14.Evans RS, Lloyd JF, Aston VT, et al. Computer surveillance of patients at high risk for and with venous thromboembolism. AMIA Symposium Proceedings. 2010:217–211. [PMC free article] [PubMed] [Google Scholar]
- 15.Hippisley-Cox J, Coupland C. Development and validation of risk prediction algorithm (QThrombosis) to estimate future risk of venous thromboembolism: prospective cohort study. BMJ. 2011;343:d4656. doi: 10.1136/bmj.d4656. [DOI] [PMC free article] [PubMed] [Google Scholar]
- 16.Spyropoulos AC, Anderson FA, Jr, FitzGerald G, et al. Predictive and associative models to identify hospitalized medical patients at risk for VTE. Chest. 2011;140(3):706–714. doi: 10.1378/chest.10-1944. [DOI] [PubMed] [Google Scholar]
- 17.Hall M, Frank E, Holmes G, Pfahringer B, Reutemann P, Witten IH. The WEKA data mining software: an update. SIGKDD Explorations. 2009;11(1):10–18. [Google Scholar]
- 18.Sanofi-Aventis US LLC. The Coalition to Prevent Deep-Vein Thrombosis. 2012. Available from: http://www.preventdvt.org/docs/pdf/DVTRiskAssessmentForm.pdf
- 19.Caprini JA. Venous Resource Center. 2009. Available from: http://venousdisease.com/Risk%20assessment.pdf.
- 20.Rogers MAM, Levine DA, Blumberg N, Flanders SA, Chopra V, Langa KM. Triggers of hospitalization for venous thromboembolism. Circulation. 2012;125(17):2092–2099. doi: 10.1161/CIRCULATIONAHA.111.084467. [DOI] [PMC free article] [PubMed] [Google Scholar]
- 21.Hall MA. Correlation-based feature selection for machine learning (Doctoral dissertation) New Zealand: University of Waikato; 1999. [Google Scholar]
- 22.Chang CC, Lin CJ. LIBSVM: a library for support vector machines. ACM Transactions on Intelligent Systems and Technology. 2011;2(3):27:1–27:27. [Google Scholar]
- 23.Rosendaal FR, Reitsma PH. Genetics of venous thrombosis. Journal of Thrombosis and Haemostasis. 2009;7(1):301–304. doi: 10.1111/j.1538-7836.2009.03394.x. [DOI] [PubMed] [Google Scholar]
- 24.Bezemer ID, Bare LA, Doggen CJM, et al. Gene variants associated with deep vein thrombosis. JAMA. 2008;299(11):1306–1314. doi: 10.1001/jama.299.11.1306. [DOI] [PubMed] [Google Scholar]


