

Abstract
Background
We investigated whether continuous glucose monitoring (CGM) levels can accurately assess glycemic control while directing closed-loop insulin delivery.
Subjects and Methods
Data were analyzed retrospectively from 33 subjects with type 1 diabetes who underwent closed-loop and conventional pump therapy on two separate nights. Glycemic control was evaluated by reference plasma glucose and contrasted against three methods based on Navigator (Abbott Diabetes Care, Alameda, CA) CGM levels.
Results
Glucose mean and variability were estimated by unmodified CGM levels with acceptable clinical accuracy. Time when glucose was in target range was overestimated by CGM during closed-loop nights (CGM vs. plasma glucose median [interquartile range], 86% [65–97%] vs. 75% [59–91%]; P=0.04) but not during conventional pump therapy (57% [32–72%] vs. 51% [29–68%]; P=0.82) providing comparable treatment effect (mean [SD], 28% [29%] vs. 23% [21%]; P=0.11). Using the CGM measurement error of 15% derived from plasma glucose–CGM pairs (n=4,254), stochastic interpretation of CGM gave unbiased estimate of time in target during both closed-loop (79% [62–86%] vs. 75% [59–91%]; P=0.24) and conventional pump therapy (54% [33–66%] vs. 51% [29–68%]; P=0.44). Treatment effect (23% [24%] vs. 23% [21%]; P=0.96) and time below target were accurately estimated by stochastic CGM. Recalibrating CGM using reference plasma glucose values taken at the start and end of overnight closed-loop was not superior to stochastic CGM.
Conclusions
CGM is acceptable to estimate glucose mean and variability, but without adjustment it may overestimate benefit of closed-loop. Stochastic CGM provided unbiased estimate of time when glucose is in target and below target and may be acceptable for assessment of closed-loop in the outpatient setting.
Background
Closed-loop insulin delivery (the artificial pancreas) is an emerging medical device1 that may transform management of type 1 diabetes.2 Coupling subcutaneous continuous glucose monitoring (CGM)3 and insulin pump delivery4 in a continually glucose-responsive fashion aims to reduce the risk of hypoglycemia and to improve overall glycemic control. This promising approach differs from conventional pump therapy through the use of a control algorithm,5 which directs the subcutaneous insulin administration according to sensor glucose levels every 1–15 min.
Feasibility crossover randomized studies have documented benefits of closed-loop in youth and adults.6–8 Closed-loop control has also been explored in pregnancy.9,10 Nonrandomized studies using insulin but also co-administration of glucagon have evaluated a range of control approaches and algorithms,11–18 including suspension of insulin delivery to prevent hypoglycemia.19
So far, all reported clinical studies have been conducted under supervised conditions at a clinical research facility. Normally, plasma glucose is measured every 15–60 min to assess study outcomes as well as to mitigate against the risk of hypoglycemia. This is the gold standard approach for assessment of inpatient studies.
Outpatient studies, currently underway or in the planning stage, will not be able to use frequent reference glucose measurements, which is impracticable in ambulatory settings and particularly at nighttime. Assessment by glycated hemoglobin (HbA1c) is feasible but not suitable for short-term studies. At present, it is unclear whether CGM can be used to measure accurately study outcomes in addition to its primary role of informing the control algorithm. This is not obvious as CGM reports underlying plasma glucose with an error that can be transient and of a considerable magnitude. Additionally, the simultaneous use of CGM to inform and to assess closed-loop operation is questionable.
The present study addresses these methodological concerns. We contrasted three CGM-based methods, conventional unmodified CGM, stochastic CGM, and recalibrated CGM, with the gold standard reference plasma glucose to assess performance of closed-loop. The stochastic CGM approach reflects error in CGM measurements when considering whether underlying plasma glucose is placed within a given glucose range. The recalibrated CGM method recalculates retrospectively CGM values in between two reference glucose measurements. We used data from randomized overnight closed-loop studies and focused on time spent in the target range, which we identified to be the primary end point for short-term outpatient studies. Times below and above the target range were analyzed for completeness.
This study was presented in part at the 71st Scientific Sessions of the American Diabetes Association, San Diego, CA, June 2011.20
Subjects and Methods
We evaluated retrospectively data collected during three open-label randomized controlled crossover studies comparing closed-loop insulin delivery and conventional pump therapy in adolescents and adults with type 1 diabetes.6,7 The studies were approved by the Ethics Committee. Participants 16 years old and parents or guardians of participants younger than 16 years of age signed the consent form.
Setting and subjects
The studies were conducted at the Wellcome Trust Clinical Research Facility at Addenbrooke's Hospital, Cambridge, United Kingdom. Youth 12–18 years old and adults 18–65 years old from diabetes clinics at Cambridge took part. Inclusion criteria were type 1 diabetes (World Health Organization criteria) diagnosed at least 1 year previously and insulin pump therapy for at least 3 months. Exclusion criteria included clinically significant nephropathy or retinopathy, hypoglycemia unawareness, pregnancy, or breastfeeding. Adults with poor glycemic control (HbA1c greater than 10% [86 mmol/mol]) and significant insulin resistance (total daily dose above 1.4 U/kg/day) were excluded.
Study design
Common study design aspects
Subjects attended the clinical research facility on two occasions, undergoing overnight closed-loop insulin delivery and conventional pump therapy in random order. The visits were separated by an interval of 1–5 weeks, during which CGM was discontinued. On continuous insulin infusion nights, patients' standard pump settings were applied.
Early evening exercise in adolescents study
Nine postpubertal subjects 12–18 years old were studied on two 16-h-long occasions. At 1600 h, patients ate a light meal chosen from a list of standard snacks (45 g of carbohydrates) accompanied by a prandial bolus calculated from their insulin-to-carbohydrate ratio and sensor glucose concentrations. Subjects exercised at 55% of peak O2 capacity on a treadmill from 1800 until 1845 h with a 5-min rest at 1820 h. Insulin was delivered by closed-loop system between 2000 and 0800 h.
Eating-in scenario adult study
Twelve adults 18 years of age and older were studied in a randomized crossover study on two occasions. Participants ate an evening meal comprising 60 g of carbohydrate at 1900 h accompanied by prandial insulin calculated according to the participants' insulin-to-carbohydrate ratio and a fingerstick glucose value. During the intervention visit, closed-loop insulin delivery was applied from 1900 until 0800 h the next day.
Eating-out scenario adult study
Another 12 subjects participated in a second adult randomized crossover study after a large evening meal accompanied by alcohol, depicting the scenario of “eating out.” On both visits, participants ate an identical evening meal, comprising 100 g of carbohydrate at 2030 h, accompanied by prandial insulin and dry white wine (chenin blanc, 13% volume; Ken Forrester Wines, Stellenbosch, South Africa). Participants drank the wine (7.2 mL/kg or 6.6 units per 70-kg participant) with or after the meal, completing the meal by 2200 h. During the intervention visit, insulin was delivered by closed-loop from 2200 until 1200 h the next day. During the control visit, participants applied their usual insulin pump settings over the same time frame.
Subject characteristics
Subject characteristics are given in Supplementary Table S1 (Supplementary Data are available online at www.liebertonline.com/dia). Further details of study procedures are reported elsewhere.6,7
CGM and insulin delivery
To measure subcutaneous glucose in adolescents and the eating-in scenario we used the CGM system FreeStyle® Navigator (Abbott Diabetes Care, Alameda, CA) with a 10-h warm-up time.21 In the eating-out scenario we used the FreeStyle Navigator with a 1-h warm-up time.22 One sensor was inserted 1–3 days prior to study visits. The systems were calibrated using capillary fingerstick measurements as per the manufacturer's instructions. The CGM accuracy, evaluated as the mean absolute relative difference between sensor glucose levels and paired plasma glucose levels divided by plasma glucose levels, was 15.1% (n=4,254).
When the subjects arrived at the research facility, we replaced their insulin pump with a study pump (Deltec Cozmo®; Smiths Medical, St. Paul, MN). This pump was connected to the established infusion site, delivering rapid-acting insulin analog aspart (Novo Nordisk, Bagsvaerd, Denmark).
Closed-loop algorithm
We used an algorithm based on the model predictive control approach.5,6 Every 15 min a research nurse initiated a control cycle, inputting the sensor glucose value into the computer-based algorithm and adjusting the insulin pump manually according to the basal infusion rate calculated by the algorithm. The algorithm was initialized using the participant's weight, total daily insulin dose, and basal insulin requirements. The algorithm was provided with glucose levels measured by the sensor during a 30-min period preceding the start of closed-loop delivery, the carbohydrate content of the evening meal, and the prandial insulin bolus. The algorithm aimed to achieve glucose levels between 5.8 and 7.3 mmol/L and adjusted the actual level depending on fasting versus postprandial status, preceding glucose levels, and the accuracy of predictions. Safety rules limited the maximum insulin infusion and suspended insulin delivery when the sensor measured glucose at or below 4.3 mmol/L or when the sensor detected that glucose was decreasing rapidly.
Reference plasma glucose
We collected venous samples every 15 min for the determination of reference plasma glucose in duplicate with the YSI2300 STAT Plus™ analyzer (YSI, Lynchford House, Farnborough, United Kingdom). In adolescents we collected samples between 1700 and 0800 h; we measured them in the eating-in scenario between 1830 and 0800 h and in the eating-out scenario between 1930 and 1200 h. These data were not used to alter insulin infusion rates during closed-loop delivery or control visits.
Data analysis
The proportion of time when glucose was in the target range between 3.9 (70 mg/dL) and 8.0 mmol/L (145 mg/dL) was determined. Plasma glucose was the reference method and was contrasted against three surrogate methods using the CGM trace: “unmodified CGM,” “stochastic CGM,” and “recalibrated CGM.” We also calculated the time interval when glucose was below and above the target. Mean glucose and the SD of glucose determined the central tendency and dispersion. Indices were calculated over the period when closed-loop was operational as in the original work6,7 (i.e., between 2000 and 0800 h the next day in the adolescents study, between 1900 and 0800 h the next day in the eating-in scenario, and between 2200 and 1200 h the next day in the eating-out scenario). Calculations used CGM data sampled every 1 min; plasma glucose was interpolated to a 1-min resolution using a piecewise linear function.
Treatment effect (i.e., the benefit of closed-loop over conventional therapy) was calculated for time in target. A positive treatment effect indicates that during closed-loop glucose was in the target range for longer than during conventional therapy.
Stochastic CGM
Figure 1 demonstrates principles of stochastic CGM transformation, which takes into account the error in CGM measurements when calculating performance metrics. We adopted a 15% measurement error determined from analysis of the CGM–YSI pairs in the present study. The Appendix describes the derivations of study metrics. The mean is not affected by the stochastic transformation and is identical to unmodified CGM. All other metrics are affected.
FIG. 1.

Stochastic continuous glucose monitoring transformation acknowledges that a continuous glucose monitoring reading (shaded circle; 8.2 mmol/L in the present example) measures true glucose with an error, which we assume to be normally distributed with zero mean and 15% coefficient of variation (solid line). The unmodified continuous glucose monitoring measurement, located above the threshold of 8 mmol/L, will be classified as lying 100% above the target zone. Stochastic continuous glucose monitoring interpretation means that there is a 44% chance (shaded area under the normal curve) that the true glucose concentration is between 3.9 and 8 mmol/L and a 56% chance that it is above the 8 mmol/L threshold.
Recalibrated CGM
Another way to increase accuracy of a CGM trace is to recalculate CGM values in between two reference glucose measurements (so-called retrofitting) as outlined in Figure 2. The recalibrated CGM trace is identical to the measured reference glucose values at the two end points and retains the shape of the original excursion. The Appendix provides details of the calculation process. All metrics are affected by the transformation.
FIG. 2.

The recalibrated continuous glucose monitoring (CGM) trace (dashed line) is obtained from the unmodified CGM trace (solid line) using two reference glucose measurements (gray circle) taken at the start and end of the study period (1700 and 0800 h in present example). Recalibrated CGM corrects for sensor errors at the two measurement points and retains the shape through a linear transformation in between the end points.
Statistical analysis
Agreement between the reference method based on YSI data and surrogate methods based on CGM values was assessed by the Bland–Altman plot.23 The Wilcoxon signed-rank test compared non-normally distributed indices, and the paired t test compared normally distributed variables (IBM SPSS version 19; SPSS Inc., Chicago, IL). A value of P<0.05 was considered statistically significant. Results are presented as median (first quartile – third quartile [interquartile range]) or mean (SD) unless stated otherwise.
Results
Reference plasma glucose
Table 1 shows outcome metrics based on plasma glucose reference values. Metrics for closed-loop and conventional pump therapy are reported separately. Overnight closed-loop achieved tighter glycemic control than conventional pump therapy as documented by increased time spent in the target range, reduced SD, and reduced time spent below and above the target range.
Table 1.
Results of Closed-Loop Insulin Delivery and Conventional Pump Therapy Based on Plasma Glucose Measured by the YSI Analyzer and Unmodified, Stochastic, and Recalibrated Continuous Glucose Monitoring
| |
|
CGM |
||
|---|---|---|---|---|
| Parameter, visit | Plasma glucose | Unmodified | Stochastic | Recalibrated |
| Mean glucose (mmol/L) | ||||
| Closed-loop | 6.5±1.2 | 6.8±1.0 | 6.8±1.0 | 6.3±1.2 |
| Conventional | 7.0±2.4 | 7.2±2.4 | 7.2±2.4 | 6.7±1.6 |
| SD of glucose (mmol/L) | ||||
| Closed-loop | 1.4±0.6 | 1.4±0.8 | 1.8±0.7 | 1.4±0.7 |
| Conventional | 2.2±0.9 | 2.1±0.9 | 2.4±0.9 | 2.3±1.1 |
| Time below target <3.9 mmo/L (%) | ||||
| Closed-loop | 3.4 (0.0–11) | 0.0 (0.0–4.1) | 2.5 (0.9–6.3) | 7.9 (0.0–14) |
| Conventional | 5.3 (0.0–26) | 3.2 (0.0–27) | 6.9 (1.3–28) | 15 (0.3–24) |
| Time in target 3.9–8.0 mmol/L (%) | ||||
| Closed-loop | 75 (59–91) | 86 (65–97) | 79 (62–86) | 74 (59–87) |
| Conventional | 51 (29–68) | 57 (32–72) | 54 (33–66) | 56 (36–78) |
| Time above target >8.0 mmol/L (%) | ||||
| Closed-loop | 15 (0.0–37) | 10 (0.0–31) | 17 (8.8–33) | 11 (0.0–29) |
| Conventional | 31 (11–56) | 29 (12–47) | 31 (12–44) | 19 (10–48) |
Data are mean (SD) values or median (interquartile range) (n=33).
CGM, continuous glucose monitoring.
Unmodified CGM
The unmodified CGM trace as reported by the FreeStyle Navigator tended to overestimate time in target (unmodified CGM vs. plasma glucose, 86% vs. 75%; P=0.04) during closed-loop but not during conventional pump therapy (57% vs. 51%; P=0.82) (Table 1). Time below target tended to be lower during closed-loop as measured by unmodified CGM (0.0% vs. 3.4%) and to a lesser degree during conventional pump therapy (3.2% vs. 5.3%). Time above target was comparable during both treatments. Mean glucose was overestimated by 0.3 mmol/L during closed-loop and by 0.2 mmol/L during conventional pump therapy. SD of glucose was comparable to that with the reference method.
The Bland–Altman plot of time in target (Fig. 3) confirmed an overestimation during closed-loop therapy and considerable differences against the reference (2×SD level of agreement at 40%). The differences were similar across the x-axis range. There was one outlier during conventional pump therapy and another outlier during closed-loop when time in target was overestimated by 70% and 90%, respectively.
FIG. 3.

Bland–Altman plots showing “time in target” during conventional pump therapy (open circle, n=33) and closed-loop (filled circle, n=33) as measured by reference plasma glucose (PG) and (A and D) unmodified continuous glucose monitoring (CGM), (B and E) stochastic CGM, and (C and F) recalibrated CGM. The mean±2×SD level of agreement is also shown (dashed lines).
Stochastic CGM
Stochastic CGM achieved comparable time in target as reference plasma glucose during closed-loop (P=0.24) and conventional pump therapy (P=0.44) (Table 1). Time above target was comparable during closed-loop and conventional pump therapy as measured by stochastic CGM and plasma glucose. Time below target was also comparable. The unbiased Bland–Altman plot of time in target is shown in Figure 3 with a tighter level of agreement at 35%. Disagreement by the two outliers was reduced by 20%.
SD of glucose was overestimated during both closed-loop and conventional pump therapy (0.2–0.4 mmol/L) as expected given that it is inflated by 15% associated with the sensor error. Mean glucose was, by definition, identical to that with unmodified CGM.
Recalibrated CGM
Time in target was well reproduced during closed-loop insulin delivery (P=0.57) and was borderline overestimated during conventional pump therapy (56% vs. 51%; P=0.08) (Table 1 and Fig. 3). Time below target as measured by recalibrated CGM tended to be higher during conventional pump therapy (5.3% vs. 15%), and time above target tended to be lower (19% vs. 31%). The level of agreement for time in target was substantially tighter during closed-loop at 20% but was elevated to 35–40% during conventional pump delivery (Fig. 3).
Mean glucose was slightly underestimated by 0.2–0.3 mmol/L. SD was accurately reproduced. The two outliers were eliminated.
Treatment effect
The treatment effect assessing the benefit of closed-loop in terms of increased time in target was slightly higher but without reaching statistical significance when estimated by CGM (unmodified CGM vs. plasma glucose, 28% [29%] vs. 23% [21%]; P=0.11). The level of agreement was between −40% and 30% (Fig. 4). Stochastic CGM provided an estimate of treatment effect without bias (23% [24%] vs. 23% [21%]; P=0.96) and a tighter level of agreement between −30% and 30%. Recalibrated CGM underestimated treatment effect (16% [26%] vs. 23% [21%]; P=0.04). The level of agreement was between −30% and 45%.
FIG. 4.

Bland–Altman plots of the treatment effect as measured by reference plasma glucose (PG) and (A) unmodified continuous glucose monitoring (CGM), (B) stochastic CGM, and (C) recalibrated CGM. Treatment effect is defined as the additional time in target during closed-loop compared with conventional pump therapy. The mean±2×SD level of agreement is also shown (n=33) (dashed lines).
Discussion
In the absence of frequent reference glucose measurements, our results suggest that stochastic CGM transformation of the FreeStyle Navigator CGM trace provides accurate and unbiased estimates of time in target and time below target. The treatment effect calculated as the difference in time in target between control and intervention arms is also accurately determined. However, stochastic CGM overestimates variability, which is accurately assessed by unmodified CGM. We recommend the use of stochastic CGM to estimate threshold metrics such as time in, below, and above target, whereas unmodified CGM may be used to determine glucose mean and variability to evaluate overnight closed-loop in outpatient settings.
When a treatment effect exists, unmodified CGM has an innate propensity to inflate time in target during closed-loop. Time below target is underestimated. Such differences are not present during conventional pump therapy. This supports the notion that the use of unmodified CGM to inform and, at the same time, to assess closed-loop is methodologically flawed. Further insights expose the cause. Although unmodified CGM provides a clinically unbiased estimate of the overall plasma glucose level during closed-loop, this is not the case at low plasma glucose levels. For example, considering plasma glucose measurements between 3 and 3.9 mmol/L, closed-loop pulls unmodified CGM by 1 mmol/L toward the target: unmodified CGM versus plasma glucose, 4.6 (0.7) vs. 3.6 (0.3) mmol/L (P<0.001; n=101 pooled YSI–CGM pairs). This “pull” is considerably less pronounced during conventional pump therapy (3.7 [0.8] vs. 3.5 [0.3] mmol/L; P=0.01, n=206), and the latter may be related to the phenomenon of “regression toward the mean.” The control algorithm instructs insulin delivery with the objective of achieving a setpoint located within the target range. If fully efficacious, closed-loop centers CGM values in the target range, albeit some in the vicinity of the target thresholds. Plasma glucose levels spill outside the target range because of the measurement error, and the true time in target is overestimated and time below is underestimated.
Stochastic CGM corrects for the “threshold behavior” by using probabilistic reasoning. Each unmodified CGM value is evaluated according to how likely it is for the corresponding plasma glucose level to lie on either side of the threshold. This corrects for the undesirable characteristics of unmodified CGM during closed-loop operation while also providing accurate estimates of time in, below, and above target during conventional pump therapy.
Recalibration aims to improve accuracy by re-adjusting the CGM trace retrospectively according to reference plasma glucose measurements taken before the start and at the end of overnight studies. This extends the calibration procedure designed by the manufacturer. In order for the method to be effective, the CGM trace at the two measurement points needs to be well behaved (no compression dropouts, etc.), the reference measurements need to be accurate, and the CGM error should be gradually distributed between the two reference measurements. The approach worked well for closed-loop but, unexpectedly, less well during conventional pump therapy when time in target tended to be overestimated and time above target underestimated (Table 1). This could be a chance observation, and evaluations in other datasets are warranted. The level of agreement associated with time in target was tightest among all methods during closed-loop but not during conventional pump therapy. Outliers were eliminated (Fig. 3) by correcting sensor over-reading in two subjects who originally presented nearly 100% time in target based on unmodified CGM, whereas YSI was consistently below target. It is unclear why performance of recalibrated CGM differed between the two treatment arms. As we used highly accurate YSI plasma measurement to re-adjust the unmodified CGM trace, we most likely exaggerated the usefulness of the method in outpatient settings as reference glucose will be measured using meters with lower accuracy compared with YSI, and this is likely to have a detrimental effect on accuracy of the recalibrated CGM trace. More frequent reference glucose measurements may be helpful, but this increases experimental complexity. Compared with stochastic CGM, recalibrated CGM is less practicable as it requires a highly accurate blood glucose meter such as the HemoCue® (Angelholm, Sweden) to determine reference glucose at the start and end of closed-loop. Future investigations may evaluate the combination of recalibration and stochastic transformation. This will require the determination of the error associated with recalibrated CGM.
The assessment of the treatment effect concurs that stochastic CGM may be most suitable to evaluate the benefits of overnight closed-loop. The level of agreement is tightest among the three methods. Stochastic CGM provides estimate of treatment effect and its variability without bias, indicating that power calculations based on plasma glucose or stochastic CGM can adopt similar assumptions. The bias by unmodified CGM seems likely to be present when the null hypothesis of no difference between groups is false, and thus the use of unmodified CGM as the outcome measure does not increase the type 1 error.
The principles of stochastic CGM transformation may apply to other CGM devices subject to the use of a device-specific measurement error, set at 15% for FreeStyle Navigator. Device-specific investigations are warranted and similarly studies to evaluate stochastic CGM and recalibrated CGM on other datasets.
Our results may be relevant to studies evaluating suspended insulin delivery to prevent hypoglycemia or to reduce hypoglycemia duration or severity. The primary end point of such studies may be the occurrence of hypoglycemia (e.g., plasma glucose <3.9 mmol/L [70 mg/dL], a threshold binary outcome). During conventional pump therapy we recorded identical false-positive and false-negative hypoglycemia rates (35% vs. 35%). During closed-loop insulin delivery, the false-positive rate was unchanged at 34%, but the false-negative rate more than doubled to 80%. This imbalance presumably increases with increasing efficacy of CGM-directed insulin delivery but may not be an important factor when the null hypothesis of no difference is true. These methodological issues may inappropriately exaggerate the treatment effect in studies evaluating suspended insulin delivery at low glucose when unmodified CGM is used to derived outcomes and when a true treatment effect exists.24–26 Our findings are relevant to these studies, which may warrant further evaluation to determine the true extent of the treatment effect.
The strengths of the present study are the use of a high-quality dataset collected in a diverse population of subjects with type 1 diabetes, the ability to evaluate metrics for the interventional and control arms, and consideration of two practical ways to improve CGM accuracy. The limitations relate to the inability to evaluate other monitors apart from the FreeStyle Navigator, using YSI rather than fingerstick measurement to obtain recalibrated CGM, and focusing on the overnight period without considering daytime. These shortcomings do not affect the main study findings but limit generalization. Other limitations include this being a single study, and other scenarios may exist where stochastic CGM may perform differently. Additionally, the stochastic CGM approach assumed a uniform error, whereas the error may vary from sensor to sensor.
Conclusions
CGM without adjustment may overestimate the benefit of overnight closed-loop insulin delivery when a true treatment effect exists. Once adjusted using stochastic interpretation, CGM may provide unbiased estimate of time when glucose is in target and below target. CGM without adjustment can be used to estimate mean glucose and glucose variability. These findings may be important for studies of low glucose suspend and/or closed-loop insulin delivery in the home setting. Researchers considering CGM time in target or time below target as a primary outcome should carefully consider its limitations and how they can be overcome.
Appendix—Description of Procedures to Calculate Stochastic CGM and Recalibrated CGM
Stochastic CGM
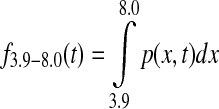
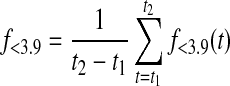
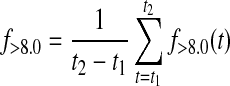
Stochastic CGM transformation assumed the CGM trace to be a normally distributed discrete-time (1-min step) temporal random variable. Time in target f3.9–8.0(t) at time t was calculated as
 |
(1) |
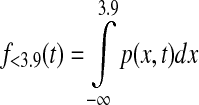
where p(x,t) is the probability density function of the normal distribution with mean defined by CGM at time t, CGM(t), and variance [0.15 CGM(t)]2. Similarly, time below target f<3.9(t) and time above target f>8.0(t) at time t were calculated as
 |
(2) |
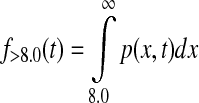 |
(3) |
The contributions from the start (t1) to the end (t2) of the evaluative period were summed up on minute-to-minute basis. This provided the overall time in target f3.9–8.0, as well as time below f<3.9 and above target f>8.0:
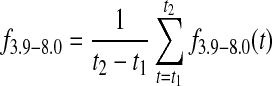 |
(4) |
 |
(5) |
 |
(6) |
The SD of glucose was calculated as
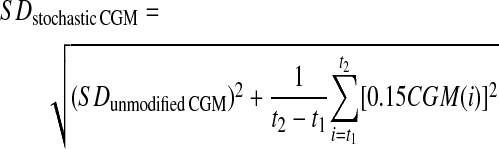 |
(7) |
where SDunmodified CGM is the SD of the unmodified CGM trace.
Recalibrated CGM
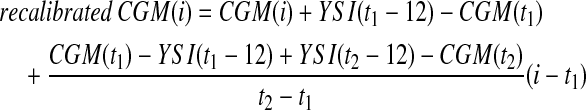
An evening YSI reference plasma glucose measurements was paired with the CGM measurement observed 12 min later to account for a time-lag associated with the FreeStyle Navigator.21,27 The end point was at the end of the closed-loop period. Recalibrated CGM assumed a linear distribution of the error between the two pairings at t1 (1957 h for adolescent study; 1857 h for eating-in scenario; 2027 h for eating-out scenario) and t2 (0757 h for adolescent study and eating-in scenario; 1157 h for eating-out scenario):
 |
(8) |
Supplementary Material
Acknowledgments
This work was supported by the Juvenile Diabetes Research Foundation (grants 22-2006-1113, 22-2007-1801, 22-2009-801, 22-2009-802, and 22-2011-668), the National Institute of Diabetes and Digestive and Kidney Diseases (grant 1R01DK085621), Diabetes UK (grant BDA07/0003549), European Commission Framework Program 7 (grant 247138), the NIHR Cambridge Biomedical Research Centre, and the Medical Research Council Centre for Obesity and Related Metabolic Diseases. Dr. Helen Murphy, University of Cambridge, provided helpful feedback. M.N. and R.H. had full access to all of the data in the study and take responsibility for the integrity of the data and the accuracy of the data analysis. R.H., M.N., and M.E.W. co-designed the studies, M.N. analyzed the data, A.H. supported data analysis, and R.H. and M.N. contributed to the interpretation of the results and the writing of the report. All authors reviewed the manuscript.
Author Disclosure Statement
R.H. reports having received speaker honoraria from Minimed Medtronic, LifeScan, Eli Lilly, and Novo Nordisk, serving on an advisory panel for Animas and Minimed Medtronic, receiving license fees from BBraun, and having served as a consultant to BBraun and Profil. M.N., A.H., and M.E.W. declare no competing financial interests exist. R.H. and M.E.W. report patent applications.
References
- 1.Hovorka R. Closed-loop insulin delivery: from bench to clinical practice. Nat Rev Endocrinol. 2011;7:385–395. doi: 10.1038/nrendo.2011.32. [DOI] [PubMed] [Google Scholar]
- 2.Kowalski AJ. Can we really close the loop, how soon? Accelerating the availability of an artificial pancreas: a roadmap to better diabetes outcomes. Diabetes Technol Ther. 2009;11(Suppl 1):S-113–S-119. doi: 10.1089/dia.2009.0031. [DOI] [PubMed] [Google Scholar]
- 3.Hoeks LB. Greven WL. de Valk HW. Real-time continuous glucose monitoring system for treatment of diabetes: a systematic review. Diabet Med. 2011;28:386–394. doi: 10.1111/j.1464-5491.2010.03177.x. [DOI] [PubMed] [Google Scholar]
- 4.Pickup J. Keen H. Continuous subcutaneous insulin infusion at 25 years: evidence base for the expanding use of insulin pump therapy in type 1 diabetes. Diabetes Care. 2002;25:593–598. doi: 10.2337/diacare.25.3.593. [DOI] [PubMed] [Google Scholar]
- 5.Bequette BW. A critical assessment of algorithms and challenges in the development of a closed-loop artificial pancreas. Diabetes Technol Ther. 2005;7:28–47. doi: 10.1089/dia.2005.7.28. [DOI] [PubMed] [Google Scholar]
- 6.Hovorka R. Allen JM. Elleri D. Chassin LJ. Harris J. Xing D. Kollman C. Hovorka T. Larsen AM. Nodale M. De Palma A. Wilinska ME. Acerini CL. Dunger DB. Manual closed-loop insulin delivery in children and adolescents with type 1 diabetes: a phase 2 randomised crossover trial. Lancet. 2010;375:743–751. doi: 10.1016/S0140-6736(09)61998-X. [DOI] [PubMed] [Google Scholar]
- 7.Hovorka R. Kumareswaran K. Harris J. Allen JM. Elleri D. Xing D. Kollman C. Nodale M. Murphy HR. Dunger DB. Amiel SA. Heller SR. Wilinska ME. Evans ML. Overnight closed loop insulin delivery (artificial pancreas) in adults with type 1 diabetes: crossover randomised controlled studies. BMJ. 2011;342:d1855. doi: 10.1136/bmj.d1855. [DOI] [PMC free article] [PubMed] [Google Scholar]
- 8.Breton M. Farret A. Bruttomesso D. Anderson S. Magni L. Patek S. Dalla Man C. Place J. Demartini S. Del Favero S. Toffanin C. Hughes-Karvetski C. Dassau E. Zisser H. Doyle FJ., III De Nicolao G. Avogaro A. Cobelli C. Renard E. Kovatchev B International Artificial Pancreas (iAP) Study Group. Fully integrated artificial pancreas in type 1 diabetes: modular closed-loop glucose control maintains near normoglycemia. Diabetes. 2012;61:2230–2237. doi: 10.2337/db11-1445. [DOI] [PMC free article] [PubMed] [Google Scholar]
- 9.Murphy HR. Elleri D. Allen JM. Harris J. Simmons D. Rayman G. Temple R. Dunger DB. Haidar A. Nodale M. Wilinska ME. Hovorka R. Closed-loop insulin delivery during pregnancy complicated by type 1 diabetes. Diabetes Care. 2011;34:406–411. doi: 10.2337/dc10-1796. [DOI] [PMC free article] [PubMed] [Google Scholar]
- 10.Murphy HR. Kumareswaran K. Elleri D. Allen JM. Caldwell K. Biagioni M. Simmons D. Dunger DB. Nodale M. Wilinska ME. Amiel SA. Hovorka R. Safety and efficacy of 24-h closed-loop insulin delivery in well-controlled pregnant women with type 1 diabetes: a randomized crossover case series. Diabetes Care. 2011;34:2527–2529. doi: 10.2337/dc11-1430. [DOI] [PMC free article] [PubMed] [Google Scholar]
- 11.Steil GM. Rebrin K. Darwin C. Hariri F. Saad MF. Feasibility of automating insulin delivery for the treatment of type 1 diabetes. Diabetes. 2006;55:3344–3350. doi: 10.2337/db06-0419. [DOI] [PubMed] [Google Scholar]
- 12.Weinzimer SA. Steil GM. Swan KL. Dziura J. Kurtz N. Tamborlane WV. Fully automated closed-loop insulin delivery versus semiautomated hybrid control in pediatric patients with type 1 diabetes using an artificial pancreas. Diabetes Care. 2008;31:934–939. doi: 10.2337/dc07-1967. [DOI] [PubMed] [Google Scholar]
- 13.Renard E. Place J. Cantwell M. Chevassus H. Palerm CC. Closed-loop insulin delivery using a subcutaneous glucose sensor and intraperitoneal insulin delivery: feasibility study testing a new model for the artificial pancreas. Diabetes Care. 2010;33:121–127. doi: 10.2337/dc09-1080. [DOI] [PMC free article] [PubMed] [Google Scholar]
- 14.Atlas E. Nimri R. Miller S. Grunberg EA. Phillip M. MD-Logic artificial pancreas system: a pilot study in adults with type 1 diabetes. Diabetes Care. 2010;33:1072–1076. doi: 10.2337/dc09-1830. [DOI] [PMC free article] [PubMed] [Google Scholar]
- 15.Kovatchev B. Cobelli C. Renard E. Anderson S. Breton M. Patek S. Clarke W. Bruttomesso D. Maran A. Costa S. Avogaro A. Dalla Man C. Facchinetti A. Magni L. De Nicolao G. Place J. Farret A. Multinational study of subcutaneous model-predictive closed-loop control in type 1 diabetes mellitus: summary of the results. J Diabetes Sci Technol. 2010;4:1374–1381. doi: 10.1177/193229681000400611. [DOI] [PMC free article] [PubMed] [Google Scholar]
- 16.Steil GM. Palerm CC. Kurtz N. Voskanyan G. Roy A. Paz S. Kandeel FR. The effect of insulin feedback on closed loop glucose control. J Clin Endocrinol Metab. 2011;96:1402–1408. doi: 10.1210/jc.2010-2578. [DOI] [PMC free article] [PubMed] [Google Scholar]
- 17.El-Khatib FH. Russell SJ. Nathan DM. Sutherlin RG. Damiano ER. A bihormonal closed-loop artificial pancreas for type 1 diabetes. Sci Transl Med. 2010;2:27ra27. doi: 10.1126/scitranslmed.3000619. [DOI] [PMC free article] [PubMed] [Google Scholar]
- 18.Castle JR. Engle JM. El YJ. Massoud RG. Yuen KC. Kagan R. Ward WK. Novel use of glucagon in a closed-loop system for prevention of hypoglycemia in type 1 diabetes. Diabetes Care. 2010;33:1282–1287. doi: 10.2337/dc09-2254. [DOI] [PMC free article] [PubMed] [Google Scholar]
- 19.Buckingham B. Chase HP. Dassau E. Cobry E. Clinton P. Gage V. Caswell K. Wilkinson J. Cameron F. Lee H. Bequette BW. Doyle FJ., III Prevention of nocturnal hypoglycemia using predictive alarm algorithms and insulin pump suspension. Diabetes Care. 2010;33:1013–1017. doi: 10.2337/dc09-2303. [DOI] [PMC free article] [PubMed] [Google Scholar]
- 20.Nodale M. Haidar A. Wilinska ME. Hovorka R. The use of continuous glucose monitoring (CGM) to evaluate performance of closed-loop insulin delivery systems [abstract] Diabetes. 2011;60(Suppl 1):A64. doi: 10.1089/dia.2012.0185. [DOI] [PMC free article] [PubMed] [Google Scholar]
- 21.Weinstein RL. Schwartz SL. Brazg RL. Bugler JR. Peyser TA. McGarraugh GV. Accuracy of the 5-day FreeStyle Navigator Continuous Glucose Monitoring System: comparison with frequent laboratory reference measurements. Diabetes Care. 2007;30:1125–1130. doi: 10.2337/dc06-1602. [DOI] [PubMed] [Google Scholar]
- 22.Geoffrey M. Brazg R. Richard W. FreeStyle Navigator continuous glucose monitoring system with TRUstart algorithm, a 1-hour warm-up time. J Diabetes Sci Technol. 2011;5:99–106. doi: 10.1177/193229681100500114. [DOI] [PMC free article] [PubMed] [Google Scholar]
- 23.Bland JM. Altman DG. Statistical methods for assessing agreement between two methods of clinical measurement. Lancet. 1986;i:307–310. [PubMed] [Google Scholar]
- 24.Choudhary P. Shin J. Wang Y. Evans ML. Hammond PJ. Kerr D. Shaw JA. Pickup JC. Amiel SA. Insulin pump therapy with automated insulin suspension in response to hypoglycemia: reduction in nocturnal hypoglycemia in those at greatest risk. Diabetes Care. 2011;34:2023–2025. doi: 10.2337/dc10-2411. [DOI] [PMC free article] [PubMed] [Google Scholar]
- 25.Agrawal P. Welsh JB. Kannard B. Askari S. Yang Q. Kaufman FR. Usage and effectiveness of the low glucose suspend feature of the Medtronic Paradigm Veo insulin pump. J Diabetes Sci Technol. 2011;5:1137–1141. doi: 10.1177/193229681100500514. [DOI] [PMC free article] [PubMed] [Google Scholar]
- 26.Danne T. Kordonouri O. Holder M. Haberland H. Golembowski S. Remus K. Blasig S. Wadien T. Zierow S. Hartmann R. Thomas A. Prevention of hypoglycemia by using low glucose suspend function in sensor-augmented pump therapy. Diabetes Technol Ther. 2011;13:1129–1134. doi: 10.1089/dia.2011.0084. [DOI] [PubMed] [Google Scholar]
- 27.Garg SK. Voelmle M. Gottlieb PA. Time lag characterization of two continuous glucose monitoring systems. Diabetes Res Clin Pract. 2010;87:348–353. doi: 10.1016/j.diabres.2009.11.014. [DOI] [PubMed] [Google Scholar]
Associated Data
This section collects any data citations, data availability statements, or supplementary materials included in this article.