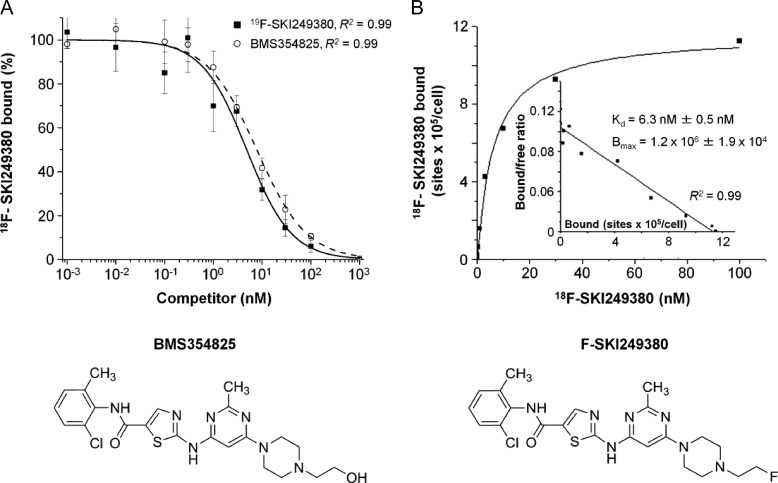
Figure 2.
In vitro competitive PDGFRα receptor binding kinetics with 19F-SKI249380, dasatinib, and 18F-SKI249380 in mGBM cells using a range of concentrations (0.001–1000 nM). (A) High affinity and specific binding of 18F-SKI249380 to mGBM cells after co-incubating with 19F-SKI249380 or dasatinib and γ-counting. (B) Saturation binding kinetics of 18F-SKI249380 to mGBM cells. The inset shows Scatchard analysis of binding data, plotting the ratio of the concentration of receptor-bound (B) to unbound (or free [F]) radioligand or the bound-to-free ratio (B/F) versus the receptor-bound receptor concentration; the slope corresponds to the Kd and x-intercept corresponds to receptor concentration. Schematics of BMS354825 (dasatinib) and the fluorinated dasatinib derivative, F-SKI249380, are shown.

