Abstract
The combination of microchip electrophoresis (ME) with amperometric detection leads to a number of analytical challenges that are associated with isolating the detector from the high voltages used for the separation. While methods such as end-channel alignment and the use of decouplers have been employed, they have limitations. A less common method has been to utilize an electrically isolated potentiostat. This approach allows placement of the working electrode directly in the separation channel without using a decoupler. This paper explores the use of microchip electrophoresis and electrochemical detection (ME-EC) with an electrically isolated potentiostat for the separation and in-channel detection of several biologically important anions. The separation employed negative polarity voltages and tetradecyltrimethylammonium bromide (TTAB, as a buffer modifier) for the separation of nitrite (NO2-), glutathione (GSH), ascorbic acid (AA), and tyrosine (Tyr). A half-wave potential (E½) shift of approximately negative 500 mV was observed for NO2- and H2O2 standards in the in-channel configuration compared to end channel. Higher separation efficiencies were observed for both NO2- and H2O2 with the in-channel detection configuration. The limits of detection were approximately two-fold lower and the sensitivity was approximately two-fold higher for in-channel detection of nitrite when compared to end-channel. The application of this microfluidic device for the separation and detection of biomarkers related to oxidative stress is described.
Keywords: Electrically isolated potentiostat, In-channel electrochemical detection, Microchip electrophoresis, Peroxynitrite, Reactive nitrogen species
1 Introduction
Amperometry is a popular detection method for lab-on-a-chip devices due to its high sensitivity and selectivity as well as the fact that electrodes can be fabricated using the same photolithographic techniques employed to create the microfluidic device [1-3]. ME is a technique that is able to generate very fast, highly efficient separations in a small and potentially portable format [3-6]. The combination of amperometric detection with ME provides a powerful approach to the determination of a variety of biologically important compounds including reactive oxygen species (ROS) [7], reactive nitrogen species (RNS) [8], catecholamines [9, 10], thiols [11, 12], and carbohydrates [13-15]. This technique has been used in a variety of applications including biomedical [16], agricultural [17], forensics [18, 19], and environmental analyses [20].
However, coupling amperometric detection with electrophoresis can be challenging. The high voltages used to perform electrophoretic separations create a large amount of noise at the detector and can irreversibly damage the electronic circuitry of conventional potentiostats. To avoid these issues, three approaches have been employed to isolate the detector electrode from the high voltage field. These methods include aligning the electrode outside of the separation channel in what is referred to as an “end-channel” configuration [21, 22] (Figure 1A), using a decoupler to shunt the high voltage to ground just prior to the detector (off-channel) [9, 23, 24] and specialized electrically isolated potentiostats that allow the electrode to be placed directly in the separation channel (in-channel) [21, 25, 26] (Figure 1B).
Figure 1.
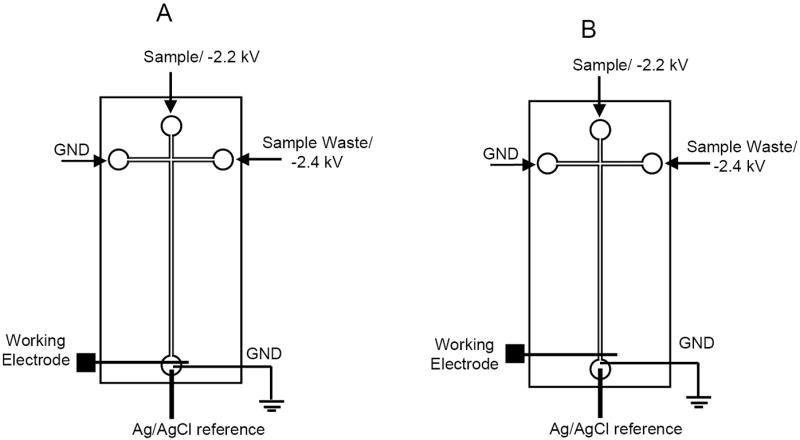
Schematic of (A) end-channel and (B) in-channel detection.
Each of these approaches possess their own advantages and disadvantages. End-channel alignment is the easiest to implement but can suffer from band broadening due to dispersion of the analyte plug once it exits the separation channel prior to detection. This can greatly reduce separation efficiency and make it more difficult to resolve closely migrating peaks. Also, the band broadening can lead to a reduction in sensitivity. Using a decoupler in the off-channel configuration leads to higher separation efficiencies since the electrode is in the channel [21]. In the positive polarity separation mode, a Pd decoupler can be employed to adsorb the H2 gas generated by the cathode. Unfortunately, a Pd decoupler cannot be used in a reverse polarity separation because the anode (decoupler) generates O2 not H2 from water.
The third approach requires the use of an electrically isolated potentiostat. This makes it possible to place the working electrode directly in the separation channel without a decoupler. The benefit of this approach is that it reduces band broadening while maintaining detector sensitivity. It is also possible to perform separations in reverse polarity without developing a decoupler that will adsorb oxygen. While a few reports have demonstrated the use of electrically isolated potentiostats to perform amperometric detection in microfluidic devices [25, 26], none have focused on applications using negative polarity separation for small electroactive anions. One application reported the indirect detection of non-electroactive anions using reverse polarity with an in-channel electrode alignment [27].
This paper focuses on the characterization and application of a microchip electrophoresis device employing a wireless isolated potentiostat to perform the separation and in-channel amperometric detection of small electroactive anionic species using negative polarity separation voltages and a cationic surfactant for modification of the electroosmotic flow. The effect of the separation voltage on the observed half-wave potentials, as well as a comparison of separation efficiencies, limits of detection (LOD), and sensitivity to that of end-channel alignment are presented.
2 Materials and methods
2.1 Materials and reagents
The following chemicals and materials were used as received: SU-8 10 photoresist and SU-8 developer (MicroChem Corp., Newton, MA, USA); AZ 1518 photoresist and 300 MIF developer (Mays Chemical Co., Indianapolis, IN, USA); photolithography film mask (50,000 dpi; Infinite Graphics Inc., Minneapolis, MN, USA); N(100) 100 mm (4”) silicon (Si) wafers (Silicon, Inc., Boise, ID, USA); borosilicate float glass (4”× 1.1 mm; Precision Glass and Optics, Santa Ana, CA, USA); Pt film coated glass substrates (2000 Å Pt layer over 200 Å Ti, The Stanford Nanofabrication Facility, Stanford, CA, USA); Sylgard 184 Silicone Elastomer Kit: polydimethylsiloxane (Ellsworth Adhesives, Germantown, WI, USA); titanium (Ti) etchant (TFTN; Transene Co., Danvers, MA, USA); epoxy and Cu wire (22 gauge; Westlake Hardware, Lawrence, KS, USA); Ag colloidal paste (Ted Pella, Inc., Redding, CA, USA); acetone, 2-propanol (isopropyl alcohol, IPA), 30% H2O2, H2SO4, HNO3, NaOH and HCl (Fisher Scientific, Fair Lawn, NJ, USA); sodium nitrite (NaNO2), boric acid, TTAB, AA, Tyr, and GSH (Sigma, St. Louis, MO, USA); peroxynitrite (ONOO-, Cayman Chemicals, Ann Arbor, MI, USA). All water used was ultrapure (18.3 MΩ·cm) (Millipore, Kansas City, MO, USA).
2.2 PDMS fabrication
The fabrication of PDMS-based microfluidic devices has been described previously [8]. Briefly, SU-8 10 negative photoresist (for electrophoresis channels) was spin-coated on a 100 mm Si wafer to a thickness of 15 ± 1 μm using a Cee 100 spin coater (Brewer Science, Rolla, MO, USA). The wafer was then transferred to a programmable hotplate (Thermo Scientific, Asheville, NC, USA) for a soft bake at 65°C for 2 min and then 95 °C for five minutes. Microfluidic channel designs were created using AutoCad LT 2004 (Autodesk, Inc., San Rafael, CA, USA) and printed onto a transparency film at a resolution of 50,000 dpi (Infinite Graphics Inc., Minneapolis MN, USA). The coated wafer was covered with the transparency film mask and exposed to 344 mJ/cm2 using an i-line UV flood source (ABM Inc., San Jose, CA, USA). Following the UV exposure, the wafer was post-baked at 65°C for 2 min and 95°C for 10 min. The wafer was then developed in SU-8 developer, rinsed with IPA, and dried under nitrogen. A final “hard-bake” was performed at 175°C for 2 h. The thickness of the raised photoresist, which corresponds to the depth of the PDMS channels, was measured with a surface profiler (Alpha Step-200, Tencor Instruments, Mountain View, CA, USA). PDMS microstructures were made by casting a 10:1 mixture of PDMS elastomer and curing agent, respectively, against the patterned Si master. A simple “T” device containing a 5 cm separation channel (from the T intersection to the end of the separation channel) and 0.75 cm side arms was used for these studies. The width and depth of the electrophoresis microchannels were 50 μm and 14 μm, respectively. Holes for the reservoirs were created in the polymer using a 4 mm biopsy punch (Harris Uni-core, Ted Pella Inc., Redding, CA, USA).
2.3 Platinum electrode fabrication
The Pt electrodes used for EC detection consisted of a 200 Å Ti adhesion layer followed by a 2000 Å Pt electrode layer deposited on a glass substrate by the Stanford Nanofabrication Facility. Positive photoresist (AZ 1518) was dynamically applied to the Pt coated glass plate at 100 rpm for 5 s. The spin coater was then ramped to a final speed of 3500 rpm and held for 30 s to yield a photoresist thickness of 2.0–2.2 μm. The photoresist was soft baked at 100°C for 2 min and then exposed to 86 mJ/cm2 using an i-line UV flood source and the appropriate transparency mask. After exposure, the plate was developed for ~30 s in 300 MIF developer and then rinsed thoroughly with 18.2 MΩ cm H2O and blown dry with N2. A final hard bake was performed at 100°C for 10 min.
The remaining photoresist on the plate served to protect the underlying metal from the subsequent acid-etch procedure. Pt metal was removed by immersion in 85°C aqua regia (3:1:6 H2O/HCl/HNO3) for ~30 s or until no Pt metal could be seen. Ti metal was removed by immersing the plate in Ti etchant held at 95°C for ~ 45 s or until no remaining metal could be seen. After completion of the metal etching procedure, the remaining photoresist was removed by rinsing the plate with acetone, followed by IPA, and drying with N2. Wire leads for the electrodes were made by fixing bare Cu wire on the plate with quick-set epoxy. Bonding between the Cu wire and the Pt electrodes was accomplished using Ag colloidal paste.
2.4 Chip construction
The layer of PDMS containing the separation channel was aligned and reversibly sealed to the glass plate containing the Pt electrode. For end-channel detection, the working electrode was placed 10–20 μm outside of the separation channel in the ground reservoir. For in-channel detection, the electrode was placed 1–5 μm upstream from the end of the separation channel. The exception was the HDV experiments, where the electrode was placed 10 μm upstream and downstream from the end of the channel for in-channel and end-channel configurations, respectively. This made for a more direct comparison of the behavior of the two alignments equidistant from the end of the channel.
2.5 Solution preparation
The NO2− (10 mM) stock solutions were prepared weekly by dissolving NaNO2 in ultrapure water. Stock solutions of H2O2 (10 mM), Tyr (10 mM), GSH (10 mM) and AA (10mM) were all prepared in ultrapure water and stored at 4°C. Subsequent dilutions of each stock solution for use in the microchip system were made in the appropriate run buffer at the time of analysis. ONOO- standards were stored at −80°C for no longer than two months and thawed on ice before use. Once thawed, the ONOO− was diluted fourfold in cold (4°C) 0.3 M NaOH (per the vendor’s instructions) to yield a solution of approximately 10 mM. 10 μL of 10 mM ONOO- solution was further diluted into 990 μL of run buffer for analysis. Verification of this concentration was established by measuring the absorbance of the ~10 mM solution at 302 nm using an extinction coefficient (ɛ) of 1670 cm −1M −1 (ɛ information provided by the vendor).
2.6 Electrophoresis procedure
Electrophoretic separations were carried out on the device using a gated injection method. Two negative high voltage leads were placed in the sample and buffer reservoirs, while two earth ground leads were placed in the sample waste and buffer waste reservoirs. Gated injections were carried out by floating the high voltage at the buffer reservoir, which allowed the high voltage in the sample reservoir to deliver sample into the channel intersection of the microchip. To stop an injection, the high voltage in the buffer reservoir was reestablished. All data were collected using 1 s injections. The separation buffer consisted of 10 mM boric acid with 2 mM TTAB at pH 11. This buffer was previously optimized for end-channel detection of ONOO- by our group. In this case, the TTAB is only used to reverse the EOF and is present at concentrations below the critical micelle concentration [8].
2.7 Electrochemical detection
EC detection was accomplished using a modified model 8151BP 2-channel wireless, electrically isolated potentiostat (Pinnacle Technology Inc., Lawrence, KS, USA) operating in a two-electrode format (Pt working; Ag/AgCl reference (Bioanalytical Systems, W. Lafayette, IN, USA)) at 5 Hz sampling rate (Gain = 5,000,000 V/A, Resolution = 30 fA). Pinnacle Acquisition Laboratory (PAL) software was used for all data acquisition. The data acquisition was performed by wireless data transmission from potentiostat.
3 Results and discussion
The use of an electrically isolated potentiostat for ME-EC makes it possible to place the working electrode directly in the separation channel in the presence of a high voltage without generation of excessive noise and/or damaging the potentiostat electronics. However, with the in-channel configuration the separation potential has a significant effect on the observed E½. Previous reports have shown that the high voltages used for separations in both capillary [22, 28] and microchip electrophoresis [26] create a negative bias that shifts the apparent E½ several hundred millivolts when performing amperometric detection in the oxidative mode. These reports all employed conventional separations where the high voltages used for separation were positive polarity. In these cases, a positive shift in the apparent E½ occurred, requiring higher potentials to be applied to the working electrode in order to oxidize analytes.
It can be expected that when using negative polarity to perform separations a positive bias will be imposed on the working electrode, creating an opposite shift in the E½. Xu et al. reported this phenomenon using ME-EC with indirect detection of anions [27]. Figures 2 A and B depict the effect of electrode placement on the observed E½ for the oxidation of NO2− and H2O2 using reversed polarity separation. As the working electrode potential is increased, we see an increase in response of each analyte peak until a maximum current (peak height) is obtained. In the end channel configuration (Figure 2A and B), the working electrode is almost completely decoupled from the separation voltage and there is minimal bias imposed on the electrode. The E ½ values for NO2− and H2O2 were found to be approximately 1050 mV and 700 mV vs. Ag/AgCl, respectively, for end channel configuration. However, when the working electrode is placed in the in-channel configuration, the observed half-wave potentials are shifted negative by approximately 500 mV for both NO2− and H2O2 (Figure 2A and B). As expected, the use of the negative polarity separation potentials creates a positive bias on the working electrode, reducing the apparent potential required to produce an oxidative current.
Figure 2.
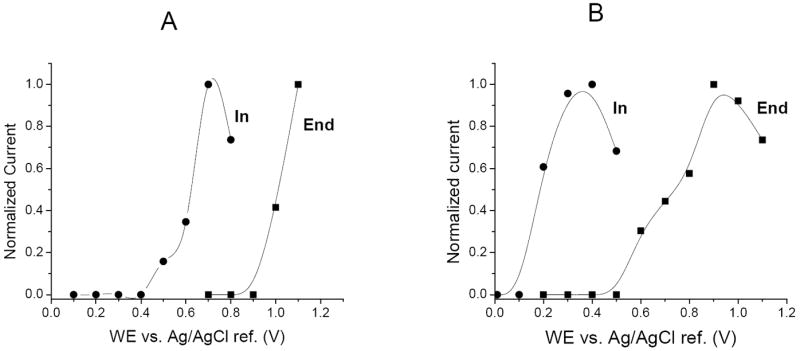
HDVs for in-channel and end-channel detection of NO2− (100 μM) and H2O2 (100 μM). Separation voltages were −1400 V and −1200 V for both in-channel and end-channel configurations.
A major benefit of the in-channel electrode alignment is the increased separation efficiencies that are obtained. When employing an end-channel electrode configuration, band broadening can be a significant problem, leading to a loss of resolution between analyte peaks as well as a reduction in detector response. To demonstrate the improvement in resolution afforded by in-channel alignment, a separation of two analytes (GSH and AA) that migrate very close to one another under our separation conditions was performed using both end-channel and in-channel detection. As can be seen in Figure 3A, using an end-channel alignment, GSH and AA migrate as a single wide peak. However, using the in-channel alignment, the two peaks are nearly resolved (R = 1.3), allowing proper identification and quantitation to be performed. Figure 3B shows another separation of two closely migrating peaks. As can be seen in the electropherogram, Tyr and AA are barely resolved using end-channel (R = 0.9). However, using in-channel, the two peaks were almost baseline-resolved (R = 1.2).
Figure 3.
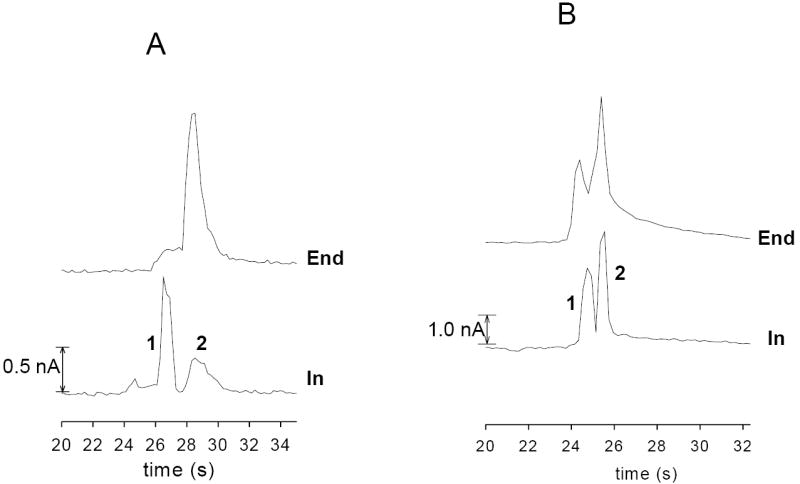
In-channel and end-channel detection of closely migrating species. (A) separation of AA (50 μM, peak 1) and GSH (50 μM, peak 2); (B) separation of Tyr (50 μM, peak 1) and AA (50 μM, peak 2). Separation voltages were −2400 V and −2200 V for both in-channel and end-channel configurations. A WE potential of +750 mV for in-channel and +1100 mV for end-channel vs. Ag/AgCl was applied.
To evaluate the separation performance of in-channel electrode configuration for its eventual application to cellular analysis, the separation and detection of five electroactive analytes that are markers for oxidative stress and/or possible interfering analytes present in cells was performed. In these experiments, the WE was placed in channel, but as close as possible to the exit to minimize the influence of the separation field on the WE. For end-channel detection, the electrode was placed 10–20 μm away from the channel exit. Figure 4 shows electropherograms obtained for a mixture of NO2− (100 μM), Tyr (30 μM), AA (40 μM), GSH (100 μM), and H2O2 (100 μM) using ME-EC in the end-channel (4A) and in-channel (4B) configurations. With the end-channel configuration, AA and GSH are not resolved, and there is a noticeable reduction in peak height for all of the species (Figure 4A). Figure 4B shows the same sample separated using the in-channel configuration. In this case, AA and GSH are completely resolved, and the peak heights for both NO2− (Figure 4B peak 1), and H2O2 (Figure 4B peak 5) are higher.
Figure 4.
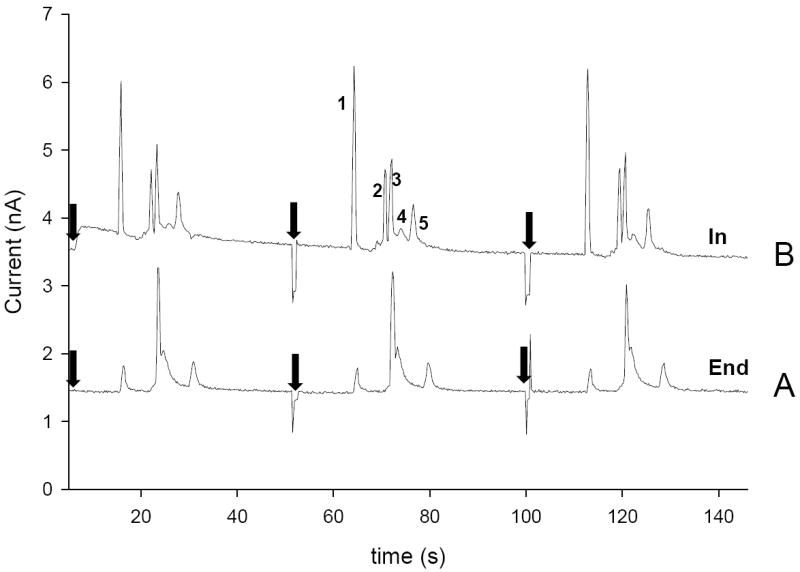
Comparison of (A) end-channel and (B) in-channel separation of NO2− (100 μM, peak 1), Tyr (30 μM, peak 2), AA (40 μM, peak 3), GSH (100 μM, peak 4), H2O2 (100 μM, peak 5). Separation voltages were −2400 V and −2200 V for both in-channel and end-channel configurations. A WE potential of 1100 mV vs. Ag/AgCl was used in both in-channel and end-channel detection. (
 – new injection)
Another observation was that the background currents for the two methods were very similar. The background currents shown for the separations in Figure 4 A and B are actual experimentally observed values. For in-channel detection the background was 3.5 nA while 1.5 nA was observed for end-channel alignment. This is evidence that the background for the in-channel alignment is not significantly increased due to the high voltage separation field.
The resolution for the separation using end-channel detection can be improved by moving the electrode closer (less than 5 μm) to the end of channel. This can be accomplished using the isolated potentiostat employed in these studies, but would destroy the electronics of a conventional grounded potentiostat. Fisher et al. investigated the effect of electrode placement with end-channel detection and a conventional potentiostat [21]. They observed a significant increase in separation efficiency when the electrode was placed 10 μm from the end compared to 20 μm [21].
The LODs for NO2− (Figure 4 peak 1) at a S/N = 3 were determined using both in-channel and end-channel alignment to be 2.6 ± 0.1 μM and 6.2 ± 0.5 μM, respectively. As shown in Table 1, the peak-to-peak noise and LODs for in-channel and end-channel channel alignments were similar. However, the sensitivity was approximately twofold higher for in-channel alignment. Separation efficiencies of approximately 80,000 plates/m for NO2− and 160,000 plates/m for H2O2 were obtained using in-channel detection. The N values observed for end-channel detection were significantly lower, with N values of 50,000 plates/m for NO2− and 130,000 plates/m for H2O2.
Table 1.
Comparison of peak-to-peak noise, LOD, sensitivity, and N for in-channel and end-channel configurations using NO2− (100 μM).
| Species | Alignment | Peak-to-peak noise (pA) | LODb at S/N = 3 (μM) | Sensitivityb (pA/μM) | Na (Plates/m) |
|---|---|---|---|---|---|
| NO2− | In | 25 | 2.6 ± 0.1 | 30 ± 1 | 80,000 |
| End | 30 | 6.2 ± 0.5 | 18 ± 1 | 50,000 |
Calculated from Figure 4
Standard deviation was calculated for 3 consecutive injections in a same microchip (n = 3)
Hulvey et al. previously reported using microchip electrophoresis with end-channel amperometric detection as a method to monitor the transient reactive nitrogen species ONOO−[8]. Figure 5 shows the separation of a ONOO− standard using in-channel alignment. The in-channel detection exhibited better resolution and higher separation efficiencies than those previously reported by Hulvey et al.[8]. The use of in-channel alignment will allow a more accurate quantitation of ONOO− in complicated matrices.
Figure 5.
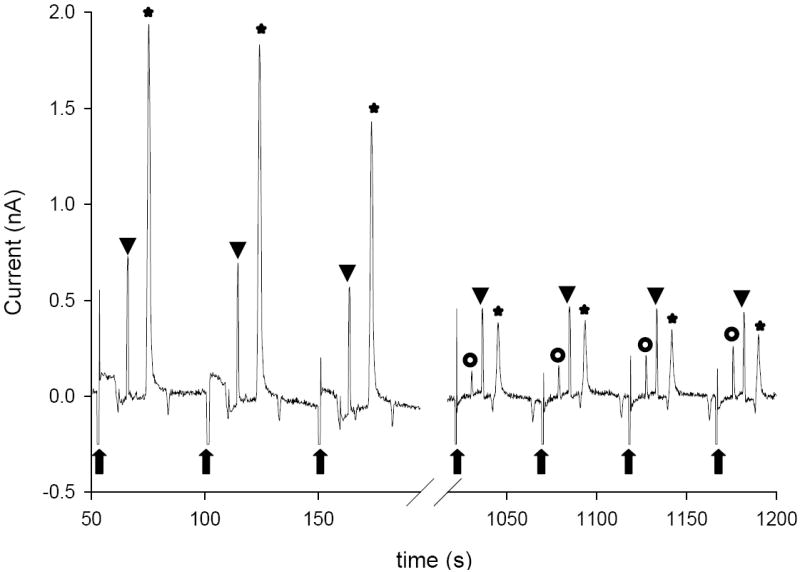
In-channel separation of ONOO− (100 μM) standards (
 – new injection, ★ – ONOO−, ▼ – NO2− and
 – unknown). Other conditions as in Figure 4.
An additional useful feature of the electrically isolated potentiostat used in these studies is that it employs wireless data transmission. This attribute will be especially useful in applications in which the analytical device is in a different location than the analyst. Examples include remote sensing of hazardous substances [5, 6], point-of-care testing in Third World countries and separation-based sensors for on-animal monitoring of neurotransmitters [4, 6].
4 Concluding remarks
This paper demonstrates the advantages of employing an electrically isolated wireless potentiostat in order to perform in-channel amperometric detection on a microchip electrophoresis device. In particular, it is possible to place the working electrode in the separation channel without increased noise or damage to the potentiostat. This makes it possible to take advantage of the full promise of both the highly efficient method of electrophoretic separation and the high sensitivity of amperometric detection. The potentiostat was employed for the detection of small anions under reverse polarity separation conditions. These conditions are not compatible with off-channel detection using a Pd decoupler due to the formation of oxygen gas at the anode. The effect of the separation field on the observed half-wave potentials of two electroactive species was investigated. The results showed that the optimal working electrode potential for any application involving in-channel detection will have to be experimentally determined in order to compensate for the bias placed on the working electrode. The high separation efficiencies and sensitivity of the in-channel detection method will be exploited for the determination of electroactive RNS and ROS in cellular analyses. The wireless capabilities of the potentiostat also make it useful for remote sensing applications and on-animal analysis.
Acknowledgments
The authors would like to thank Pinnacle Technologies, Lawrence, KS, for the development of the isolated potentiostat. The authors acknowledge the Stanford Nanofabrication Facility for providing Pt-deposited glass plates. The authors also appreciate the assistance of Professor Jose Alberto Fracassi da Silva with calculations and manuscript preparation, David Fischer and Anne Regel for the preparation of figures, Ryan Grigsby for assistance in microfabrication, and Nancy Harmony for editorial assistance. The authors gratefully acknowledge support from the NIH through projects RO1 NS042929 and R21 NS061202. MKH would like to thank the American Heart Association for postdoctoral fellowship support.
Abbreviations
- AA
ascorbic acid
- EC
electrochemical detection
- ɛ
extinction coefficient
- GSH
reduced glutathione
- HDV
hydrodynamic voltammetry
- IPA
2-propanol
- N
number of theoretical plates
- PDMS
polydimethylsiloxane
- RNS
reactive nitrogen species
- ROS
reactive oxygen species
- Tyr
tyrosine
- WE
working electrode
Footnotes
The authors have declared no conflict of interest.
References
- 1.Hulvey MK, Lunte SM, Fischer DJ, Kuhnline CD. Encyclopedia of Analytical Chemistry. 2010 in press. [Google Scholar]
- 2.Xu J-J, Wang A-J, Chen H-Y. TrAC,Trends in Anal Chem. 2007;26:125–132. [Google Scholar]
- 3.Kuban P, Hauser PC. Electrophoresis. 2009;30:3305–3314. doi: 10.1002/elps.200900217. [DOI] [PubMed] [Google Scholar]
- 4.Lunte S, Nandi P, Regel A, Grigsby R, Hulvey M, Scott D, Naylor E, Gabbert S, Johnson D. Micro TAS. 2010 Paper ID No: 0844. [Google Scholar]
- 5.Berg C, Valdez DC, Bergeron P, Mora MF, Garcia CD, Ayon A. Electrophoresis. 2008;29:4914–4921. doi: 10.1002/elps.200800215. [DOI] [PubMed] [Google Scholar]
- 6.Arora A, Simone G, Salieb-Beugelaar GB, Kim JT, Manz A. Anal Chem. 2010;82:4830–4847. doi: 10.1021/ac100969k. [DOI] [PubMed] [Google Scholar]
- 7.Amatore C, Arbault S, Bouton C, Drapier J-C, Ghandour H, Koh ACW. ChemBioChem. 2008;9:1472–1480. doi: 10.1002/cbic.200700746. [DOI] [PubMed] [Google Scholar]
- 8.Hulvey MK, Frankenfeld CN, Lunte SM. Anal Chem. 2010;82:1608–1611. doi: 10.1021/ac902821v. [DOI] [PMC free article] [PubMed] [Google Scholar]
- 9.Lacher NA, Lunte SM, Martin RS. Anal Chem. 2004;76:2482–2491. doi: 10.1021/ac030327t. [DOI] [PubMed] [Google Scholar]
- 10.Mecker LC, Martin RS. Electrophoresis. 2006;27:5032–5042. doi: 10.1002/elps.200600401. [DOI] [PubMed] [Google Scholar]
- 11.Kuhnline CD, Gangel MG, Hulvey MK, Martin RS. Analyst. 2006;131:202–207. doi: 10.1039/b511153f. [DOI] [PubMed] [Google Scholar]
- 12.Pasas SA, Lacher NA, Davies MI, Lunte SM. Electrophoresis. 2002;23:759–766. doi: 10.1002/1522-2683(200203)23:5<759::AID-ELPS759>3.0.CO;2-4. [DOI] [PubMed] [Google Scholar]
- 13.Fanguy JC, Henry CS. Analyst. 2002;127:1021–1023. doi: 10.1039/b205980k. [DOI] [PubMed] [Google Scholar]
- 14.Garcia CD, Henry CS. Anal Chem. 2003;75:4778–4783. doi: 10.1021/ac034440v. [DOI] [PubMed] [Google Scholar]
- 15.Garcia CD, Henry CS. Anal Chim Acta. 2004;508:1–9. [Google Scholar]
- 16.Mecker LC, Martin RS. Anal Chem. 2008;80:9257–9264. doi: 10.1021/ac801614r. [DOI] [PMC free article] [PubMed] [Google Scholar]
- 17.Kovachev N, Canals A, Escarpa A. Anal Chem. 2010;82:2925–2931. doi: 10.1021/ac9029218. [DOI] [PubMed] [Google Scholar]
- 18.Wang J, Pumera M, Chatrathi MP, Escarpa A, Musameh M, Collins G, Mulchandani A, Lin Y, Olsen K. Anal Chem. 2002;74:1187–1191. [PubMed] [Google Scholar]
- 19.Ding Y, Garcia CD, Rogers KR. Anal Lett. 2008;41:335–350. [Google Scholar]
- 20.Gertsch JC, Cropek DM, Henry CS. Anal Chem. 2010;82:3426–3429. doi: 10.1021/ac9029086. [DOI] [PubMed] [Google Scholar]
- 21.Fischer DJ, Hulvey MK, Regel AR, Lunte SM. Electrophoresis. 2009;30:3324–3333. doi: 10.1002/elps.200900317. [DOI] [PMC free article] [PubMed] [Google Scholar]
- 22.Matysik F-M. J Chromatogr A. 1996;742:229–234. [Google Scholar]
- 23.Chen D-c, Hsu F-L, Zhan D-Z, Chen C-h. Anal Chem. 2001;73:758–762. doi: 10.1021/ac000452u. [DOI] [PubMed] [Google Scholar]
- 24.Osbourn DM, Lunte CE. Anal Chem. 2003;75:2710–2714. doi: 10.1021/ac026354l. [DOI] [PMC free article] [PubMed] [Google Scholar]
- 25.Chen C, Hahn JH. Anal Chem. 2007;79:7182–7186. doi: 10.1021/ac070721h. [DOI] [PubMed] [Google Scholar]
- 26.Martin RS, Ratzlaff KL, Huynh BH, Lunte SM. Anal Chem. 2002;74:1136–1143. doi: 10.1021/ac011087p. [DOI] [PubMed] [Google Scholar]
- 27.Xu J-J, Peng Y, Bao N, Xia X-H, Chen H-Y. Electrophoresis. 2005;26:3615–3621. doi: 10.1002/elps.200410401. [DOI] [PubMed] [Google Scholar]
- 28.Wallenborg SR, Nyholm L, Lunte CE. Anal Chem. 1999;71:544–549. doi: 10.1021/ac980737v. [DOI] [PMC free article] [PubMed] [Google Scholar]


