Abstract
Noncontact, capacitive electrocardiogram (ECG) measurements are complicated by motion artifacts from the relative movement between the ECG electrodes and the subject. To compensate for such motion we propose to employ first and second order gradiometer electrode designs. A MATLAB-based simulation tool to enable assessment of different electrode configurations and placements on human subjects has been developed to guide the refinement of electrode designs. Experimental measurements of the sensitivity, motion artifact cancellation, and common mode rejection for various prototype designs were conducted with human subjects. Second order gradiometer electrode designs appear to give the best performance as measured by signal to noise plus distortion ratio. Finally, both gradiometer designs were compared with standard ECG recording methods and showed less than 1% beat detection mismatch employing an open source beat detection algorithm.
Index Terms: Body surface potential map (BSPM), capacitive sensors, charge preamplifier, common mode rejection ratio (CMRR), electrocardiography, modeling, motion artifacts
I. INTRODUCTION
Noncontact biosensors for cardiac monitoring are of great interest for a number of long-term health sensing applications ranging from exercise and fitness monitoring to management of chronic health conditions. However, the presence of motion-related artifacts and common-mode interference remains a challenging problem in practice [1]–[3]. The major challenges are: 1) common mode electromagnetic interference from power mains, 2) triboelectrically generated charge from rubbing of the electrodes on the subject’s clothing, 3) modulation of the bioelectric potential signals from motion-related source impedance changes, and 4) electronic noise. Methods that have been typically employed to address these challenges are as follows.
1) Interference from ac power mains may corrupt electrocardiograph signals due to low-common mode rejection ratio (CMRR) of the sensor system [4]. Interfering signals can be reduced by employing a driven right leg (DRL) connection, active shielding, and guarding of cables, and by employing a notch filter at the output.
2) Triboelectrically generated static charge caused by rubbing between the electrodes and the subject’s clothing has been discussed in [3]. Common-mode electrostatic charges on the body were also investigated in [5]. In addition to reducing movement at the electrode-subject interface, other ways to reduce this effect include careful choice of materials and providing a static charge discharge path at the electrode-subject interface.
3) The signal gain may be a function of the source capacitance and any stray capacitance at the preamplifier input, which can lead to baseline wandering and gain distortion. This effect can be minimized through employing a voltage mode preamplifier, as opposed to a charge-mode preamplifier; however, preamp noise then becomes a consideration.
4) The preamplifier immediately following the ECG electrode is the major contributor to the overall electronic noise level [1], [6] and may be addressed by employing careful preamplifier design.
Changes in source capacitance due to the relative motion of the electrodes and the subject leads to modulation of both the signals of interest as well as the aforementioned sources of interference and noise, which in turn may generate interference within the signal band of interest. This effect may be large enough in practical scenarios to completely obscure the ECG signal. In [2], the effect of motion artifacts by static common mode voltages has been investigated and the original ECG signal is reconstructed using known movement parameters measured by a secondary sensor placed near the ECG electrodes.
We have pursued an alternative approach in which gradiometer electrode designs are used to cancel common mode interference at the source. To explore the design space we have developed a (2 + 1)D human ECG potential map (2 spatial dimensions plus time) that allows for assessment of various electrode designs in terms of their signal sensitivity and their sensitivity to subject motion. In the following section we present the gradiometer electrode designs considered in this study. In Section III we discuss the simulations, including the placement of electrodes on the subject employing the (2+1)D, ECG potential map simulation tool, we then go on to present experimental results with various electrode designs on human subjects.
II. GRADIOMETER ELECTRODE DESIGNS
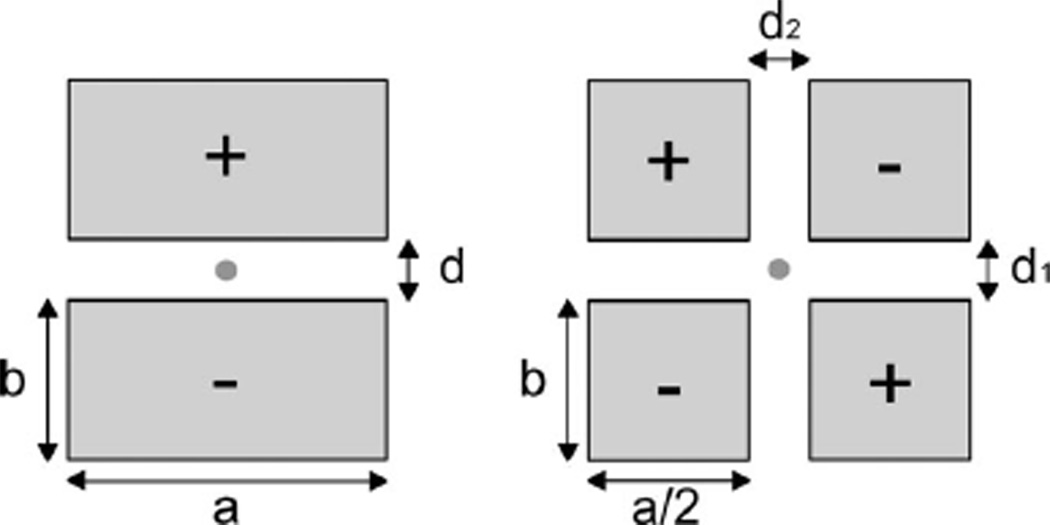
In conventional ECG configurations the relative motion of the electrodes is independent [7] and unpredictable, as in planar-fashionable circuit board electrodes [8]. To address this issue, we considered using first and second order gradiometer designs (see Fig. 1) in which two or four closely spaced electrodes are employed. Such gradiometric measurement schemes may enable cancellation of common mode signals at the point of sensing and thus, to a first approximation, are insensitive to common mode changes in the electrode array to subject distance. The first order sensor has two equally sized rectangular subelectrodes. The second order electrode array employs four equally sized subelectrodes. In the following we discuss the effects of the sizes and spacing between the electrodes on the sensor performance.
Fig. 1.
Two types of gradiometer electrode configurations were investigated. On the left a first order gradiometer dual electrode design is shown and on the right a second order quad electrode design is illustrated. The areas of the electrodes in a given configuration are equal but the electrode aspect ratio a/b and spacing are variable.
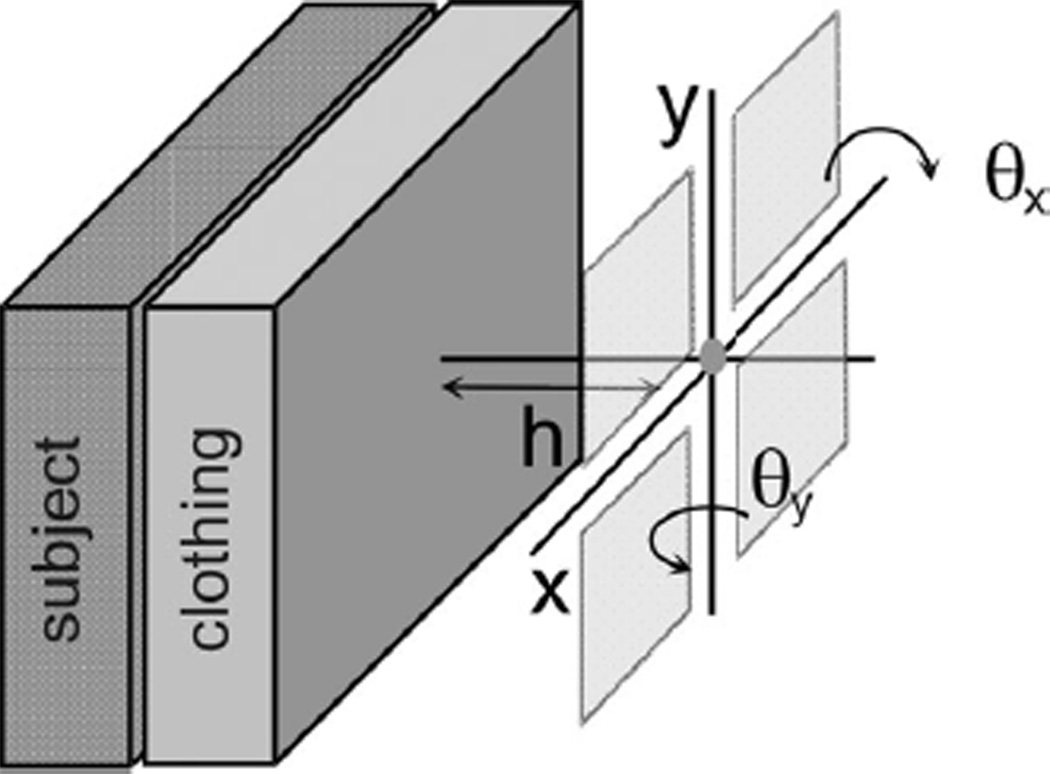
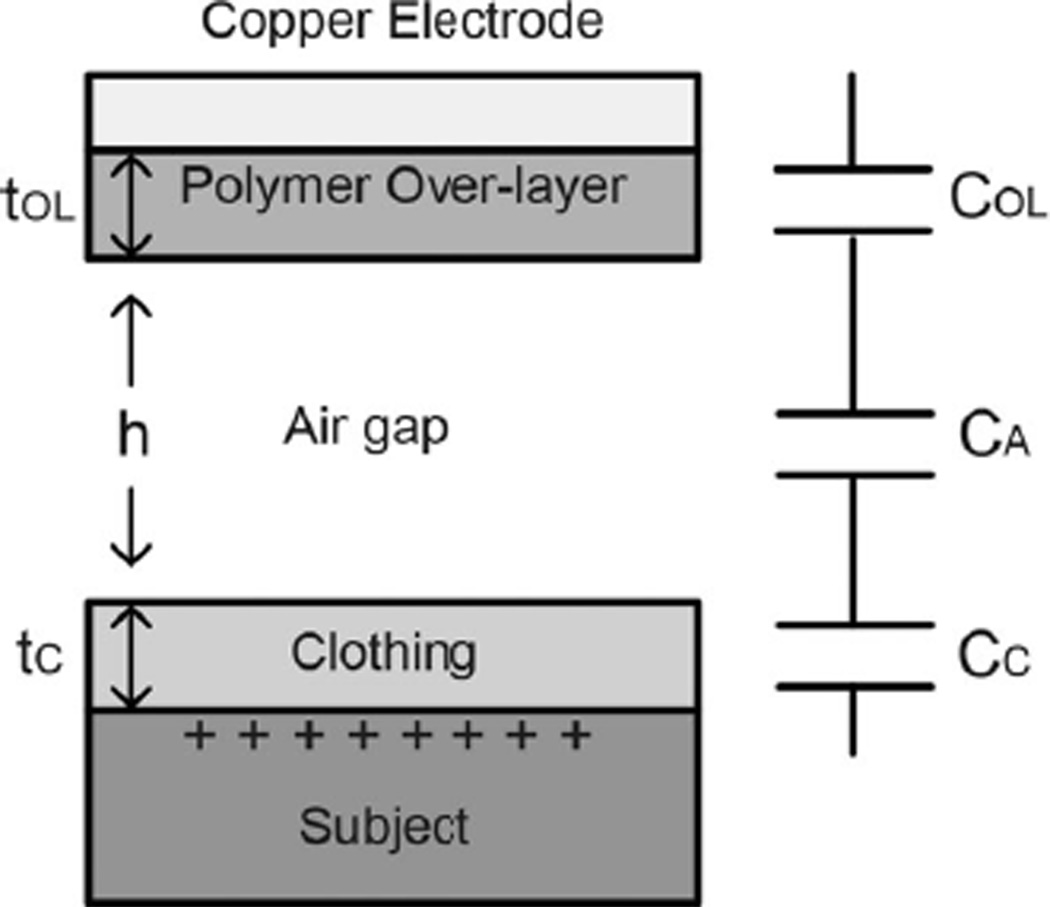
The output signal of the dual electrode configuration is given by taking the difference of the voltages of the two electrodes (marked + and −); in our implementation we employ two separate charge preamplifiers [9]. In the second order electrode configuration, the signals from diagonal pairs are added and the two sums are then subtracted, for which we employ four preamplifier channels. As illustrated in Fig. 2(a) the distance from the center of the electrode array to the subjects clothing is given by h and the rotation angles about the x- and y-axes (defined in the figure) are given by θx and θy. Changes in h, θx, or θy modulate the source capacitance by changing the gap between the sensor and the subject and to a lesser extent the projected area of the electrodes A(θx, θy). The total source capacitance is the series combination of the three capacitances COL, CA, and CC from the overlayer, air gap, and clothing respectively. See Fig. 3.
| (1) |
Fig. 2.
Definition of the orientation variables, where the rotation angles around the x- and y- axes are denoted θx and θy and the distance from the center of the electrode array to the subject’s clothing is given by h.
Fig. 3.
Total source capacitance is the series combination of the capacitance of the polymer overlayer COL, the air gap, CA, and the subject’s clothing CC.
In (1) A is the area of each subelectrode, A(θx, θy) is the projected area of the electrode, which is a function of θx and θy and ε0, εOLand εC are respectively the permittivity of free space, the relative permittivity of the electrode overlayer and the relative permittivity of the subject’s clothing. Finally, the effective gaps of the three capacitors are also indicated in Fig. 3.
To compare the performance of the first and second order gradiometer electrode configurations of various designs we compute the signal strength, the electronic noise, and the common mode distortion artifacts.
A. Electronic Output Noise
Each electrode is coupled to an independent charge preamplifier, which contributes independent electronic noise. The output noise power, , is given by the amplifier input noise power, , multiplied by the noise gain of the amplifier
| (2) |
where the noise gain Gn is defined as (Cs + Cf + Cin)/Cf above the low frequency roll-off frequency of 1/RfCf rad/sec. Both terms on the right of (2) are affected by the electrode orientation variables θx, θy, and h. It is assumed that the input noise current contribution of the preamplifier is negligible when using an ultralow input leakage current amplifier [9], thus the additive noise of the preamplifier dominates.
B. Common Mode Noise (CMRR Sensitivity)
The sensor common mode output is determined by the common mode gain, which is minimized by matching the source capacitances. The CMRR is therefore affected by the differential schemes in both gradiometer types and the smaller the differences of the source capacitances the less the sensitivity of the CMRR to relative motion. The motion-induced common mode distortion is defined as the difference between the sensor common mode output when there is electrode–subject relative motion and the output with no electrode motion. This may be expressed in (3) as
| (3) |
The power spectral density of this signal is then the Fourier transform of its autocorrelation function [10],
| (4) |
III. GRADIOMETER SIMULATION
To simulate the effects of motion on the sensor output, the (2 + 1)D body surface potential map (BSPM) has proven to be a useful source-modeling tool. The BSPM consists of high time-resolution recordings of ECG signals taken at several locations on a human subject’s torso [11]. Employing this data in simulations enables an investigation of subject to sensor relative motion for various electrode sizes, configurations, and sensor placement. Table I lists the parameters of the capacitive sensor modeled in the simulations.
TABLE I.
Simulation Parameters for the Capacitive Sensor
| Parameter | Value |
|---|---|
| Relative permittivity of overlayer εOL | 4.5 |
| Relative permittivity of cloth εC | 3.0 |
| Cloth thickness tC | 3 mm |
| Overlayer thickness tOL | 0.18 mm |
| θx, θy | 0° to 9° |
| h | 2.681 to 3 cm |
The minimum value of h was determined by the largest tilt angle possible for the largest sized electrodes.
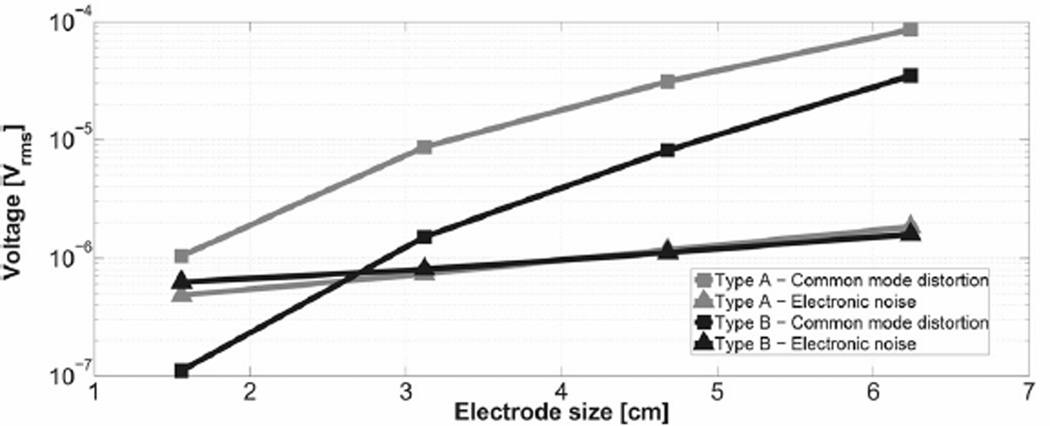
For comparison we computed the average of the electronic noise power in (2) and the motion-related distortion artifacts induced by common mode distortion in (4) resulting from all possible orientation vectors for the set of electrode sizes and configurations, Type A and type B. The former are four dual electrodes, while the later are four quad electrodes. Both designs have electrodes sized b = 1.56, 3.12, 4.68, and 6.24 cm with equal areas (for b = a/2 and d = d1 = d2 = 0.5 mm) as shown in Fig. 1. We assumed a fixed electrode to subject gap and a fixed electrode centroid location relative to the BSPM. Then the output signal was computed for the time-dependent surface potential over a set of possible electrode orientations. Results of the simulations are shown in Fig. 4. The electronic noise levels of the type A and type B sensors are similar; however, the average common mode distortion for the Type B sensor is always less than type A for all sensor sizes.
Fig. 4.
Simulation results of the motion-related gain distortion artifacts(Vrms) due to common mode distortion and the electronic noise for the type A and type B electrodes. Artifact from common mode distortion dominates as the electrode size is increased. Also note that Type B electrodes produce smaller total motion-related gain distortion artifact signals.
The simulation results shown in Fig. 4 averaged over various electrode sizes gives an average motion-related gain distortion signal of 31.6 μVrms for the dual electrode design (type A) and 11.2 μVrms for the quad electrode design (type B). Thus, the quad electrode design performs about 2.8 times better than the dual electrode design.
IV. GRADIOMETER EXPERIMENTS
A. Experiments on the Common Mode Signal
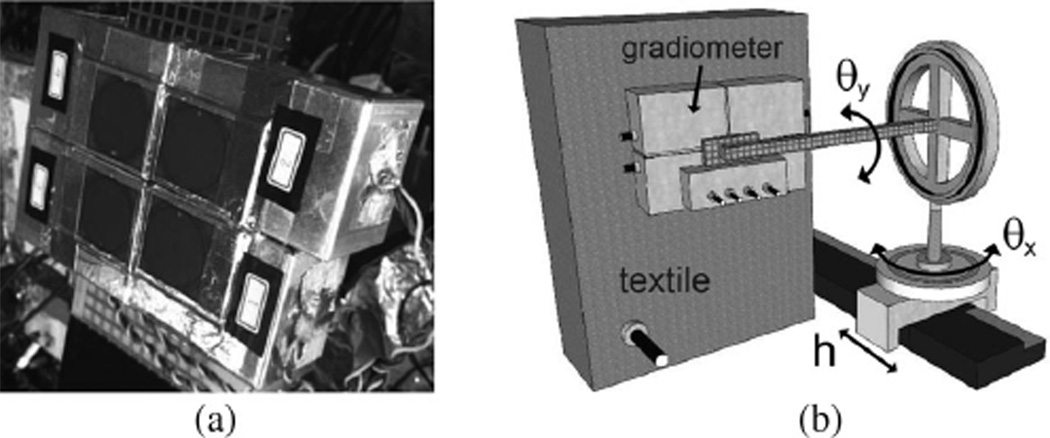
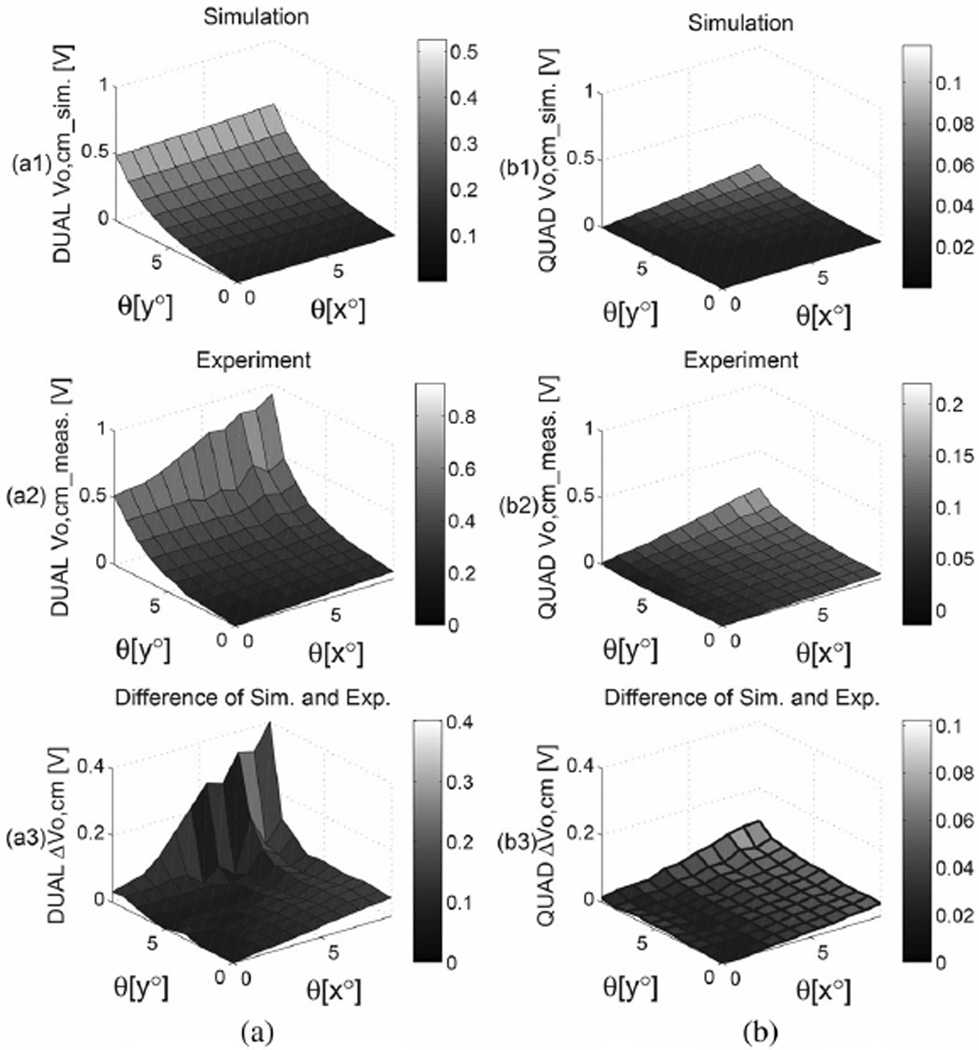
In order to verify the model a gradiometric sensor was mounted on a movable platform to give control of h and the rotation angles θx and θy. The gradiometer and experimental setup are shown in Fig. 5. The total sensor area for each type of gradiometer electrode was 4.41 cm2 with 0.5-mm in-plane spacing between electrodes. A 5 V 10 Hz sinusoidal signal was applied to an aluminum sheet covered in textile to serve as a surrogate for the subject. The sensor was held at a distance of 4.2 cm from the equipotential surface. Data were recorded over a tilt range from 0° to 9° in both θx and θy with Δθ = 0.9°. The measurements and simulation results are shown in Fig. 6. The differences between the measurements and the simulation may be due to additional fringe effects and static charge. Both simulations and the measurements show that the dual electrode configuration has a greater common-mode voltage than the quad electrode sensor, thus the quad sensor has improved immunity to common-mode signals, which is in agreement with the simulated result shown in Fig. 4.
Fig. 5.
(a) Gradiometer electrode with ILC3As. It was mounted on a movable platform. (b) Experimental setup.
Fig. 6.
Simulation and experiment for (a) dual electrode and (b) quad electrode. (a1) and (b1) are simulations of the common mode output for both electrodes tilted from 0° to 9° in both θx and θy. (a2) and (b2) are, respectively, the experimental measurements for the electrodes used to obtain the data shown in Fig. 5(b). (a3) and (b3) are the differences of the experimental data and the simulation for the dual and quad electrodes. The result shows that the quad electrode has better immunity to common mode noise.
B. Experiments on a Human Subject
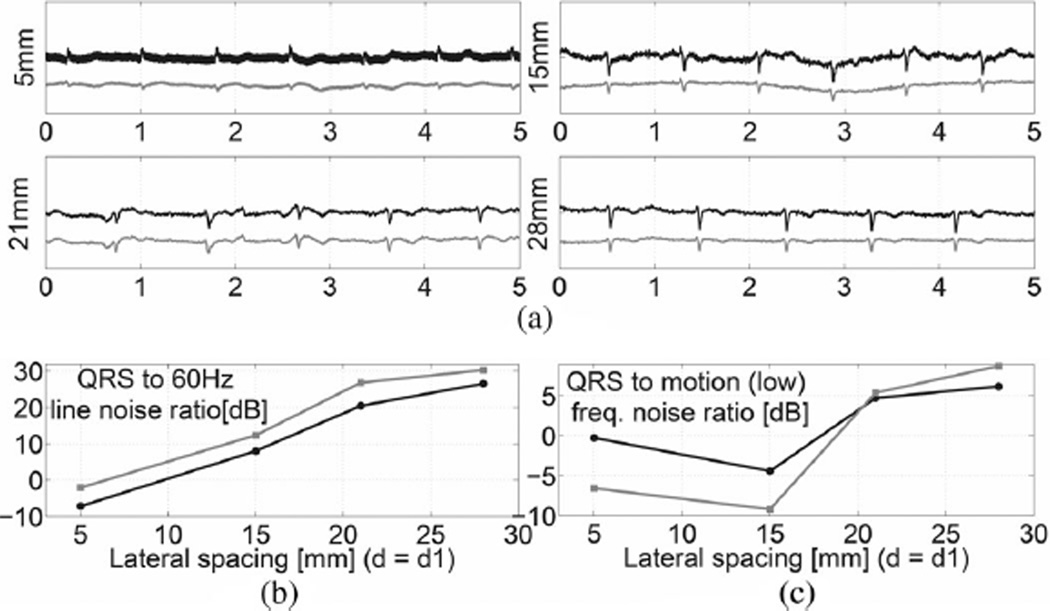
To demonstrate the proposed measurement schemes with a human subject we placed gradiometer sensors on a subject’s right chest. In order to obtain a fair comparison of the electrode configurations the lateral spacing of the quad electrode was chosen to be d2 = 0.5 mm (minimum lateral spacing) while its d1 value was chosen to be the same as d of the dual electrode. The adjustable lateral sizes were chosen as follows: d1 = d = 5, 15, 21, and 28 mm. The outputs for both sensor configurations are computed simultaneously. Fig. 7(a) is the final output following 0.5–100 Hz bandpass filtering. We note the following features in comparing the two gradiometer schemes.
Fig. 7.
(a) ECG measurements on a subject’s right chest for the dual (in black) and quad (in gray) electrodes with lateral spacing d1 = d = 5, 15, 21, and 28 mm for 5 s recordings. The unfiltered ECG signals all display common mode 60 Hz power line noise. (b) Ratio of the QRS complex signal (4–40 Hz) to the 60 Hz pickup (c) Ratio of the QRS complex signal power to low frequency motion signal power (0.5 to 1.1 Hz) is shown.
1) 60 Hz AC Power Mains
In order to compare the sensitivity of both gradiometers to common mode ac power line interference, the notch filter was turned OFF during the measurement. In Fig. 7(a), it is seen that signals display significant ac power noise. We computed the QRS complex signal to 60 Hz noise ratio shown in Fig. 7(b). The bandwidth of QRS complex signal was chosen to span 4–40 Hz, which captures most of the power in the signal spectrum. The data demonstrates that the quad electrode has better rejection of this common-mode signal.
2) Baseline Wandering
The effects on the low-frequency motion signal induced by respiratory activity can be expressed as the ratio of the QRS complex to the low-frequency signal as shown in Fig. 7(c). Here, the bandwidth of the motion artifact was selected to span 0.5–1.1 Hz. The result for this filter shows that the signal-to-motion artifact ratio is better for the dual electrode configuration at small electrode lateral spacings and the quad electrode performs better for larger spacing. To observe the response of the dual and quad electrode designs to even lower frequency events we employed a 0.01–100 Hz bandpass filter to record the signal. The result illustrated in Fig. 8 also indicates that the quad electrode demonstrated a greater reduction of movement-induced artifacts in comparison to the dual electrode design, even if the signal-to-motion artifact ratio is not improved. Therefore, the quad electrode design is less likely to be prone to output saturation. Noting the large, short time scale events in the first three traces of Fig. 8, we also see that the quad electrode design provides a greater degree of attenuation. This may be due to the fact that when both gradiometers were tilted the dual electrode summed up the triboelectricity signal sensed by two positive or negative subelectrodes, while the static charge signal generated on the quad electrodes was effectively subtracted out.
Fig. 8.
ECG recordings displaying motion artifacts. Four values of the lateral spacing of the electrodes in both the dual(in black) and quad (in gray) configurations were measured in 5 s, d1 = d = 5, 15, 21, and 28 mm. The output was bandpass filtered from 0.01 to 100 Hz.
3) R-Peak Amplitude
As seen in Figs. 7(a) and 8, the R-peak amplitude does not always become higher when the electrode lateral spacing increases. As an example consider the dual electrode signal shown in Fig. 7(a), R-peak (measured 0.8 V when d1 = d = 15 mm) which is larger than the R-peak (measured 0.5 V when d1 = d = 21 mm.) This is influenced by the precise location of the electrodes relative to the BSPM.
C. Experiments Compared With Standard ECG Setting
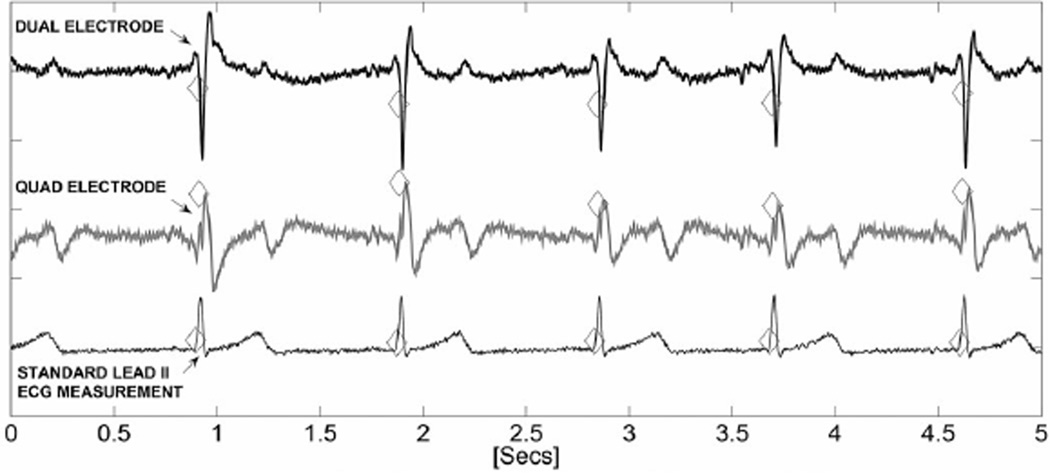
The reliability of heart beat monitoring was assessed by employing gradiometric electrodes of various geometries, as described in Section IV-B, placed on a person’s right and left chest. The signals were recorded and compared to conventional Ag/AgCl gel electrodes with the standard lead II placement [13]. A validated QRS-detector [12] algorithm was also applied to each recorded signal to track the heart rate. Fig. 9 shows the three traces (5 s duration) with beat annotations marked for d1 = d = 28 mm. Using the measured R-peak intervals, the average beats per minute (bpm) can be determined along with its standard deviation. Table II lists the results for 25 s recordings for each electrode spacing d. To compare results, two mismatch parameters, the mismatch of bpm from the dual electrode and the standard setting (ΔD) and the mismatch of bpm from the quad electrode and the standard setting(ΔQ) were calculated (as percentages).
| (5) |
| (6) |
Fig. 9.
ECG traces from gradiometer electrodes placed on the right chest with d1 = d = 28 mm and standard ECG lead II contact electrode recordings (5 s traces). All three traces were analyzed with an open source beat detection algorithm [12] and the detected beats are annotated.
TABLE II.
Heart Rate Measurement Comparison of the Gradiometric Electrode and Standard Lead II ECG
| Left chest | Left chest | Lead II | |||
|---|---|---|---|---|---|
| d | bpmDUAL | bpmQUAD | bpmStandard | ΔD | ΔQ |
| 5mm | 61.90±0.53 | 61.88±0.55 | 61.84±0.54 | 0.07% | 0.05% |
| 15mm | 65.70±0.51 | 65.30±0.55 | 65.21±0.56 | 0.63% | 0.10% |
| 21mm | 65.46±1.06 | 65.41±0.87 | 65.23±0.90 | 0.35% | 0.23% |
| 28mm | 65.58±1.34 | 66.01 ±1.27 | 65.70±1.33 | 0.19% | 0.40% |
| Right chest | Right chest | Lead II | |||
| 5mm | 61.58±0.54 | 61.63±0.63 | 61.89±0.48 | 0.42% | 0.42% |
| 15mm | 64.17±1.20 | 64.41±0.94 | 64.40±0.95 | 0.55% | 0.05% |
| 21mm | 64.69±0.97 | 64.19±0.86 | 64.33±0.99 | 0.46% | 0.82% |
| 28mm | 63.50±0.45 | 63.51±0.43 | 63.44±0.44 | 0.09% | 0.09% |
The results indicate that the highest mismatch rate among all trials is 0.82% which is very good agreement.
V. CONCLUSIONS
Although artifacts from the relative motion of noncontact ECG electrodes and the subject are problematic and have been addressed previously by a number of researchers, we have found that motion-related artifacts may be reduced considerably by employing gradiometric measurement techniques without employing the DRL method. Although this may lead to a robust and convenient heart rate monitor the relevance of short-base line ECG measurements in more sophisticated morphological analysis of ECG signals remains to be investigated clinically. Further exploration and design optimization clearly will be possible using the BSPM-electrode simulation tool.
Acknowledgments
This work was supported in part by Blue Highway, the New York State Foundation for Science, Technology, and Innovation, and in part by the Eunice Kennedy Shriver National Institute of Child Health Development Grant R01HD060789.
Contributor Information
GuoChen Peng, Electrical and Computer Engineering Department, University of Rochester, Rochester, NY 14627-0231 USA (gupeng@ece.rochester.edu).
Mark F. Bocko, Electrical and Computer Engineering Department, University of Rochester, Rochester, NY 14627-0231 USA (bocko@ece.rochester.edu).
REFERENCES
- 1.Chi Y, Jung T-P, Cauwenberghs G. Dry-contact and noncontact biopotential electrodes: Methodological review. Biomed. Eng. IEEE Rev. 2010 Dec.vol. 3:106–119. doi: 10.1109/RBME.2010.2084078. [DOI] [PubMed] [Google Scholar]
- 2.Ottenbacher J, Heuer S. Proc. World Congr. Med. Phys. Biomed. Eng. vol. 25/4. Munich; Germany: 2009. Sep. Motion artefacts in capacitively coupled ECG electrodes; pp. 1059–1062. 2010. [Google Scholar]
- 3.Wartzek T, Lammersen T, Eilebrecht B, Walter M, Leonhardt S. Triboelectricity in capacitive biopotential measurements. IEEE Trans. Biomed. Eng. 2011 May;vol. 58(no. 5):1268–1277. doi: 10.1109/TBME.2010.2100393. [DOI] [PubMed] [Google Scholar]
- 4.Webster JG. Medical Instrumentation, Application and Design. New York: Wiley; 2010. [Google Scholar]
- 5.Casas O, Pallas-Areny R. Electrostatic interference in contactless biopotential measurements. 2007 Aug;:2655–2658. doi: 10.1109/IEMBS.2007.4352875. [DOI] [PubMed] [Google Scholar]
- 6.Baxter L. Capacitive sensors, design and applications. Piscataway, NJ: IEEE Press; 1997. [Google Scholar]
- 7.Heuer S, Martinez D, Fuhrhop S, Ottenbacher J. Motion artefact correction for capacitive ecg measurement. Proc. IEEE Biomed. Circuits.Syst. Conf. 2009 Nov;:113–116. [Google Scholar]
- 8.Yoo J, Yan L, Lee S, Kim H, Yoo HJ. A wearable ECG acquisition system with compact planar-fashionable circuit board-based shirt. IEEE Trans. Inf. Technol. Biomed. 2009 Nov.vol. 13(no. 6):897–902. doi: 10.1109/TITB.2009.2033053. [DOI] [PubMed] [Google Scholar]
- 9.Peng G, Bocko M. A low noise, non-contact capacitive cardiac sensor. Proc. IEEE Annu. Int. Conf. Eng. Med. Biol. Soc. EMBC 2012. doi: 10.1109/EMBC.2012.6347114. Aug. 28-Sep. 1, 2012, to be publised. [DOI] [PMC free article] [PubMed] [Google Scholar]
- 10.Peyton J, Peebles Z. Probability, Random Variables, and Random Signal Principles. New York: Mcgraw-Hill; 2001. [Google Scholar]
- 11.Bond R. Xml-bspm: An xml format for storing body surface potential map recordings. BMC Med. Informat. Decis. Making. 2010;vol. 10:10–28. doi: 10.1186/1472-6947-10-28. [DOI] [PMC free article] [PubMed] [Google Scholar]
- 12.Hamilton P. Open source ecg analysis. Proc.Comput. Cardiol. 2002 Sep;:101–104. [Google Scholar]
- 13.Nursecom Educational Technologies. An ECG primer, [Online] 2003 Available: http://www.nursecom.com/ECGprimer.pdf.


