Abstract
Microinfarcts are a common clinical feature of the aging brain, particularly in patients with cognitive decline or vascular or Alzheimer's dementia. However, the natural history of these lesions remains largely unexplored. Here we describe a mouse (C57BL/6J) model of multiple diffuse microinfarcts induced by unilateral internal carotid artery injection of cholesterol crystals (40–70 μm). Microinfarcts were spread throughout the deep cortex, subcortical tissue, and hippocampus and were comprised of a core positive for CD68 (a marker for reactive microglia and macrophages), surrounded by large regions of glial fibrillary acidic protein-positive reactive astrogliosis. Widespread reactive gliosis, including mislocalization of the astrocytic water channel aquaporin 4 persisted long after injury, recovering only after 1 month after stroke. Within the cortex, neuronal cell death progressed gradually over the first month, from ∼35% at 3 d to 60% at 28 d after stroke. Delayed demyelination was also observed in lesions, beginning 28 d after stroke. These findings demonstrate that microinfarct development follows a distinct course compared to larger regional infarcts such as those induced by middle cerebral artery occlusion. The long-lasting gliosis, delayed neuronal loss, and demyelination suggest that the therapeutic window for microinfarcts may be much wider (perhaps days to weeks) than for larger strokes.
Introduction
Numerous neuropathological and neuroimaging studies demonstrate that microinfarcts are surprisingly common in the aging brain (Brundel et al. 2012). Within the broader aging population, incidence exceeds 30% (Vinters et al., 2000; Xuereb et al., 2000; Brayne et al., 2009), while in elderly patients suffering from mild cognitive decline or dementia the rates are nearly twice as high. Patients with mild cognitive decline exhibit a microinfarct incidence of ∼55% (Sonnen et al., 2007), and a rate of 60–70% is reported among those suffering from vascular dementia (Erkinjuntti et al., 1988; Esiri et al., 1997; Haglund et al., 2006). Demonstrating a causal relationship between cerebral microinfarcts and cognitive impairment, however, remains challenging because the literature is composed almost exclusively of community- or hospital-based autopsy studies focusing on elderly patients (Brundel et al., 2012), making it difficult to control for commonly occurring risk factors such as diabetes and hypertension.
Experimental analysis of the pathophysiological events leading to neuronal loss in microinfarcts lags far behind work focused on larger focal or global cerebral ischemia. In the classic focal cerebral ischemia model, the middle cerebral artery occlusion (MCAO), the ischemic infarct extends uniformly through a large portion of the ipsilateral cortex and striatum. Within 3 h of the onset of permanent ischemia, most of the potentially salvageable ischemic penumbra is absorbed into the infarct core and tissue injury is largely irreversible (Hossmann, 2012). Within the core of the lesion, neuronal loss is complete within the first 24 h after MCAO (Garcia et al., 1995), while nearby astrocytes become reactive and form a rim surrounding the infarct core (Li et al., 1995). Based on the evolution of ischemic injury after permanent MCAO, the likely therapeutic window for salvaging at-risk neurons and tissue is exceedingly short (Hossmann, 2012). In contrast, the microinfarcts associated with mild cognitive decline and vascular dementia are described most commonly as “microscopic” (Brundel et al., 2012), infiltrated with glial fibrillary acidic protein (GFAP)-positive reactive astrocytes and reactive microglia and macrophages positive for CD68 (a marker for reactive microglia and macrophages) (Erkinjuntti et al., 1988; Haglund et al., 2006; Sonnen et al., 2007; Okamoto et al., 2009). The evolution of these ischemic lesions remains largely undefined. Most importantly, it is not established whether neuronal death is limited to the first few hours of artery occlusion or whether it continues over a longer period. A more prolonged duration of neuronal loss in microinfarcts would not only suggest that the pathophysiological events are distinct, but also expand the therapeutic window for medical interventions. To begin to address these critical questions, well-defined and robust experimental models of diffuse microinfarction must be developed. Such models would also allow a better definition of the linkage between microinfarct development and cognitive decline.
We have here adapted a rat model of diffuse microinfarction (Rapp et al., 2008) to mice and characterized the evolution of the ischemic lesions through the acute and chronic injury stages. In this model, we report the occurrence of two distinct lesion types, delayed neuronal loss and myelin disruption, in addition to long-term reactive astrocytosis and microgliosis, associated with cognitive impairment.
Materials and Methods
For all experiments, 8- to 10-week-old (22–24 g) male C57BL/6J mice (Charles River Laboratories) and CX3CR1-GFP transgenic mice (strain B6.129P-Cx3cr1tm1Litt/J, JAX; backcrossed to Charles River C57BL/6J mice for five generations) were used. All experiments were approved by the institutional Animal Care and Use Committee of the University of Rochester and were performed according to guidelines from the National Institutes of Health.
Diffuse ischemia model.
Cholesterol crystals (Sigma) sized 40–70 μm were collected as described by Rapp et al. (2008) with the minor modifications described below. Free cholesterol crystals were filtered through 70 μm and then 40 μm cell strainers, and were then collected and counted with a hemocytometer.
Mice were randomly allocated into stroke and sham groups and anesthetized with ketamine and xylazine (50 and 10 mg/kg, i.p.) (Simard et al., 2006; Wu et al., 2012). The right common carotid artery (CCA), internal carotid artery (ICA), and external carotid artery (ECA) were carefully isolated under a dissecting microscope. The extracranial branch of the ICA was ligated with a 7-0 suture, and the distal portion of the ECA was permanently ligated. Microvascular clips were applied to the CCA and the proximal parts of the ECA and ICA, and an incision was made between the ECA ligation site and the ECA clip. Polyethylene (PE10) tubing was inserted into the ECA toward the CCA, and the microvascular clips were removed to restore blood flow. A total of 3500 ± 500 cholesterol crystals in 100 μl saline or 100 μl saline alone (for sham animals) were injected via the PE10 tubing. After injection, the tube was removed, and the proximal ECA was permanently ligated and the wound closed. Following stroke induction, animals were alert and moving within 2 h, and were closely monitored for the first 12 h following stroke.
Quantitative immunohistochemistry.
At 3, 14, or 28 d after surgery, stroke- or sham-treated animals were perfusion fixed with 4% paraformaldehyde. After overnight postfixation, 100 μm vibratome brain slices were cut, washed, and blocked with 3% normal donkey serum in PBS with 0.01% Triton X-100. Slices were incubated with one, two, or three of the following primary antibodies: mouse anti-GFAP (1:1000; Millipore), rabbit anti-GFAP (1:1000; Sigma), rat anti-CD68 (1:100, Serotec), rabbit anti-aquaporin 4 (AQP4; 1:500; Millipore), mouse anti-NeuN (1:200; Millipore), mouse anti-myelin basic protein (MBP; 1:1000; Covance), rabbit anti-platelet endothelial cell adhesion molecule [PECAM-1 (CD31); 1:200; Abcam], and rabbit anti Caspase-3 (1:500; Abcam). Secondary detection was performed with Cy2-, Cy3-, or Cy5-conjugated donkey anti-rabbit, mouse, or rat antibodies (1:500; Jackson Immunoresearch). Slices were mounted with Prolong Antifade Gold with DAPI (Invitrogen) and imaged by laser scanning confocal microscopy (FV500; Olympus). All images were acquired under the same imaging parameters (laser power, photomultiplier tube voltage and gain).
Consecutive 1 mm and 100 μm slices from stroke-treated brains were subjected to 2,3,5-triphenyltetrazolium chloride (TTC) labeling and immunolabeling, respectively, 24 h after injury. One millimeter slices were incubated in 2% TTC (Sigma) at 37°C for 15 min and then photographed. The 100 μm slices were immunolabeled against GFAP and CD68 as above and imaged by laser scanning confocal microscopy. At 3, 14, and 28 d after injury, the diffuse stroke mice were perfusion fixed with 4% paraformaldehyde. After overnight postfixation and cryopreservation, 20 μm cryostat sections were cut, and hematoxylin/eosin (H&E) staining was conducted.
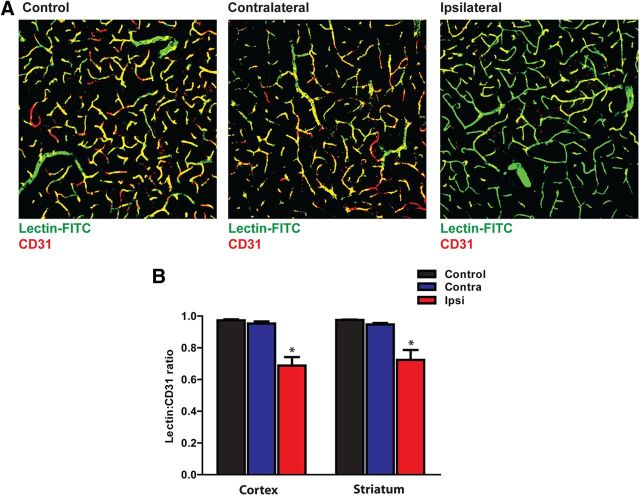
To determine what proportion of the cortical and striatal microvasculature was occluded in the present diffuse microinfarction model, 1 h after induction of diffuse ischemia, FITC-conjugated lectin (Sigma) was injected into the blood stream via a femoral artery catheter at a dosage of 7.8 μmol/g (Chang et al., 2000). Thirty minutes after injection, the animal was perfusion fixed, and 100 μm vibratome brain slices were cut and counterlabeled with anti-CD31 antibody. Five 40× confocal images were acquired randomly from both the contralateral and ipsilateral cortex and striatum (20 images per slice). Four slices were imaged in this way from each of four diffuse microinfarct- or sham-treated animals. Image analysis was conducted with ImageJ software. The total CD31-positive area of each image was calculated, and a CD31-positive mask was generated. The lectin-positive area of the CD31-positive mask was calculated and expressed as a percentage of the CD31-positive area. Double-positive regions corresponded to perfused vessels, whereas CD31-positive/lectin-negative areas corresponded to occluded vessels. The person performing image acquisition and image analysis was blinded to the experimental group of the slice.
Characterization of microinfarcts.
At 3, 14, and 28 d after stroke induction, brains were fixed and sliced. The 100 μm slices were serially distributed into four groups for immunolabeling: (1) GFAP and CD68 alone; (2) GFAP, CD68, and NeuN; (3) GFAP, CD68, and MBP; (4) GFAP, CD68, and AQP4. Slices were mounted and imaged by epifluorescence (for whole-slice montage generation) or laser scanning confocal microscopy. For whole-slice montage generations, slices were imaged at 4× objective power, and montages were generated using Microlucida software (MicroBrightField). All slice montages were acquired under the same imaging parameters (exposure and gain). Confocal images were generated at 40× objective power, and imaging parameters (photomultiplier tube voltage, gain) were maintained constant across compared groups. All image analysis was conducted with ImageJ software (NIH), and the person conducting image analysis was blinded to treatment group.
In slices labeled for GFAP and CD68 alone, CD68 and GFAP immunoreactivity were first measured. The slice montage images were uniformly thresholded, and the percentage of coverage of the ipsilateral hemisphere, cortex (Ctx), subcortical regions (striatum and thalamus; SCtx), hippocampus (Hipp), and subcortical white matter (WM) were calculated for CD68 and GFAP in each region. Values for each slice within an individual animal were integrated, the result being reported a single biological replicate. CD68 or GFAP labeling was compared between regions or at different time points by one-way ANOVA with Tukey's post hoc test to evaluate differences between individual groups.
Discrete CD68-positive lesions were counted and their relative distribution between different brain regions determined. A total of 116, 121, and 109 lesions were cataloged from animals 3 d (n = 7 animals), 14 d (n = 7 animals), and 28 d (n = 8 animals) after stroke, respectively. The CD68-positive lesion cores were projected to one of three representative anatomical brain slices to generate a lesion distribution map. Based on early analysis, we observed that lesions fell into two broad morphological classes: diffuse “incomplete” lesions and dense “cavitated” lesions. We tabulated the frequency of these lesion types within each brain region. The area of each lesion was calculated and plotted as a function of brain region or time after stroke. The effect of brain region on lesion size was analyzed by one-way ANOVA, with Tukey's post hoc test for comparison of individual groups. Differences in lesion size by lesion type and by time after stroke were analyzed by a two-way ANOVA with Bonferroni's post hoc test to compare differences between individual groups.
In slices labeled for GFAP, CD68, and the neuronal cell body marker NeuN, neuronal loss after stroke was quantified in both the cortex and striatum. Confocal images were generated at 40× objective power (211 × 211 μm) in regions centering on CD68- and GFAP-positive lesions and in mirror-image regions in the unaffected contralateral hemisphere. All NeuN-positive neurons within the imaging frames were counted in a blinded manner; image acquisition and counting were performed by different individuals. Counts were represented as the ipsilateral (lesion)/contralateral (unaffected) ratio. Images were also generated 200 μm from the lesion center, in regions that were CD68-negative but GFAP-positive. NeuN-positive neurons were counted. Neuronal counting was also conducted based on lesion type. All lesions were divided into two groups, incomplete lesions and cavitated lesions, based on the density of CD68 labeling and the presence of a defined GFAP-positive glial scar. NeuN-positive neurons were counted in these two different types of lesions using the method described above. Differences in ipsilateral/contralateral neuronal count ratios 3, 14, and 28 d after stroke were compared to control values by one-way ANOVA with Dunnett's post hoc test for multiple comparisons.
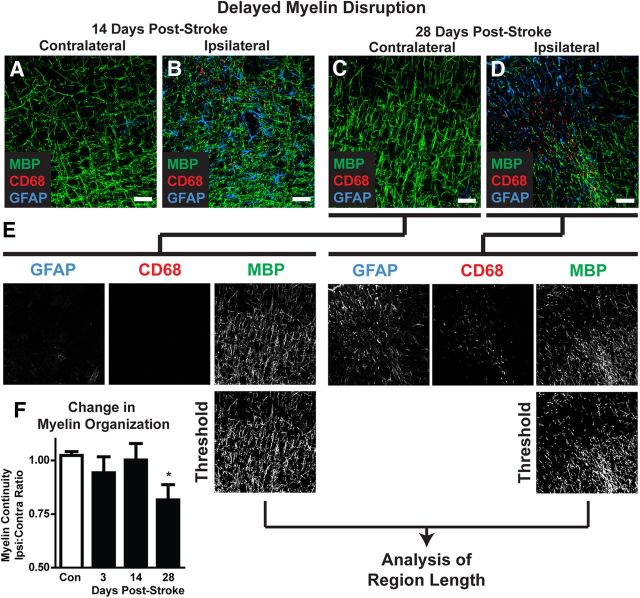
In slices labeled for GFAP, CD68, and the myelin marker MBP, myelin disruption after diffuse stroke was measured. Confocal images centering on CD68- and GFAP-positive lesions were generated as above. The color channels were separated, and the MBP channel was uniformly thresholded and converted to a binary image. The length of discrete continuous MBP-positive pixel regions was calculated and averaged in an automated fashion (ImageJ) to derive a mean arbitrary value for “myelin continuity” for each image (see Fig. 8E). These values were expressed as the ipsilateral/contralateral myelin continuity ratio and compared between controls and mice 3, 14, and 28 d after stroke as above.
Figure 8.
Delayed demyelination following diffuse ischemic stroke. A–D, Representative confocal images depicting MBP labeling in CD68- and GFAP-positive lesions 3 and 28 d after diffuse stroke injury. E, Changes in myelination were assessed by image analysis. Color channels were split, and the MBP channel was background subtracted, uniformly thresholded, and converted into a binary image. MBP-positive regions of interest (ROIs) were generated and the length calculated. The median ROI length was calculated and designated as an arbitrary value for “myelin continuity.” Myelin continuity was compared across time points by expressing the ratio between values measured in ipsilateral lesions versus mirror-image contralateral control tissue. F, Twenty-eight days after stroke, myelin continuity was significantly reduced compared to control values, reflecting delayed myelin degeneration. *p < 0.05 (ANOVA). Scale bars: 25 μm.
In slices labeled for GFAP, CD68, and the astrocytic water channel AQP4, mean AQP4 immunoreactivity was first calculated. Confocal images centering on CD68- and GFAP-positive lesions were generated as above. The color channels were separated, and the mean fluorescence intensity was calculated for each image. We also calculated the AQP4 expression polarity for each image. In this case, the color channels were separated, and each image was thresholded uniformly at two different levels—a high and a low stringency threshold. The low-stringency threshold defined the overall area of AQP4 immunoreactivity, whereas the high-stringency threshold defined the area of intense AQP4 immunoreactivity that in control mice is localized to perivascular end feet. The ratio of the low-stringency area to the high-stringency area was used to generate an arbitrary value defining “AQP4 polarity” (see Fig. 9E). The higher the AQP4 polarity, the greater proportion on immunoreactivity was restricted to perivascular regions, whereas the lower the proportion, the more evenly distributed immunoreactivity was between the perivascular end feet and the soma. AQP4 polarity values were expressed as the ipsilateral/contralateral ratio and compared between controls and mice 3, 14, and 28 d after stroke, as above. Differences at 3, 14, and 28 d were compared to control values by one-way ANOVA with Dunnett's post hoc test for multiple comparisons.
Figure 9.
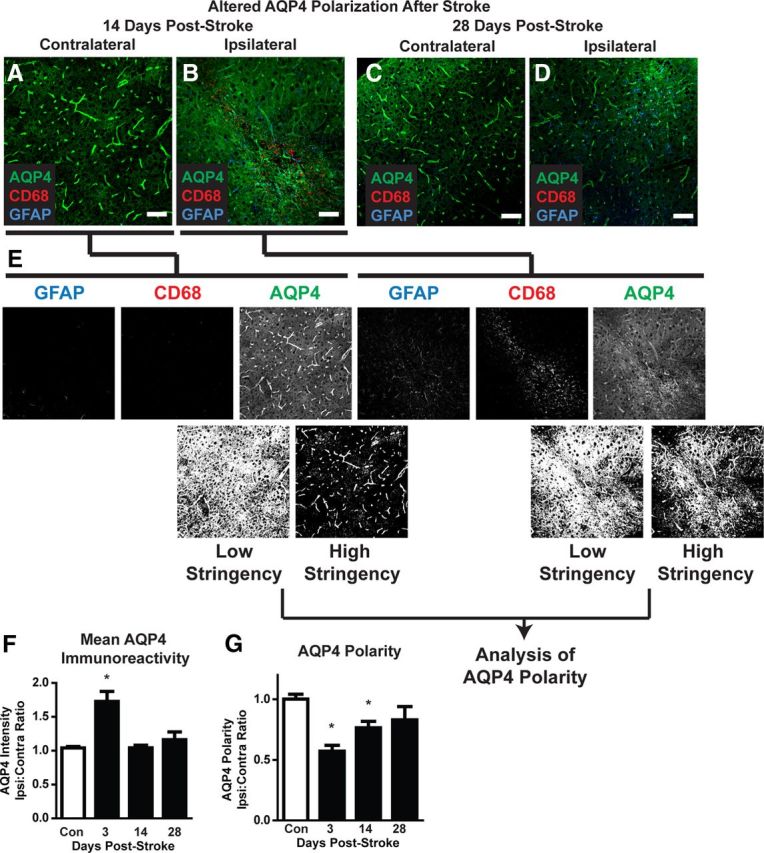
Dysregulation of astrocytic AQP4 expression after diffuse ischemia. A–D, Representative confocal micrographs showing AQP4 expression and polarization in CD68- and GFAP-positive lesions and in mirror-image contralateral regions 14 and 28 d after diffuse ischemic stroke. E, Changes in AQP4 polarization were measured by image analysis. Color channels were split, and the AQP4 channel was uniformly thresholded at two levels: low stringency and high stringency. Low stringency included all AQP4-immunoreactive pixels within the image. High stringency captured all pixels representing perivascular end feet, in addition to those with equal or greater intensity. An arbitrary value for “AQP4 polarity” was derived as the ratio between low stringency and high stringency areas. Higher AQP4 polarity values reflected expression levels of AQP4 in perivascular end feet being greater than in surrounding tissue, while lower AQP4 polarity values reflected greater parity between perivascular end foot AQP4 expression and AQP4 in nonperivascular portions of astrocytes. AQP4 polarity was compared across time points by expressing the ratio between values measured in ipsilateral lesions and mirror-image contralateral control tissue. F, Within 3 d of diffuse ischemic injury, mean AQP4 immunoreactivity was significantly increased compared to control levels. Mean intensity levels returned to baseline within 14 d of diffuse stroke injury. G, At both 3 and 14 d after diffuse ischemic injury, AQP4 polarization was significantly reduced compared to control values. Within 28 d, polarization had returned to control levels. *p < 0.05 (ANOVA). Scale bars: C–F, 50 μm.
Brain water content measurement.
Three days after stroke, anesthetized sham and stroke mice were decapitated and brains were dissected and immediately weighed. Brains were kept at 65°C for 48 h until they reached a constant weight. Brains were reweighed, and the brain water content was measured as follows: percentage water content = 100% × (wet weight − dry weight)/wet weight. Differences in brain water content between sham and stroke groups were compared by unpaired t test (n = 6 per group).
Intracranial pressure measurement.
Three days after stroke, a small burr hole was drilled with a dental drill in the center of the parietal bone, and the dura was punctured carefully to avoid damage to the underlying brain tissue. The pressure sensor (Millar Instruments) was inserted 300 μm into the cortex, and the burr hole and probe were sealed and secured with dental cement. The intracranial pressure (ICP) signal was digitized and recorded with a DigiData 1332A and PClampex9.2 software (Molecular Devices). The mouse was allowed to stabilize for 15 min, and then ICP was recorded continuously for 5 min. The mean value was recorded as the animal's ICP. Comparison between sham and stroke values was made by unpaired t test (n = 6 per group).
Blood–brain barrier function.
Three days after surgery, sham- and stroke-treated animals were anesthetized, and 15 μl 1% Alexa 647-conjugated ovalbumin [OA647; molecular weight (MW), 45 kDa] was injected into the blood through a femoral arterial catheter. Thirty minutes after injection, animals were perfusion fixed, brains sliced, and slices immunolabeled as above for GFAP and CD68. Lesions were identified by CD68 and GFAP immunoreactivity, and OA647 extravasation was imaged in and around defined lesions and was compared to mirror-image unaffected contralateral tissue (n = 3 sham, 3 stroke).
Evaluation of cognitive function following diffuse ischemic injury.
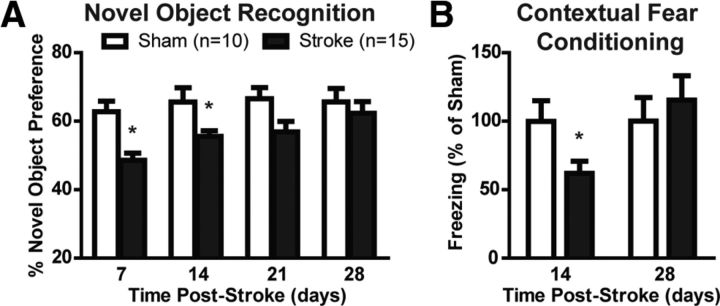
For all behavioral tests, the person conducting the test and the person coding behavioral data were blinded to treatment group. To evaluate whether induction of ischemic injury resulted in cognitive impairment, animals were subjected to the novel object recognition and contextual fear conditioning tests. The novel object recognition test was performed weekly after stroke or sham surgery according to the method previously described, with certain modifications (Ennaceur and Delacour, 1988; Ennaceur, 2010; Antunes and Biala, 2012). The experiments were performed over 2 consecutive days in a plastic cage (50 × 25 × 50 cm) with a camera attached. Mice were habituated to the test box for 10 min 1 d before the exploration session. In the first day, two identical objects were introduced in two corners (∼30 cm apart from each other), and the time spent exploring each object was recorded during a 5 min period (defined as the training session). In the second day, the mice were placed in same test environment while one of the familiar objects used in the previous training session was replaced with a novel object. The time spent exploring each object was recorded during a 5 min period, which defined as the test session. The animals were regarded to be exploring when they were facing, sniffing, or biting the object. The test box and objects were cleaned with 70% of ethanol between trials. A ratio of the time that mice spent exploring each objects in a whole 5 min period during the training session and a ratio of the time that the mice spent exploring each object in the first minute during the test were used to measure memory preference.
The contextual fear conditioning test was performed according to the method described previously with certain modifications (Gould, 2003; Gould and Lommock, 2003). At 14 and 28 d after surgery, mice were introduced into the test chambers and baseline freezing behavior was assessed for 120 s. An auditory conditioning stimulus was introduced with a 2 s 0.3 mA shock stimulus (delivered through metal rods in the floor), which was repeated once after 120 s. This defined the training session. On the second day, the freezing behavior was reassessed under the same paradigm, excepting that no shock was administered through the chamber floor. Animals exhibiting greater freezing behavior in response to the conditioned stimulus were regarded to have exhibited greater learning behavior. The evolution of cognitive deficits over time was compared between sham- and stroke-treated animals by two-way ANOVA with Bonferroni's post hoc test for multiple comparisons.
Mice were also subjected to an open field test to evaluate the presence of general motor deficits. Mice were tested 7 and 14 d following induction of diffuse stroke or sham operation. The test procedure was as described previously (Silverman et al., 2007) with modifications. Mice were placed in the open field apparatus (40 × 40 × 30 cm, with opaque plastic walls) with an attached camera that recorded mouse activity. Mice were placed in the area to become familiar with the environment for 1 min, and then were allowed to explore freely for 10 min. The distance traveled in the arena and time spent in the central and peripheral regions were recorded over the test session. Mouse activity during 10 min test period was analyzed using Any-Maze software (Stoelting).
Statistical analysis.
Data are presented as mean ± SEM. All statistics were performed using Prism software (GraphPad). The specific statistical tests used to compare different types of data are detailed with the methodological description. A p value <0.05 was considered statistically significant.
Results
Initial characterization of diffuse embolic stoke model and lesions
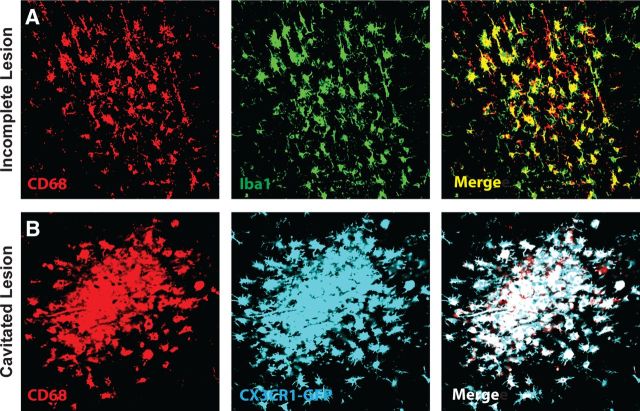
We first characterized the resulting lesion burden 3 d after induction of diffuse ischemic injury. After unilateral injection of cholesterol crystals into the internal carotid artery (Fig. 1A), small, well-defined lesions were apparent scattered largely unilaterally (<90% ipsilateral to the injection site) throughout the cortex, striatum, hippocampus, and subcortical white matter. These lesions were readily detectable by immunolabeling for CD68 (a marker for reactive microglia and macrophages) and were surrounded by extended regions of GFAP-positive reactive astrogliosis (Fig. 1B). H&E staining conducted 3 d after injury demonstrated abundant macrophage infiltration into the lesion sites (Figs. 1C,D, 2A–C). Immunolabeling of consecutive slices for GFAP and CD68 revealed that lesions detectable by H&E staining corresponded to CD68-positive lesions that were surrounded by reactive astrogliosis (Fig. 1E). We observed that CD68-positive labeling colocalized with Iba1 expression (Fig. 3A), and with endogenous GFP expression in Cx3Cr1-GFP reporter mice (Fig. 3B). Thus, the CD68-positive core of the observed microinfarcts corresponds with the presence of reactive microglia and macrophages.
Figure 1.
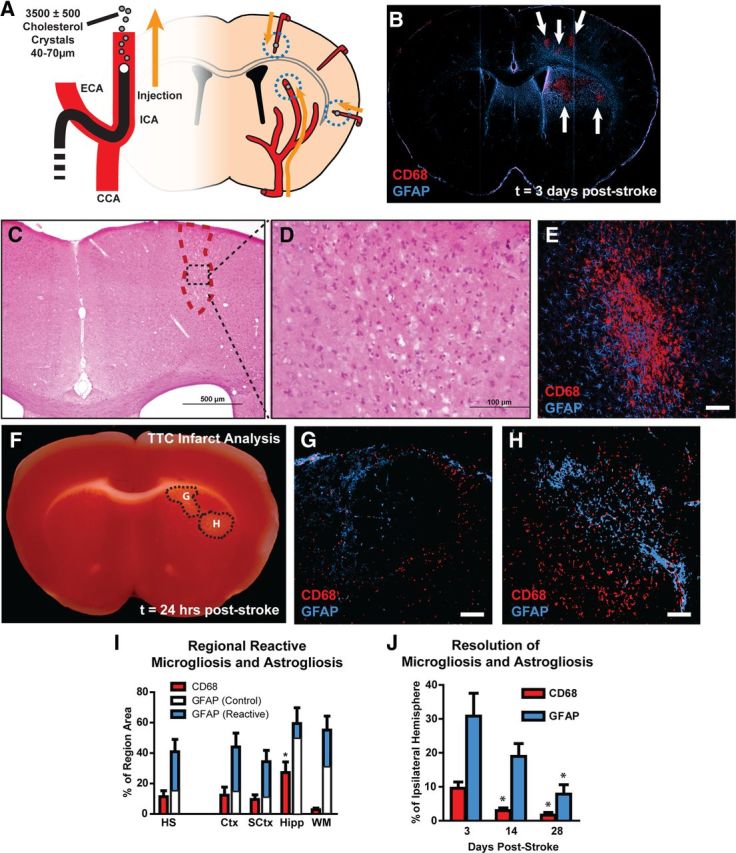
Widespread reactive gliosis surrounding diffuse ischemic lesions. A, Schematic of diffuse stroke model. A total of 3500 ± 500 cholesterol crystals (40–70 μm) were injected unilaterally via the ICA. Ischemic lesions formed along the deep segments of penetrating cerebral arteries. B, Ischemic lesions (arrows) are defined by immunolabeling against CD68 and GFAP. Lesions consist of CD68-poisitive cores surrounded by large areas of reactive astrogliosis. C, D, H&E staining 3 d after injury indicates a small columnar cortical lesion that with marked macrophage infiltration. E, CD68/GFAP immunolabeling of a consecutive slice demonstrates that microinfarcts apparent by H&E labeling are characterized by a CD68-positive core surrounded by a wide field of reactive astrogliosis. F–H, TTC staining and immunolabeling against CD68 and GFAP 24 h after stroke shows that lesions are detectible by TTC, and at this time point are surrounded by a rim of reactive microglia and astrocytes. I, Three days after stroke, CD68-immunolabeling (red bars) occupied a larger proportion of the hippocampus than other brain regions (*p < 0.05, ANOVA). GFAP immunoreactivity (blue bars) occupied large areas surrounding CD68-positive cores. White bars reflect control GFAP immunoreactivity in contralateral hemisphere. J, Fourteen days after ischemic injury, CD68-positive lesions occupied a smaller proportion of the ipsilateral hemisphere compared to 3 d (*p < 0.05, ANOVA). GFAP immunoreactivity was not significantly reduced from levels at 3 d until 28 d after stroke (*p < 0.05, ANOVA). HS, Hemisphere. Scale bars: 50 μm.
Figure 2.
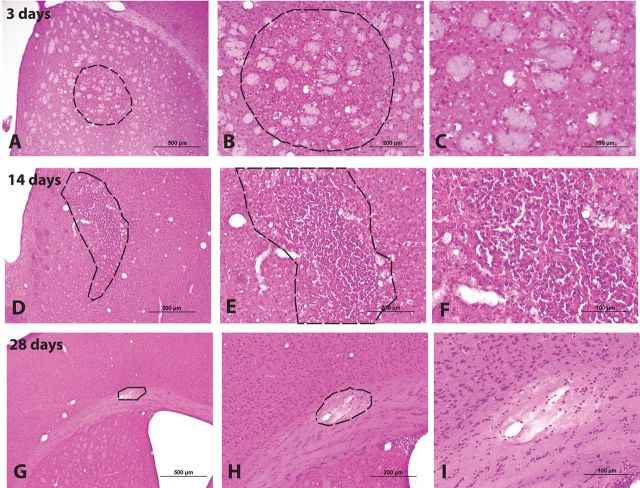
Characterization of diffuse microinfarction by H&E staining. Microinfarcts were evaluated by H& E staining 3, 14, and 28 d after injury. A–C, At 3 d after injury, macrophage infiltration into the lesion site is evident. D–F, Fourteen days after injury, fibrillary gliosis and pyknotic neuronal nuclei are observed. G–I, Within 28 d after injury, some cavitated lesions are surrounded by a defined glial scar and have become cystic.
Figure 3.
Confirmation of perilesional CD68 labeling with other microglial/ macrophage markers. A, Diffuse CD68 labeling of reactive microglia and infiltrating macrophages in incomplete and cavitated microinfarcts was confirmed by double labeling with the microglial/macrophage marker Iba1. Double labeling revealed extensive overlap between perilesional CD68 and Iba1 immunoreactivity. B, CD68 labeling was also conducted in CX3CR1-GFP reporter mice 3 d after diffuse microinfarction. All CD68 labeling colocalized with endogenous GFP fluorescence.
When immunolabeling and TTC staining were conducted in consecutive brain slices 24 h after diffuse ischemic injury, lesions identified by TTC labeling (Fig. 1F) were surrounded by a rim of reactive microglia and astrocytes (Fig. 1G,H). The TTC lesions differed from those conventionally observed for more regional ischemic insults in that they were smaller and did not appear completely white. This is likely the result of the incomplete nature of these diffuse lesions. At this early time point, CD68 labeling was not observed within the interior of the infarct, which is consistent with the occurrence of macrophage invasion into the infarct beginning >24 h after ischemic injury (Gelderblom et al., 2009).
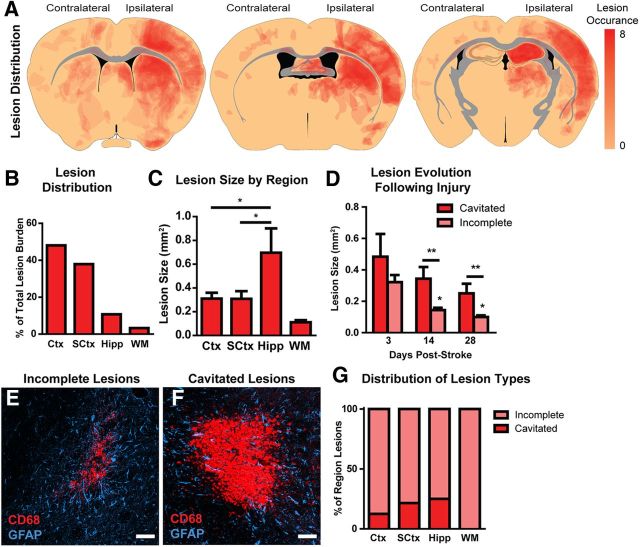
Overall lesion (defined as CD68-positive regions) burden of the ipsilateral hemisphere was ∼11% of the total hemispheric volume (Fig. 1I; n = 8 animals). The largest numbers of lesions were present in the cortex and striatum, with fewer observed in the hippocampus and only a small number of lesions apparent in the subcortical white matter tracks of the corpus callosum and internal and external capsules (see Fig. 5A,B). Lesion coverage and size did not differ between the cortex and subcortical regions, while hippocampal lesions were both larger (see Fig. 5C; p < 0.05 vs Ctx and SCtx; ANOVA) and occupied a greater proportion of tissue volume (Fig. 1I; p < 0.05 vs other regions; ANOVA). This may suggest that within the hippocampus, smaller individual lesions have merged to form larger compound lesions.
Figure 5.
Characterization of diffuse ischemic lesions. A, Heat map depicting CD68-positive lesion locations obtained from eight animals and projected onto three representative anatomical slices. Fewer than 90% of lesions occurred ipsilateral to the cholesterol injection. Note that this represents the aggregate lesion burden across all slices from all animals and does not represent lesion distribution within a single slice or single animal. B, The greatest proportion of individual lesions was present in the cortex and in the subcortical structures. Comparatively few lesions were observed in the hippocampus and the subcortical white matter. C, Lesions within the cortex, subcortical structures, and white matter did not differ in size, whereas hippocampal lesions were significantly larger. D, Diffuse incomplete lesions were significantly smaller in size than dense cavitated lesions. At 14 and 28 d after stroke, incomplete lesions were significantly smaller than at 3 d, while cavitated lesions did not differ significantly at any time point. E, F, Representative confocal micrographs depicting incomplete lesions (E) and cavitated lesions (F) labeled for reactive microglia (CD68) and reactive astrocyte (GFAP) markers. G, Distribution of incomplete and cavitated lesions throughout different brain regions. Cavitated lesions were most common in the hippocampus and were not observed in the subcortical white matter. *p < 0.05; **p < 0.01 (ANOVA). Scale bars: 25 μm.
When we evaluated the extent of microvascular occlusion that resulted from diffuse microinfaction, we found that in the hemisphere ipsilateral to the cholesterol injection, ∼30% of the microvasculature was not perfused (was not labeled by intravenous lectin; Fig. 4A,B; p < 0.05 vs control values; ANOVA). The regions of nonperfusion were typically small and spread widely throughout the cortex and striatum. Consistent with the observation that lesion burden did not significantly differ between these two regions (Fig. 1I), the proportion of perfused microvasculature did not differ between ipsilateral cortex and striatum (Fig. 4B). We observed no appreciable microvascular occlusion in the hemisphere contralateral to cholesterol injection. This is consistent with the fact that >90% of observed lesions appeared in the ipsilateral hemisphere.
Figure 4.
Evaluating the extent of microvascular occlusion after cholesterol crystal injection. Microvascular occlusion was evaluated 1 h after cholesterol injection by intra-arterial lectin injection and CD31 counterlabeling. A, Representative confocal micrographs depicting CD31-positive vascular endothelium (red) and lectin (red)-positive perfused vessels (yellow). Green vessels represent nonperfused vessels. Images were acquired from the ipsilateral and contralateral hemispheres of sham (control)- and diffuse microinfarction-treated animals. B, Quantification of the extent of lectin labeling of CD31-microvessels in the cortex and striatum. No significant reduction on vessel perfusion was observed in the contralateral hemisphere. A significant reduction in microvascular perfusion was observed in both the ipsilateral cortex and striatum (*p < 0.05 vs control; ANOVA).
At 3 d following diffuse stroke, two morphologically distinct lesion types were observed: diffuse incomplete lesions and dense cavitated lesions (Fig. 5E,F). Incomplete lesions were irregularly shaped areas of CD68-positive reactive microgliosis intermingled with and surrounded by GFAP-positive reactive astrocytes (Fig. 5E). Cavitated lesions were ∼2.5× larger than gliotic lesions (Fig. 5D) and had a well-defined lesional core that was filled with CD68-positive invading cells and was devoid of astrocytes (Fig. 5F). Cavitated lesions were immediately bounded by a rim of reactive astrocytes and, as with incomplete lesions, were surrounded by extended regions of reactive gliosis. Cavitated lesions were more commonly observed in the hippocampus or within deeper portions of the subcortex, while they were not observed within the white matter (Fig. 5G).
Three days after diffuse stroke injury, mild cerebral edema was apparent within affected animals. Whole brain water content was significantly increased from 76.9 ± 0.4% in sham-treated mice to 78.6 ± 0.4% in stroke-injured animals (Fig. 6A; p < 0.05, t test; n = 6 each group). ICP measured within the ipsilateral cortex was also slightly elevated from 22.1 ± 1.3 mmH2O in sham animals to 26.3 ± 1.3 mmH2O in animals following diffuse stroke injury (Fig. 6B; p < 0.05, t test; n = 6 each group). Highly localized blood–brain barrier disruption was observed 3 d after injury (Fig. 6C–E; n = 3 replicates). Following intravenous infusion of Alexa 647-conjugated ovalbumin (MW, 45 kDa), tracer extravasation into the parenchyma of mice following diffuse ischemia was evident in areas of CD68 immunoreactivity. The extent of blood–brain barrier disruption corresponded to lesion size, with small gliotic lesions exhibiting only limited disruption (Fig. 6C,D), while large lesions exhibited pronounced blood–brain barrier dysfunction (Fig. 6E). Similar results were observed when FITC-conjugated dextran (MW 3 kDa) was used to probe blood–brain barrier disruption (data not shown; n = 3 replicates).
Figure 6.
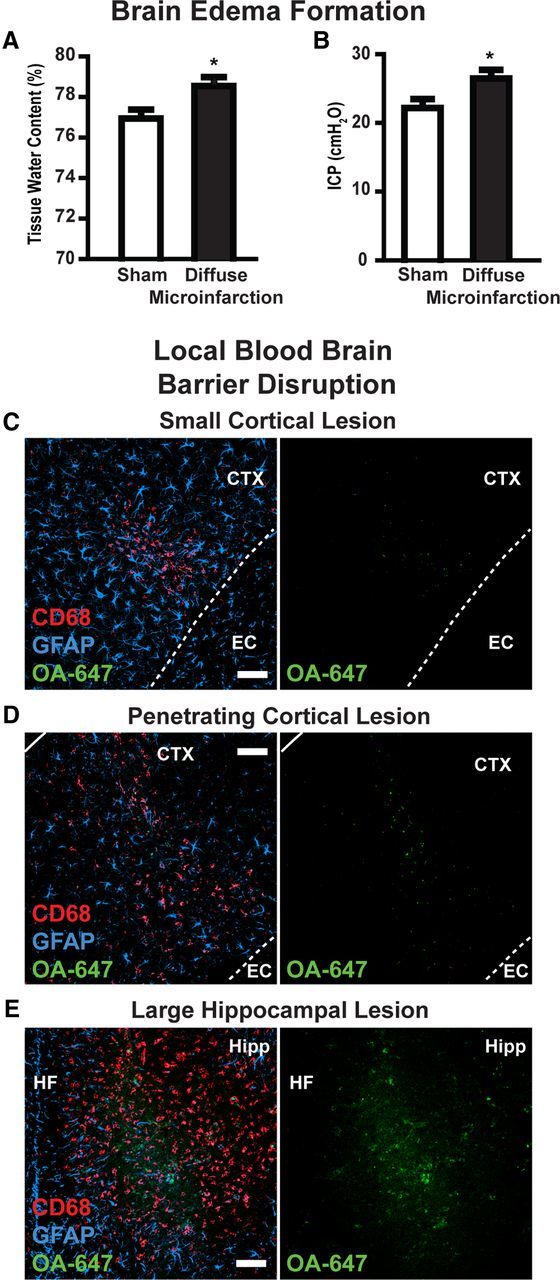
Edema formation and localized blood–brain barrier disruption. A, B, Three days after diffuse stroke induction, mild cerebral edema formation was observed. Tissue water content in diffuse stroke brains was significantly higher than in sham-treated brains (left). ICP was significantly higher in stroke-treated brains than sham controls (right). C–E, Blood–brain barrier disruption after stoke was evaluated by imaging extravasation of Alexa 647-conjugated ovalbumin (intravenously) in and around CD68- and GFAP-positive lesions. In small lesions, highly localized blood–brain barrier disruption was observed (C, D). In large lesions, more widespread blood–brain barrier was observed (E). EC, External capsule; HF, hippocampal fissure. *p < 0.05 (t test). Scale bars: 50 μm.
We next evaluated the evolution of these ischemic lesions in the chronic stage, including 14 and 28 d after the induction of diffuse ischemic injury. When evaluated by H&E staining, 2 weeks after stroke, widespread fibrillary gliosis was evident within and surrounding incomplete lesions, while pyknotic neurons were plainly evident (Fig. 2D–F). At the same time point, the CD68-positive lesion burden was significantly reduced, from ∼10 to ∼3% of the ipsilateral hemisphere (Fig. 1J; p < 0.05; ANOVA; n = 7 animals). The average size of incomplete lesions was reduced by >50% (Fig. 5D; p < 0.05 vs value at 3 d; ANOVA; n = 7 animals), while the sizes of cavitated lesions were not significantly altered. Thus, the stabilization of CD68-positive lesions at 14 d was driven largely by consolidation of incomplete, rather than cavitated lesions. Twenty eight days after injury, many lesions were characterized by glial scarring and internal cavitation (Fig. 2G–I). Compared to the dynamics of microgliosis after diffuse stroke injury, the resolution of reactive astrogliosis was more protracted, with significant reductions GFAP labeling only occurring after 28 d (Fig. 1J; p < 0.05 vs value at 3 d; ANOVA).
Evaluation of neuronal loss following diffuse stroke
We next tested whether the incomplete lesions and long-lasting gliosis caused by diffuse ischemic injury resulted in delayed neuronal death. CD68- and GFAP-positive lesions were identified 3, 14, and 28 d after ischemic injury. Neurons within the CD68- and GFAP-positive core were counted based on NeuN (neuronal nuclear antigen) labeling and normalized to counts obtained from mirror-image regions of the unaffected contralateral hemisphere. Within the cortex, lesions exhibited time-dependent neuronal death, from ∼35% at 3 d to ∼55% at 14 d to ∼60% at 28 d (Fig. 7B,E,F,H,I; p < 0.05 vs control; ANOVA; n = 5–6 animals). Importantly, statistically significant differences in neuronal counts were observed between 3 and 14 or 28 d (p < 0.05). Within subcortical regions, significant neuronal death was also observed following diffuse ischemic injury (Fig. 7B; p < 0.05 vs control; ANOVA); however, neuronal loss at 3 d (∼50%) was not significantly different from that at 14 or 28 (∼65%) days after stroke. When neurons were counted 200 μm from the lesion center, a region that exhibited GFAP but not CD68 immunoreactivity, low-level (∼5–8%) neuronal loss was observed in the cortex beginning at 3 d after injury (Fig. 7D; p < 0.05 vs control; ANOVA).
Figure 7.
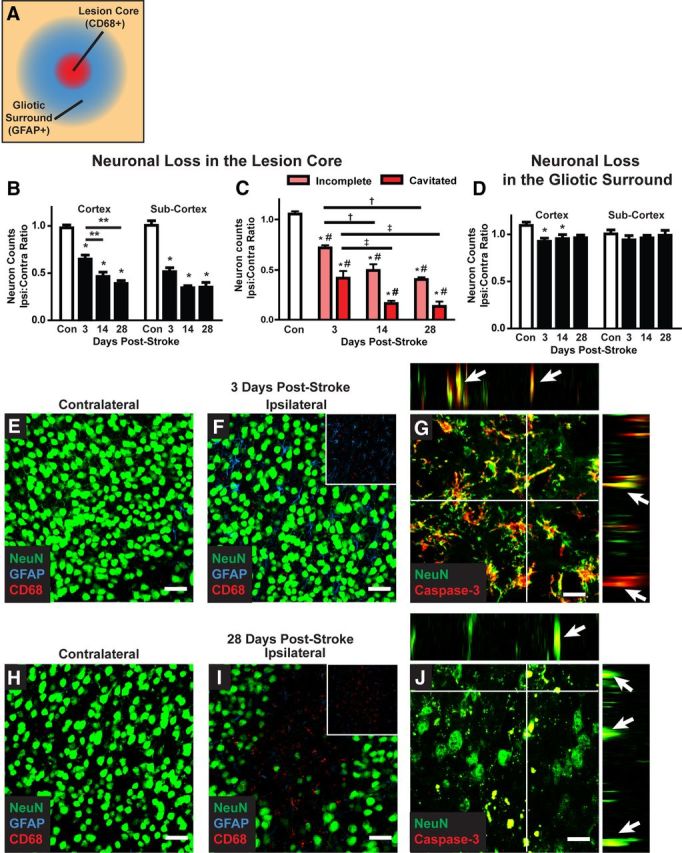
Delayed neuronal cell death after diffuse ischemic stroke. A, Neuronal cell death was evaluated by NeuN immunolabeling. Confocal images (40×; 211 × 211 μm) were generated centered upon CD68-positive cores of diffuse ischemic lesions and in areas 200 μm away that are characterized by an extended field of GFAP-positive reactive astrogliosis. All neurons within the image frame were counted. B, Within the CD68-positive lesion, neuronal cell death in the cortex and subcortical regions was significantly reduced 3 d after stroke (*p < 0.05; **p < 0.01 between time points; ANOVA). In the cortex, neuronal loss was significantly greater at 14 and 28 d after diffuse injury than at 3 d (*p < 0.05, ANOVA). C, When neuronal loss was evaluated based upon lesion type (incomplete vs cavitated), more rapid and complete neuronal loss was observed in cavitated lesions (*p < 0.05, lesion vs control; #p < 0.05, incomplete vs cavitated; †p < 0.05, vs 3 d incomplete; ‡p < 0.05, vs 3 d cavitated; ANOVA). D, In surrounding areas of reactive astrogliosis, a small but significant reduction cortical neuronal counts was observed (*p < 0.05, ANOVA). No difference in subcortical neuronal counts was observed. E, F, H, I, Representative confocal micrographs from CD68- and GFAP-positive lesions and mirror-image contralateral control regions 3 and 28 d after stoke. G, J, Representative NeuN/caspase-3 labeling at 3 and 28 d after injury shows ongoing neuronal cell death up to 28 d after injury. Orthogonal views from z stacks (x–z and y–z) demonstrate colocalization between NeuN and caspase-3 immunoreactivity. Scale bars: E, F, H, I, 25 μm; G, J, 12.5 μm.
Analysis of neuronal loss based on the type of lesion (incomplete vs cavitated) revealed a striking difference between incomplete and cavitated lesions. Cavitated lesions exhibited a more rapid and complete neuronal loss than did incomplete lesions, which underwent neuronal loss more gradually (Fig. 7C). In cavitated lesions, neuronal loss appeared to be complete within 14 d after injury. In contrast, even at 28 d after injury, neuronal loss within incomplete lesions was still ongoing. When caspase-3/NeuN double labeling was conducted, neuronal caspase-3 labeling remained evident within incomplete lesions 14 and 28 d after injury (Fig. 7G,J), confirming that apoptotic neuronal loss was still occurring at these late time points. Thus, following diffuse microinfarction, two distinct lesion types appear to evolve over markedly different trajectories: cavitated lesions exhibit stable lesion boundaries, complete glial scars, and rapid neuronal loss; incomplete lesions exhibit a slowly resolving reactive gliosis and ongoing neuronal loss.
Characterization of glial dysfunction following diffuse ischemic injury
In light of this persistent reactive gliosis and delayed neuronal loss, we surmised that myelination might be disrupted following diffuse ischemic insult. MBP labeling was conducted in brain slices 3, 14, and 24 d after induction of ischemic injury (Fig. 8A–D). Within CD68- and GFAP-positive lesions and unaffected contralateral tissue, myelin organization was analyzed and a value reflecting MBP continuity was derived as described previously (Fig. 8E). Compared to control slices, myelin continuity was significantly reduced only at 28 d after stroke (Fig. 8F; p < 0.05 vs control; ANOVA; n = 5–6 animals). Changes in myelination were observed in individual lesions at 3 and 14 d after injury, but these were inconsistent across the broader population of lesions (reflected in the higher variance in continuity values).
Following diffuse ischemic injury, widespread reactive astrogliosis was apparent 14 d after stroke (Fig. 1J) and remained detectable around lesion foci 28 d after injury. (Figs. 8D, 9D). One of the central functions of astrocytes following injury is the appropriate distribution of water within brain tissue, so we next evaluated the expression and polarization of AQP4 at 3, 14, and 24 d after stroke (Fig. 9A–D). Overall AQP4 expression levels in CD69- and GFAP-positive lesions were significantly increased 3 d following injury (Fig. 9F; p < 0.05 vs control; ANOVA; n = 5–6), but returned to baseline levels by 14 d after stroke. Under physiological conditions, AQP4 expression is highly polarized to perivascular astrocytic end feet, where it is presumed to mediate fluid entry into and efflux from the CNS. In addition to quantifying overall expression, we measured AQP4 expression polarity as described previously (Fig. 9E) and compared it to unaffected contralateral tissue. At 3 and 14 d after stroke, AQP4 polarity was significantly reduced (Fig. 9G; p < 0.001 vs control, ANOVA). By 28 d after stroke, AQP4 polarity was no longer significantly different from control values (Fig. 9G). Thus, in addition to ongoing neuronal loss, the present diffuse ischemic injury model also results in both delayed failure of myelination and disruption on astrocytic AQP4 polarization in and around lesion foci.
Measurement of cognitive decline following diffuse ischemic insult
We last evaluated changes in cognitive function after induction of diffuse ischemic injury. Mice were tested in the novel object recognition test weekly following stroke and compared to sham-operated controls. At 7 and 14 d following stroke, injured animals exhibited significantly reduced preference for the novel object (Fig. 10A; p < 0.05 vs sham; ANOVA; n = 10 sham, 15 stroke group), indicating compromise of cognitive function. Between 21 and 28 d after stroke, function within the novel object recognition test returned to normal values. A second cognitive test was used in animals either 14 or 28 d after diffuse ischemic injury. Evaluation of hippocampal- and amygdala-based learning by contextual and tonal fear conditioning, respectively, revealed significant hippocampal-dependent cognitive deficits in animals 14 d following stroke (Fig. 10B; p < 0.05 vs sham; ANOVA; n = 10 per group), while amygdala-based learning was not impaired. Hippocampus-dependent cognitive deficit was not apparent in animals 28 d following injury. Using the open field test, no significant difference in either path traveled (a measure of gross motor function) or the percentage of time spent in the middle portion of the test arena (a measure of anxiety) were observed between diffuse stroke- and sham-treated mice at either 7 or 14 d after injury.
Figure 10.
Diffuse ischemic injury results in cognitive decline. A, At 7 and 14 d after diffuse ischemic injury, stroke mice exhibited cognitive decline compared to sham controls in the novel object recognition test. By 28 d after stroke, cognitive function had recovered to control values. B, Cognitive function was also evaluated by the fear conditioning test 14 and 28 d after injury. At 14 d, stroke mice exhibited significant cognitive deficits compared to sham controls, while at 28 d, this deficit had recovered. *p < 0.05 (ANOVA).
Discussion
Microinfarcts are common features among elderly patients, particularly those suffering mild cognitive decline or from vascular or Alzheimer's dementia (Brundel et al., 2012), and are thought to play a causal role in age-related cognitive decline. However, the time course of individual and aggregate lesion development remains largely obscure because the microscopic infarcts are typically first identified only upon postmortem examination. Although several models of microinfarction exist in rats (Rapp et al., 2008; Bailey et al., 2009), to our knowledge this is the first mouse model of diffuse microinfarction to be developed and, more broadly, the first study to provide a detailed characterization of microinfarct lesion development through the acute and chronic phases. We describe that the lesions produced within this model match those observed in clinical populations in terms of size, distribution, and histological characteristics. These lesions are complex in their evolution, exhibiting delayed neuronal cell death and demyelination in addition to spatially widespread and prolonged astrogliosis. Importantly, we identify two distinct histologically distinct lesion types, cavitated and incomplete lesions, that evolve along markedly different trajectories.
In neuropathological studies from human patient populations, microinfarcts are characterized as lesions of varying shape, including “slit-like, triangular, round, barrel-shaped, stellate, granular to wedge-shaped,” (Brundel et al. 2012, p. 429) <1–2 mm in size, and distributed widely throughout cortical and subcortical regions (for a detailed review of microinfarcts in human neuropathological studies, see Brundel et al., 2012). While traditional focal ischemic lesions are defined as necrotic regions exhibiting a loss of all cell types, microinfarcts described in the human clinical literature are incomplete and diffuse, associated with invading CD68-positive macrophages and reactive microglia in addition to reactive astrocytes. One key finding of the present study was that the lesions generated in the mouse model closely resembled the neuropathological findings in human brains. Lesions were observed of varying shape, although roughly round (Fig. 1B,F) and columnar or wedge-shaped lesions (Figs. 1C, 6C) were observed most commonly. Lesion cores were associated with CD68-positive reactive microglia and macrophages were typically microscopic (<1 mm), distributed throughout the deep cortex and subcortical tissues, and were associated widespread reactive astrogliosis. Thus the present mouse diffuse stroke model recapitulates the hallmark characteristics of human microinfarcts.
The present observation that intra-arterial cholesterol crystal injection can be used to reliably generate diffuse microinfarction is in contrast to a prior study in which a similar methodology produced consistent cortical spreading depression, but only inconsistent microinfarction (Nozari et al., 2010). Important methodological differences likely account for these discrepancies. First, Nozari et al. (2010) used a similar number of cholesterol crystals filtered to include those <70 μm in diameter, while we used a double-filtration technique to include only those crystals between 40 and 70 μm. This likely resulted in the occlusion of larger upstream microvessels (typically deep penetrating arterioles) in our model. A second key difference lay in the histological methods used to identify microinfarcts. The prior study used H&E staining and magnetic resonance imaging to identify ischemic lesion formation 72 h after injury. We found that the lesion cores (defined as regions of CD68-positive reactive microgliosis and macrophage infiltration), constituted only a small fraction of the gliotic lesion that was evident upon immunolabeling with GFAP. For this reason, in our hands H&E labeling was markedly inferior to CD68/GFAP double labeling for the detection of diffuse gliotic lesions. The occurrence of delayed neuronal loss in this model also may have prevented the detection of pyknotic neurons 72 h after injury in the prior study (Nozari et al., 2010).
One key benefit for an animal model of diffuse ischemic injury is the ability to study the natural history of individual lesions from the time of induction into the chronic phase, which is not possible in neuropathological studies in humans. Immediately following the ischemic episode induced by intracarotid injection of cholesterol crystals, mild cerebral edema and highly localized blood–brain barrier disruption were observed. The lesion could typically be separated into two histologically distinct regions, including a CD68-positive core and a large surrounding region of GFAP-positive reactive astrogliosis. Interestingly, these two regions appeared to evolve on differing timescales. The central CD68-poitive lesion consolidated between 7 and 14 d after injury to achieve an apparently stable size. In contrast, resolution of reactive astrogliosis was more protracted and did not occur until 28 d after stroke. This was true not only of GFAP immunoreactivity (a classical marker for reactive gliosis), but also of AQP4 polarization within perivascular end feet, suggesting that astroglial function, including water homeostasis and edema clearance (Zador et al., 2009; Saadoun and Papadopoulos, 2010), may be compromised for a long period of time within a wide region surrounding these diffuse ischemic lesions.
Through the ability to track lesion development from the acute to the chronic phase, we were able to identify two histologically distinct classes of lesions: cavitated and incomplete lesions. Cavitated lesions appeared to be very small, conventional necrotic ischemic lesions. The lesion site was complete, bounded by a stable glial scar that did not significantly change in dimensions between 3 and 28 d after injury. Neuronal loss within these lesions was rapid, and apparently complete within the first 14 d after injury, after which these lesions became cystic cavities. These “conventional” ischemic lesions, however, represented only a small fraction of the lesion burden in the present diffuse microinfarction model. In agreement with observed human microinfarcts (Brundel et al., 2012), the dominant lesion type observed in the present model was incomplete lesions. These lesions exhibited widespread reactive astrogliosis, but no defined glial scar. Surrounding astrogliosis was less stable, consolidating gradually over the course of the 28 d after injury. Importantly, neuronal loss within these gliotic lesions was delayed and appeared to be occurring on an ongoing basis.
The presence of delayed neuronal loss and demyelination following diffuse microinfarction is a critical finding. Within the classical MCAO ischemia model, ischemic cell death is largely irreversible within 3 h (Hossmann, 2012) and is complete within 24 h after injury (Garcia et al., 1995). In the observed incomplete lesions, neuronal loss was progressive between 3, 14, and 28 d after stroke. Evan at 28 d after injury, caspase-3-positive neurons could be identified within incomplete lesions. This suggests that the neurons are not being lost solely during the initial ischemic insult, but rather as a result of delayed processes that may differ fundamentally from those of acute ischemic events. Similar results were obtained when myelination was assessed by MBP labeling. Although sporadic changes in myelination were observed in a subpopulation of lesions at 3 and 14 d after stroke, significant and widespread demyelination was not apparent in incomplete ischemic lesions until 28 d after stroke. This demonstrates that critical differences exist between the evolution of incomplete microinfarcts and larger regional infarcts represented by the MCAO and similar models. Insufficient metabolic support from reactive astrocytes, inflammatory processes, and blood–brain barrier opening could all contribute to the delayed neuronal loss. Most importantly, this observation suggests that the therapeutic window to intervene clinically to protect cells associated with these diffuse ischemic lesions may be considerably wider than for larger infarcts, perhaps extending to days and weeks after the initial insult.
Footnotes
This work was supported by the National Institutes of Health, the United States Department of Defense, and the Harold and Leila Y. Mathers Charitable Foundation.
References
- Antunes M, Biala G. The novel object recognition memory: neurobiology, test procedure, and its modifications. Cogn Process. 2012;13:93–110. doi: 10.1007/s10339-011-0430-z. [DOI] [PMC free article] [PubMed] [Google Scholar]
- Bailey EL, McCulloch J, Sudlow C, Wardlaw JM. Potential animal models of lacunar stroke: a systematic review. Stroke. 2009;40:e451–e458. doi: 10.1161/STROKEAHA.108.528430. [DOI] [PubMed] [Google Scholar]
- Brayne C, Richardson K, Matthews FE, Fleming J, Hunter S, Xuereb JH, Paykel E, Mukaetova-Ladinska EB, Huppert FA, O'Sullivan A, Dening T, Dening T. Neuropathological correlates of dementia in over-80-year-old brain donors from the population-based Cambridge city over-75s cohort (CC75C) study. J Alzheimers Dis. 2009;18:645–658. doi: 10.3233/JAD-2009-1182. [DOI] [PubMed] [Google Scholar]
- Brundel M, de Bresser J, van Dillen JJ, Kappelle LJ, Biessels GJ. Cerebral microinfarcts: a systematic review of neuropathological studies. J Cereb Blood Flow Metab. 2012;32:425–436. doi: 10.1038/jcbfm.2011.200. [DOI] [PMC free article] [PubMed] [Google Scholar]
- Chang YS, di Tomaso E, McDonald DM, Jones R, Jain RK, Munn LL. Mosaic blood vessels in tumors: frequency of cancer cells in contact with flowing blood. Proc Natl Acad Sci U S A. 2000;97:14608–14613. doi: 10.1073/pnas.97.26.14608. [DOI] [PMC free article] [PubMed] [Google Scholar]
- Ennaceur A. One-trial object recognition in rats and mice: methodological and theoretical issues. Behav Brain Res. 2010;215:244–254. doi: 10.1016/j.bbr.2009.12.036. [DOI] [PubMed] [Google Scholar]
- Ennaceur A, Delacour J. A new one-trial test for neurobiological studies of memory in rats. 1: Behavioral data. Behav Brain Res. 1988;31:47–59. doi: 10.1016/0166-4328(88)90157-x. [DOI] [PubMed] [Google Scholar]
- Erkinjuntti T, Haltia M, Palo J, Sulkava R, Paetau A. Accuracy of the clinical diagnosis of vascular dementia: a prospective clinical and post-mortem neuropathological study. J Neurol, Neurosurg, Psychiatry. 1988;51:1037–1044. doi: 10.1136/jnnp.51.8.1037. [DOI] [PMC free article] [PubMed] [Google Scholar]
- Esiri MM, Wilcock GK, Morris JH. Neuropathological assessment of the lesions of significance in vascular dementia. J Neurol, Neurosurg, Psychiatry. 1997;63:749–753. doi: 10.1136/jnnp.63.6.749. [DOI] [PMC free article] [PubMed] [Google Scholar]
- Garcia JH, Liu KF, Ho KL. Neuronal necrosis after middle cerebral artery occlusion in Wistar rats progresses at different time intervals in the caudoputamen and the cortex. Stroke. 1995;26:636–642. doi: 10.1161/01.str.26.4.636. discussion 643. [DOI] [PubMed] [Google Scholar]
- Gelderblom M, Leypoldt F, Steinbach K, Behrens D, Choe CU, Siler DA, Arumugam TV, Orthey E, Gerloff C, Tolosa E, Magnus T. Temporal and spatial dynamics of cerebral immune cell accumulation in stroke. Stroke. 2009;40:1849–1857. doi: 10.1161/STROKEAHA.108.534503. [DOI] [PubMed] [Google Scholar]
- Gould TJ. Ethanol disrupts fear conditioning in C57BL/6 mice. J Psychopharmacol. 2003;17:77–81. doi: 10.1177/0269881103017001702. [DOI] [PubMed] [Google Scholar]
- Gould TJ, Lommock JA. Nicotine enhances contextual fear conditioning and ameliorates ethanol-induced deficits in contextual fear conditioning. Behav Neurosci. 2003;117:1276–1282. doi: 10.1037/0735-7044.117.6.1276. [DOI] [PubMed] [Google Scholar]
- Haglund M, Passant U, Sjöbeck M, Ghebremedhin E, Englund E. Cerebral amyloid angiopathy and cortical microinfarcts as putative substrates of vascular dementia. Int J Geriatr Psychiatry. 2006;21:681–687. doi: 10.1002/gps.1550. [DOI] [PubMed] [Google Scholar]
- Hossmann KA. The two pathophysiologies of focal brain ischemia: implications for translational stroke research. J Cereb Blood Flow Metab. 2012;32:1310–1316. doi: 10.1038/jcbfm.2011.186. [DOI] [PMC free article] [PubMed] [Google Scholar]
- Li Y, Chopp M, Zhang ZG, Zhang RL. Expression of glial fibrillary acidic protein in areas of focal cerebral ischemia accompanies neuronal expression of 72-kDa heat shock protein. J Neurol Sci. 1995;128:134–142. doi: 10.1016/0022-510x(94)00228-g. [DOI] [PubMed] [Google Scholar]
- Nozari A, Dilekoz E, Sukhotinsky I, Stein T, Eikermann-Haerter K, Liu C, Wang Y, Frosch MP, Waeber C, Ayata C, Moskowitz MA. Microemboli may link spreading depression, migraine aura, and patent foramen ovale. Ann Neurol. 2010;67:221–229. doi: 10.1002/ana.21871. [DOI] [PMC free article] [PubMed] [Google Scholar]
- Okamoto Y, Ihara M, Fujita Y, Ito H, Takahashi R, Tomimoto H. Cortical microinfarcts in Alzheimer's disease and subcortical vascular dementia. Neuroreport. 2009;20:990–996. doi: 10.1097/WNR.0b013e32832d2e6a. [DOI] [PubMed] [Google Scholar]
- Rapp JH, Hollenbeck K, Pan XM. An experimental model of lacunar infarction: embolization of microthrombi. J Vasc Surg. 2008;48:196–200. doi: 10.1016/j.jvs.2008.01.038. [DOI] [PubMed] [Google Scholar]
- Saadoun S, Papadopoulos MC. Aquaporin-4 in brain and spinal cord oedema. Neuroscience. 2010;168:1036–1046. doi: 10.1016/j.neuroscience.2009.08.019. [DOI] [PubMed] [Google Scholar]
- Silverman MN, Macdougall MG, Hu F, Pace TW, Raison CL, Miller AH. Endogenous glucocorticoids protect against TNF-alpha-induced increases in anxiety-like behavior in virally infected mice. Molecular psychiatry. 2007;12:408–417. doi: 10.1038/sj.mp.4001921. [DOI] [PMC free article] [PubMed] [Google Scholar]
- Simard JM, Chen M, Tarasov KV, Bhatta S, Ivanova S, Melnitchenko L, Tsymbalyuk N, West GA, Gerzanich V. Newly expressed SUR1-regulated NC(Ca-ATP) channel mediates cerebral edema after ischemic stroke. Nat Med. 2006;12:433–440. doi: 10.1038/nm1390. [DOI] [PMC free article] [PubMed] [Google Scholar]
- Sonnen JA, Larson EB, Crane PK, Haneuse S, Li G, Schellenberg GD, Craft S, Leverenz JB, Montine TJ. Pathological correlates of dementia in a longitudinal, population-based sample of aging. Ann Neurol. 2007;62:406–413. doi: 10.1002/ana.21208. [DOI] [PubMed] [Google Scholar]
- Vinters HV, Ellis WG, Zarow C, Zaias BW, Jagust WJ, Mack WJ, Chui HC. Neuropathologic substrates of ischemic vascular dementia. J Neuropathol Exp Neurol. 2000;59:931–945. doi: 10.1093/jnen/59.11.931. [DOI] [PubMed] [Google Scholar]
- Wu LJ, Wu G, Akhavan Sharif MR, Baker A, Jia Y, Fahey FH, Luo HR, Feener EP, Clapham DE. The voltage-gated proton channel Hv1 enhances brain damage from ischemic stroke. Nat Neurosci. 2012;15:565–573. doi: 10.1038/nn.3059. [DOI] [PMC free article] [PubMed] [Google Scholar]
- Xuereb JH, Brayne C, Dufouil C, Gertz H, Wischik C, Harrington C, Mukaetova-Ladinska E, McGee MA, O'Sullivan A, O'Connor D, Paykel ES, Huppert FA. Neuropathological findings in the very old. Results from the first 101 brains of a population-based longitudinal study of dementing disorders. Ann N Y Acad Sci. 2000;903:490–496. doi: 10.1111/j.1749-6632.2000.tb06404.x. [DOI] [PubMed] [Google Scholar]
- Zador Z, Stiver S, Wang V, Manley GT. Role of aquaporin-4 in cerebral edema and stroke. Handb Exp Pharmacol. 2009:159–170. doi: 10.1007/978-3-540-79885-9_7. [DOI] [PMC free article] [PubMed] [Google Scholar]


