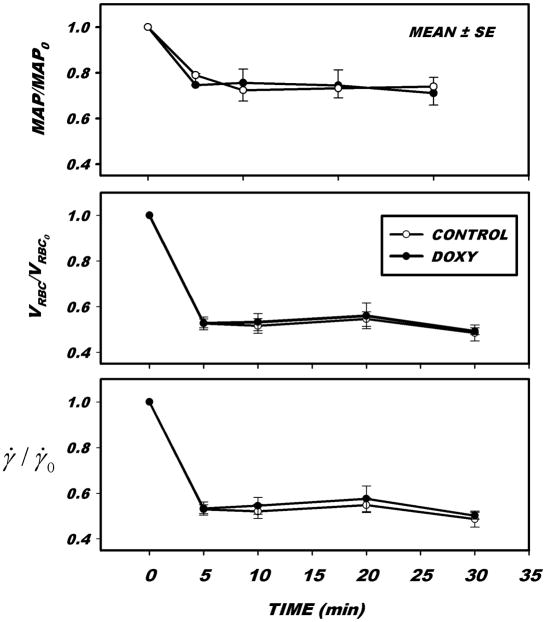
Figure 3.
Hemodynamic trends during induction of a low flow state by hemorrhagic hypotension. Following a control period, blood was withdrawn from a carotid catheter while measuring mean arterial pressure (MAP) and red cell velocity (VRBC) in post-capillary venules. A sufficient volume of blood was withdrawn to reduce VRBC by 50%, which was maintained at that level by either further withdrawal or return of blood. Calculated wall shear rates (γ̇, estimated by a Newtonian flow approximation) fell, on average 50% in the monitored venule. The decline in VRBC and γ̇ was heterogeneous throughout the network of small venules, which resulted in a decrease in γ̇ as great as 80% in some microvessels. Initial values prior to the onset of hemorrhagic hypotension are given in Table 1.

