Abstract
Purpose
To compare FDG-PET/CT and MRI imaging for evaluating patients with cervical cancer. We compared tumor characteristics on FDG-PET and apparent diffusion coefficient (ADC) maps on diffusion-weighted MRI (DWI) to evaluate concordance of two functional imaging techniques.
Materials and Methods
Twenty women with cervical cancer underwent pre-treatment FDG-PETCT and pelvic MRI. Images were rigidly fused by pelvic anatomy using co-registration software. Tumor contours on PET images were generated by auto-segmentation of the region containing at least 40% of the maximum standardized uptake value. DWI contours were generated by manual segmentation. Tumor volume similarity was evaluated using the [PET]/[ADC] volume proportion, Dice’s coefficient, and the mean SUV iso-threshold at the surface of each ADC contour. Tumor sub-volume similarity was evaluated ANOVA.
Results
The [PET]/[ADC] volume proportion was 0.88 ± 0.14. Dice’s coefficient between PET and ADC tumor contours was 0.76 ± 0.06. The mean SUV isothreshold at the ADC-delineated tumor surface was 34 ± 4%. Sub-volumes with increased metabolic activity on FDG-PET also had more restricted diffusion on DWI (p < 0.0001, ANOVA).
Conclusion
Concordance of functional imaging is observed between FDG-PET and DWI for cervical cancer. Tumor sub-volumes with increased metabolic activity on FDG-PET also have greater cell density by DWI.
Keywords: Cervix, Cancer, PET, MRI, DWI
INTRODUCTION
Positron emission tomography (PET) with [18F]fluorodeoxyglucose (FDG) is an established functional imaging technique for the pre- and posttreatment evaluation of patients with cervical cancer. In the pretreatment setting, tumor FDG avidity and intratumoral heterogeneity are associated with poor progression-free survival(1, 2). In the posttreatment setting, assessment by FDG-PET 3 months after the completion of chemoradiation predicts the likelihood of durable treatment response(3).
Magnetic resonance imaging (MRI) also is used for the evaluation of cervical cancer. T2-weighted MRI provides improved tumor delineation for early-stage disease compared to CT(4), although the tumor volume measured by T2-weighted MRI has not been evaluated for correlation with the metabolically active volume measured by FDG-PET.(5)
Diffusion-weighted MRI (DWI) is a functional MRI technique that allows characterization of biological tissues based on their water diffusion properties. DWI-generated maps of apparent diffusion coefficients (ADCs) have been used to differentiate benign from malignant cervical tissue(6, 7) and to monitor treatment response of cervical cancer(7, 8). The ADC is known to correlate inversely with both grade and cellular density on pathology(9).
The purpose of this study was to compare tumor characteristics assessed by FDG-PET and by DWI for evaluation of the concordance between these two functional imaging techniques.
MATERIALS AND METHODS
Patients
This analysis included 20 consecutive women treated with definitive radiotherapy for carcinoma of the cervix between January 2010 and January 2011, subject to the following inclusion criteria: 1) squamous cell histology, 2) availability of both FDG-PET/CT and DWI imaging data for analysis. FDG-PET/CT and pelvic MRI were both routinely obtained as standard of care for the initial evaluation of cervical cancer during the study period. FDG-PET/CT and DWI imaging were performed before therapy was started. The two imaging sessions were separated by less than one week for most patients. Clinical stage was determined according to guidelines of the International Federation of Gynecology and Obstetrics (FIGO)(10). This retrospective study was approved by the Human Research Protection Office at our institution and waiver of consent was obtained
FDG-PET tumor segmentation
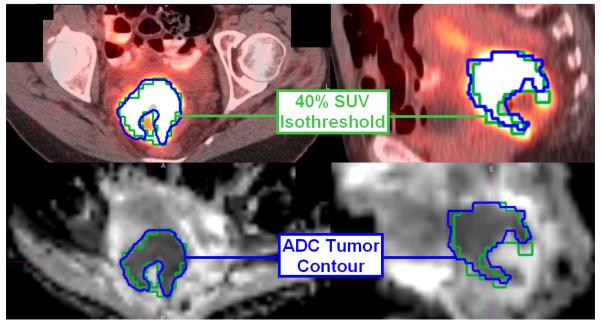
All patients underwent FDG-PET/CT as part of the initial clinical evaluation, as previously described.(11) Primary tumor FDG uptake was measured using the standardized uptake value (SUV)(1). For each pre-treatment FDG-PET study, the tumor SUVmax was calculated as the maximum pixel SUV within a region of interest encompassing the tumor.(1) FDG tumor volume was calculated as the volume of all pixels with SUV >40% SUVmax within the tumor region of interest, as described previously (Figure 1).(12)
Figure 1.
FDG-PET/CT (top) and DWI (bottom) axial (left) and sagittal (right) images fused for one sample patient. The 40% SUV isothreshold is outlined in green, and the tumor volume delineated on the ADC map is outlined in blue.
ADC-MRI tumor segmentation
DWI was acquired on one of several Siemens Magnetom™ scanners (Espree, Symphony, Sonata) using echo-planar imaging in the transverse plane with the following technique range: Field strength = 1.5 T, TR/TE = (3000-8800 ms)/(85-102 ms), matrix size 128 × 96-112, slice thickness 4-7 mm, and b-values of 0, 400, and 1000 s/mm2were utilized. ADC maps were generated from each DWI examination.(13) Malignant cervical tumors are known to have greater diffusion restriction than uninvolved cervical tissue(6). Tumor contours were therefore delineated by manual segmentation of each ADC map, guided by the contrast between the diffusion restricted (dark) tumor and normal tissue. ADC tumor segmentation in the transverse and sagittal planes is illustrated for one representative patient in Figure 1.
Tumor volume comparison
PET-determined and ADC-determined tumor volumes were compared using two methods. MIMVista® software version 5.1 (MIM Software Inc., Cleveland OH) was utilized to calculate 3-D tumor volumes. First, the FDG and ADC volumes for each patient were divided to calculate a tumor volume proportion, defined as [FDG volume]/[ADC volume]. Concordance of these volumes was assessed by Dice’s coefficient, a similarity measure for comparison of two datasets, which is defined as twice the shared volume (intersection) divided by the sum of each individual volume(14). Dice’s coefficient was calculated to compare the FDG and ADC tumor volumes; a value of 1 indicates perfect similarity, while a value of 0 indicates no similarity.
Tumor sub-volume comparison
Tumor sub-volume characteristics were compared between PET-determined and ADC-determined volumes. Relative FDG avidity and ADC percentiles were used to account for variability of imaging technique(15, 16). For FDG-PET, tumor sub-volume contours were created corresponding to FDG-PET activity shells between 40-50, 50-60, 60-70, 70-80, 80-90, and 90-100% of SUVmax. For DWI, the ADC value maps of each tumor were exported to MATLAB (Version R2008a, The Mathworks Inc., Natick, MA), and a custom data processing program was used to determine the relative percentile corresponding to each ADC value using the total ADC range for each tumor. All FDG-PET and ADC-MRI images were rigidly fused by pelvic anatomy using MIMfusion® fusion software version 5.1 (MIM Software Inc., Cleveland OH) (Figure 1). Tumor sub-volume characteristics were then evaluated by comparing the mean ADC percentiles of each FDG-PET activity shell using analysis of variance (ANOVA). The mean SUV isothreshold (percentage of maximum SUV) at the surface of each ADC tumor contour was also determined for each patient.
RESULTS
Patient characteristics
The median age of the patient cohort was 47 years (range 35-81). FIGO stages included IB1 (n=5), IB2 (n=4), IIB (n=7), IIIA (n=1), IIIB (n=2), and IVA (n=1). The median tumor SUVmax was 14.1 (range 6.2-29.4), and the median tumor ADC was 1.09 × 10⁻³ mm2/s (range 0.727 − 1.47 [× 10−3 mm2/s]).
Comparison of PET-determined and ADC-determined tumor volumes
The average FDG-PET tumor volume was 39.0 cm3 (range 8.0-145 cm3), and the average ADC-MRI tumor volume was 43.8 cm3 (range 8.7-158 cc). The mean and standard deviation of the [FDG]/[ADC] tumor volume proportion was 0.88 ± 0.14. Dice’s similarity coefficient between FDG and ADC tumor volumes was 0.76 ± 0.06.
Comparison of PET-determined and ADC-determined tumor sub-volumes
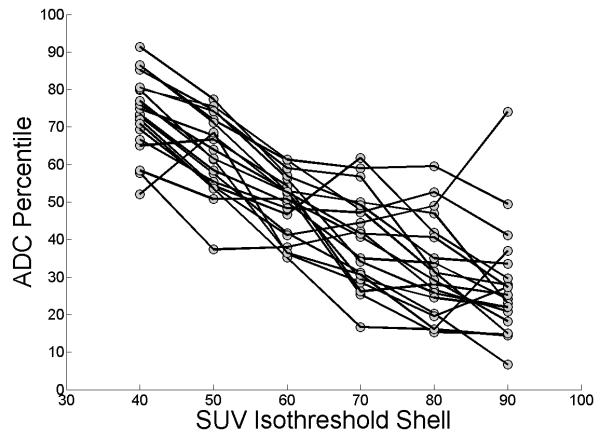
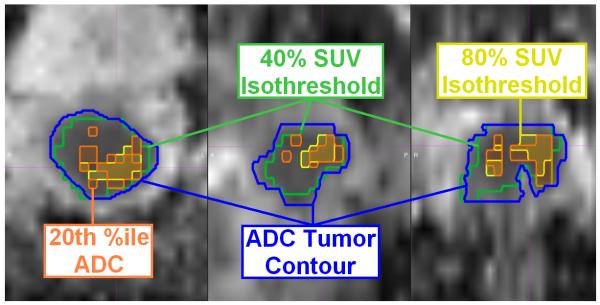
The mean ADC percentiles at the 40-50, 50-60, 60-70, 70-80, 80-90, and 90-100% FDG-PET activity shells were 74 ± 10, 63 ± 10, 49 ± 8, 40 ± 12, 32 ± 13, and 28 ± 15. Tumor sub-volumes with increased metabolic activity on FDG-PET also had more restricted diffusion by DWI (p<0.0001, ANOVA). Figure 2 shows a trace of the ADC percentile corresponding to each FDG-PET activity shell for each patient, and Figure 3 illustrates the correlation between the volume encompassing 80% of SUVmax, and the most restricted 20th percentile of tumor ADC for one sample patient. The mean SUV isothreshold at the ADC-delineated tumor surface across all patients was 34 ± 4%.
Figure 2.
The relationship between ADC percentile and SUV isothreshold shell is shown, with lines connecting the datapoints for each patient. Tumor sub-volumes with greater FDG avidity also had more restricted diffusion.
Figure 3.
Example of imaging concordance between FDG-PET and ADC-MRI for one patient on axial (left), sagittal (center), and coronal (right) sections. The ADC map (blue) and FDG-PET (green) tumor contours are shown, with overlap observed between the 80% FDG-PET SUV isothreshold (yellow) and the 20th percentile ADC value (orange), indicative of the tumor subvolume with the most restricted diffusion, on the ADC map.
DISCUSSION
FDG-PET allows discrimination of tissues by glucose metabolism based on intracellular entrapment of phosphorylated FDG, with a greater FDG uptake, as measured by SUV, observed for tissues with increased metabolic activity (e.g., malignant lesions). DWI allows tissue characterization based on sensitivity to the molecular motion of water. The degree of diffusion restriction observed correlates with cellular density for multiple human malignancies including cervical cancer(9, 17, 18).
We found a correlation between cervical tumor volumes delineated by FDG-PET and DWI. The tumor volume proportion and Dice’s coefficient we observed both demonstrate similar tumor delineation for FDG-PET and DWI. The 34 ± 4% SUV isothreshold at the ADC-delineated tumor surface approximates the 40% isothreshold value observed for gross tumor delineation both in prior CT imaging and pathologic studies (12, 19). To further evaluate concordance between PET-determined and ADC-determined tumor volumes, we studied tumor sub-volumes, and found that tumor sub-volumes with increased FDG avidity also had more restricted diffusion on DWI. FDG avidity in cancer tissue often is attributed to increased glycolysis at the cellular level(20, 21). The positive intratumoral correlation between FDG avidity and restricted diffusion suggests that increased cellular density may also contribute to intratumoral variability in the the measured SUV. Similar to FDG-PET, preliminary studies suggest changes in ADC during radiotherapy can also differentiate responders and nonresponders(8, 9).
Given the retrospective nature of our study, confirmation of our findings in a prospective trial is required for validation. Additionally, although FDG-PET is known to correlate with outcome for cervical cancer, greater follow-up of our DWI cohort is required to report similar outcomes data.
DWI technique was variable among our clinical MRI scanners during the study period, and imaging technique is known to effect the observed ADC(15, 16). To correct for this potential confounding factor, relative ADC percentiles rather than absolute ADC values were used to standardize the comparison of tumor sub-volumes with FDG-PET. Comparison of ADC percentiles for each FDG isothreshold shell confirmed a positive intratumoral correlation between FDG avidity and diffusion restriction.
Mean ADC is known to correlate inversely with cellular density on a tumor-wide basis for cervical cancer (9), although use of a mean tumor ADC metric neglects intratumoral heterogeneity, which correlates with outcome(2). Our tumor sub-volume analysis accounts for this variability and could potentially individualize treatment planning by applying ADC as a patient- and voxel-specific surrogate for cellular density.
In conclusion, Concordance of functional imaging metrics is observed between FDG-PET and DWI for squamous cell carcinoma of the cervix. Tumor sub-volumes with increased metabolic activity on FDG-PET also have more restricted diffusion, indicative of greater cell density, by DWI.
Acknowledgment
This research was presented at the 2011 American Society of Radiation Oncology (ASTRO) annual meeting.
Footnotes
Conflict of Interest Notification: This research was supported in part by NIH grant R01CA136931-02. There are no other actual or potential conflicts of interest.
References
- 1.Kidd EA, Siegel BA, Dehdashti F, et al. The standardized uptake value for F-18 fluorodeoxyglucose is a sensitive predictive biomarker for cervical cancer treatment response and survival. Cancer. 2007;110:1738–1744. doi: 10.1002/cncr.22974. [DOI] [PubMed] [Google Scholar]
- 2.Kidd EA, Grigsby PW. Intratumoral metabolic heterogeneity of cervical cancer. Clin Cancer Res. 2008;14:5236–5241. doi: 10.1158/1078-0432.CCR-07-5252. [DOI] [PubMed] [Google Scholar]
- 3.Schwarz JK, Siegel BA, Dehdashti F, et al. Association of posttherapy positron emission tomography with tumor response and survival in cervical carcinoma. JAMA. 2007;298:2289–2295. doi: 10.1001/jama.298.19.2289. [DOI] [PubMed] [Google Scholar]
- 4.Mitchell DG, Snyder B, Coakley F, et al. Early invasive cervical cancer: tumor delineation by magnetic resonance imaging, computed tomography, and clinical examination, verified by pathologic results, in the ACRIN 6651/GOG 183 Intergroup Study. J Clin Oncol. 2006;24:5687–5694. doi: 10.1200/JCO.2006.07.4799. [DOI] [PubMed] [Google Scholar]
- 5.Ma DJ, Zhu J-M, Grigsby PW. Change in T2-Fat Saturation MRI Correlates With Outcome in Cervical Cancer Patients. International Journal of Radiation Oncology*Biology*Physics. 81:e707–e712. doi: 10.1016/j.ijrobp.2010.10.008. [DOI] [PubMed] [Google Scholar]
- 6.Naganawa S, Sato C, Kumada H, et al. Apparent diffusion coefficient in cervical cancer of the uterus: comparison with the normal uterine cervix. Eur Radiol. 2005;15:71–78. doi: 10.1007/s00330-004-2529-4. [DOI] [PubMed] [Google Scholar]
- 7.McVeigh P, Syed A, Milosevic M, et al. Diffusion-weighted MRI in cervical cancer. Eur Radiol. 2008;18:1058–1064. doi: 10.1007/s00330-007-0843-3. [DOI] [PubMed] [Google Scholar]
- 8.Rizzo S, Summers P, Raimondi S, et al. Diffusion-weighted MR imaging in assessing cervical tumour response to nonsurgical therapy. La Radiologia Medica. 2011;116:766–780. doi: 10.1007/s11547-011-0650-4. [DOI] [PubMed] [Google Scholar]
- 9.Liu Y, Bai R, Sun H, et al. Diffusion-weighted magnetic resonance imaging of uterine cervical cancer. J Comput Assist Tomogr. 2009;33:858–862. doi: 10.1097/RCT.0b013e31819e93af. [DOI] [PubMed] [Google Scholar]
- 10.Greene FL, Page DL, Fleming ID, et al. AJCC Cancer Staging Manual. 6th Edition Springer-Verlag; New York: 2002. [Google Scholar]
- 11.Wright JD, Dehdashti F, Herzog TJ, et al. Preoperative lymph node staging of early-stage cervical carcinoma by [18F]-fluoro-2-deoxy-D-glucose-positron emission tomography. Cancer. 2005;104:2484–2491. doi: 10.1002/cncr.21527. [DOI] [PubMed] [Google Scholar]
- 12.Miller TR, Grigsby PW. Measurement of tumor volume by PET to evaluate prognosis in patients with advanced cervical cancer treated by radiation therapy. Int J Radiat Oncol Biol Phys. 2002;53:353–359. doi: 10.1016/s0360-3016(02)02705-0. [DOI] [PubMed] [Google Scholar]
- 13.Rowley HA, Grant PE, Roberts TP. Diffusion MR imaging. Theory and applications. Neuroimaging Clin N Am. 1999;9:343–361. [PubMed] [Google Scholar]
- 14.Dice L. Measures of the amount of ecologic association between species. Ecology. 1945:297–302. [Google Scholar]
- 15.Dale BM, Braithwaite AC, Boll DT, et al. Field strength and diffusion encoding technique affect the apparent diffusion coefficient measurements in diffusion-weighted imaging of the abdomen. Invest Radiol. 45:104–108. doi: 10.1097/RLI.0b013e3181c8ceac. [DOI] [PubMed] [Google Scholar]
- 16.Ogura A, Hayakawa K, Miyati T, et al. Imaging parameter effects in apparent diffusion coefficient determination of magnetic resonance imaging. Eur J Radiol. 77:185–188. doi: 10.1016/j.ejrad.2009.06.031. [DOI] [PubMed] [Google Scholar]
- 17.Sugahara T, Korogi Y, Kochi M, et al. Usefulness of diffusion-weighted MRI with echo-planar technique in the evaluation of cellularity in gliomas. J Magn Reson Imaging. 1999;9:53–60. doi: 10.1002/(sici)1522-2586(199901)9:1<53::aid-jmri7>3.0.co;2-2. [DOI] [PubMed] [Google Scholar]
- 18.Lyng H, Haraldseth O, Rofstad EK. Measurement of cell density and necrotic fraction in human melanoma xenografts by diffusion weighted magnetic resonance imaging. Magn Reson Med. 2000;43:828–836. doi: 10.1002/1522-2594(200006)43:6<828::aid-mrm8>3.0.co;2-p. [DOI] [PubMed] [Google Scholar]
- 19.Showalter TN, Miller TR, Huettner P, et al. 18F-fluorodeoxyglucose-positron emission tomography and pathologic tumor size in early-stage invasive cervical cancer. Int J Gynecol Cancer. 2009;19:1412–1414. doi: 10.1111/IGC.0b013e3181b62e8c. [DOI] [PubMed] [Google Scholar]
- 20.Mankoff DA, Eary JF, Link JM, et al. Tumor-specific positron emission tomography imaging in patients: [18F] fluorodeoxyglucose and beyond. Clin Cancer Res. 2007;13:3460–3469. doi: 10.1158/1078-0432.CCR-07-0074. [DOI] [PubMed] [Google Scholar]
- 21.Warburg O. On the origin of cancer cells. Science. 1956;123:309–314. doi: 10.1126/science.123.3191.309. [DOI] [PubMed] [Google Scholar]


