Abstract
The formation of a stable vascular network in a scaffold is one of the most challenging tasks in tissue engineering and regenerative medicine. Despite the common use of porous scaffolds in these applications, little is known about the effect of pore size on the neovascularization in these scaffolds. Here we fabricated poly(D, L-lactide-co-glycolide) inverse opal scaffolds with uniform pore sizes of 79, 147, 224, and 312 μm in diameter and then used them to systematically study neovascularization in vivo. Histology analyses revealed that scaffolds with small pores (<200 μm) favored the formation of vascular networks with small vessels at high densities and poor penetration depth. By contrast, scaffolds with large pores (>200 μm) favored the formation of vascular networks with large blood vessels at low densities and deep penetration depth. Based on the different patterns of vessel ingrowth as regulated by the pore size, we proposed a model to describe vascularization in a three-dimensional porous scaffold, which can potentially serve as a guideline for future design of porous scaffolds.
Keywords: inverse opal scaffolds, pore dimension, blood vessels, tissue engineering, regenerative medicine
1. Introduction
Tissue engineering has emerged as a promising strategy for the regeneration of tissues and organs damaged by injuries or diseases.[1–3] During this regeneration process, three-dimensional (3D) scaffolds are often needed to serve as physical supports for cells to attach and migrate, as well as to create adjustable microenvironments for cells to respond. Among various types of 3D scaffolds, those with interconnected pores are advantageous because they support the migration of cells and transport of oxygen, nutrients, and wastes.[4–5] In addition to the interconnected pores, a robust vasculature is also needed to further facilitate the transport of oxygen, nutrients and wastes to/from the cells residing inside the scaffold well beyond the limits of passive diffusion.[6,7] This is particularly important at later stages of tissue engineering when most of the pores in a scaffold have been filled with cells and the extracellular matrix secreted by the cells. Despite impressive progress in recent years, it remains a grand challenge to apply the concept of tissue engineering to thick and complex tissues or organs due to the lack of rapid neovascularization (i.e., formation of a vascular network) within a porous scaffold. Tissues that have been successfully engineered are largely limited to relatively thin or avascular constructs such as skins and cartilages.[6]
Many strategies have been explored to promote neovascularization in a porous scaffold, including the use of natural polymers,[8–10] encapsulation of angiogenic growth factors,[11–14] embedment of endothelial cells or stem cells,[15,16] and inclusion of proper genes.[17] While these angiogenic adjuncts have been shown to significantly enhance vascularization, only a few studies have directly examined how the pore size of a scaffold affects the formation of a vascular network in vivo. To this end, the Hofstetter and Homann groups reported that pores of 140 μm or larger in size supported more effective ingrowth of endothelium when ceramic and poly(ether ester) block-copolymer scaffolds were used, respectively.[18] However, their scaffolds were troubled by non-uniform pore structures, including a broad range of distribution (up to 50% variation) in pore size, which tend to compromise the conclusions derived from the experimental data. In this regard, porous scaffolds with precisely controlled pore sizes and well-defined pore structures are particularly important for investigating the role of pore size on cell behavior, cell function, tissue formation, as well as vascularization.[19–21] To date, several groups have fabricated scaffolds with relatively uniform pore sizes (ca. 10% deviation) for the study of neovascularization. For example, Ratner and co-workers investigated poly(2-hydroxyethylmethacrylate)-based scaffolds with a set of pore sizes up to 80 μm in diameter and they claimed an optimal pore size of 30–40 μm for angiogenesis.[22] Dong and co-workers used β-tricalcium phosphate scaffolds with pore sizes of 337, 415, 557 and 632 μm, and found that pores smaller than 400 μm limited the growth of blood vessels.[23] The results from these two studies are somewhat inconsistent and contradictory to each other. In addition, the range of pore size from 100–300 μm remains to be largely un-investigated. Here we report, for the first time, the use of poly(D, L-lactide-co-glycolide) (PLGA) inverse opal scaffolds with uniform pore sizes (<5% deviation) as a well-defined and controllable model system to systematically evaluate the effect of pore size on the pattern and degree of neovascularization in vivo without the involvement of angiogenic growth factors or angiogenic cells. Specifically, four sets of scaffolds with pore size of 78.5 ± 3.2, 146.8 ± 3.1, 224.3 ± 5.1, and 312.3 ± 5.6 μm, respectively, were subcutaneously implanted at the dorsal side of nude mice, and neovascularization was examined at 2 and 4 weeks via histology analyses. Our results suggest that scaffolds with large pore sizes indeed facilitated the development of invading vasculatures. We further proposed a model for neovascularization in these scaffolds, which could potentially offer a guideline for future design of porous scaffolds to promote neovascularization in vivo.
2. Results and Discussion
Inverse opal scaffolds are three-dimensional porous structures fabricated by templating against cubic-close packed lattices of microspheres with uniform and precisely controlled sizes.[24–30] Figure 1 shows the schematic of an inverse opal scaffold, which contains three different types of pores in different sizes. The first type is the spherical pores inside a scaffold, whose dimension is essentially the same as the diameter of the templating microspheres. We define this parameter as the “nominal pore size” (or “pore size” in our discussion), which is probably the most commonly used definition of “pore size” by researchers in the tissue engineering community, including the aforementioned studies. The second type is the circular pores on the surface of a scaffold, whose dimension is referred to as the “surface pore size” in the present work. It is slightly smaller than the “pore size”, and is largely determined by the fabrication process. Typically, the excess solution on the surface of a templating lattice is removed by wiping with a filter paper. The polymer solution remaining in the meniscus between adjacent microspheres then solidifies to generate circular pores with a dimension slightly smaller than the diameter of the templating microspheres. The “surface pore size” can be adjusted by controlling the concentration or viscosity of the infiltration solution and the wettability of the microspheres by the solvent. For conventional scaffolds with non-uniform pore structures, sometimes it can be difficult to differentiate the “pore size” from the “surface pore size” because not all the pores in the bulk are perfectly spherical (e.g., cylindrical pores may also exist). The third type is the circular pores interconnecting adjacent spherical pores in the bulk, whose dimension is often referred to as the “window size”. These uniform windows enable interconnectivity among the spherical pores throughout an inverse opal scaffold. The “window size” is typically about one fifth to one fourth of the diameter of templating microspheres, and the exact value can be varied by controlling the temperature and/or duration of time used for the necking process, as well as the concentration and viscosity of the infiltration solution.[31]
Figure 1.
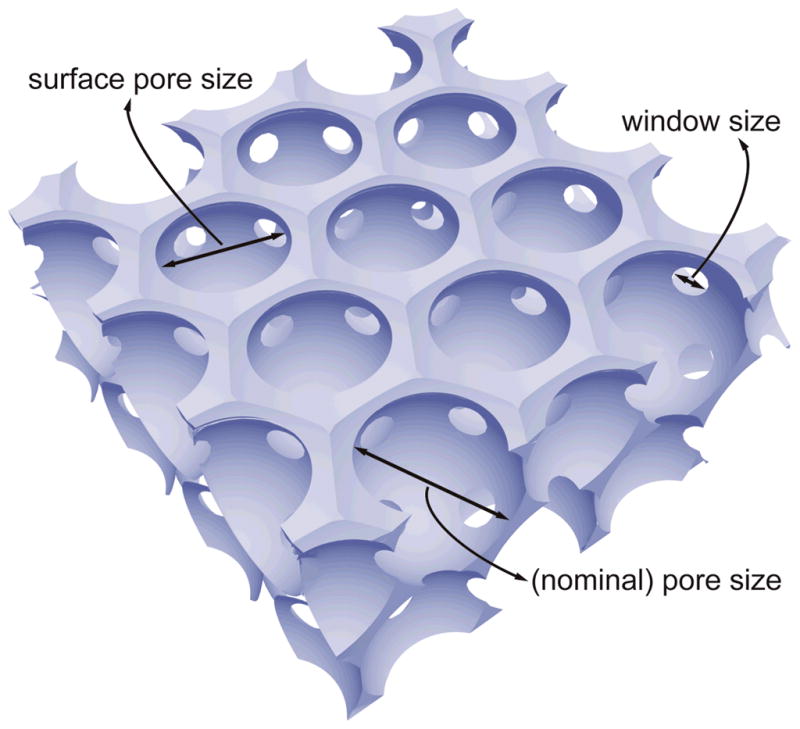
Schematic of an inverse opal scaffold, with the definitions of three different sizes of the pores: the (nominal) pore size, the surface pore size, and the window size.
In this work, we fabricated PLGA inverse opal scaffolds by templating against uniform gelatin microspheres (Table 1).[32–36] Figure 2, A–D, shows SEM images of PLGA inverse opal scaffolds with four different pore sizes of 79, 147, 224, and 312 μm. We used a 20 wt% PLGA solution in 1,4-dioxane as the infiltration solution, and the “surface pore size” was typically 75–85% of the pore size. As a result, the four groups of inverse opal scaffolds had surface pore sizes of ca. 62, 115, 175 and 243 μm, respectively. The insets in Figure 2, A–D, give images at higher magnification, showing the uniform windows connecting adjacent spherical pores. These windows could serve as pathways for cells and blood vessels to penetrate into the bulk of a scaffold and for the transport of oxygen, nutrients and metabolic wastes.[35,37] For all scaffolds used in the present work, the gelatin microspheres were fused at 70 °C for 1 h, and the window size was ca. 20–25% of the pore size, i.e., the window sizes were ca. 18, 33, 50 and 70 μm, respectively, for scaffolds with pore sizes of 79, 147, 224, and 312 μm.
Table 1.
Detailed experimental conditions for the fabrication of gelatin microspheres using a fluidic device.
| Microsphere diameter (μm) | Needle (Gauge) | Inner diameter of glass capillary (μm) | Gelatin solution (wt%) | Flow rate (mL/min)
|
|
|---|---|---|---|---|---|
| Discontinuous phase | Continuous phase | ||||
| 78.5±3.2 | 30 | 400 | 4 | 0.05 | 0.5 |
| 146.8±3.1 | 30 | 400 | 10 | 0.05 | 0.2 |
| 224.3±5.1 | 26 | 500 | 10 | 0.05 | 0.2 |
| 312.3±5.6 | 26 | 700 | 10 | 0.05 | 0.3 |
Figure 2.
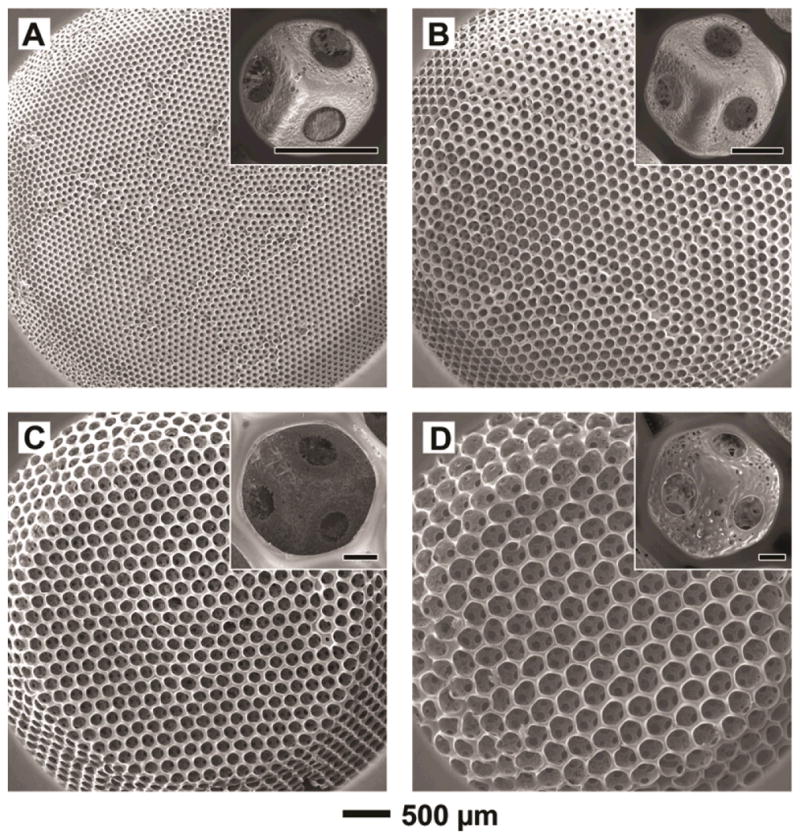
(A–D) SEM images of PLGA inverse opal scaffolds with pore sizes of 79, 147, 224, and 312 μm, respectively. The scaffolds had a diameter of ~4 mm at the top surface, a diameter of ~6 mm at the bottom, and a thickness of ~1 mm. The insets show magnified views of a pore on the surface of each scaffold, revealing the uniform windows connecting to adjacent pores (scale bars: 50 μm).
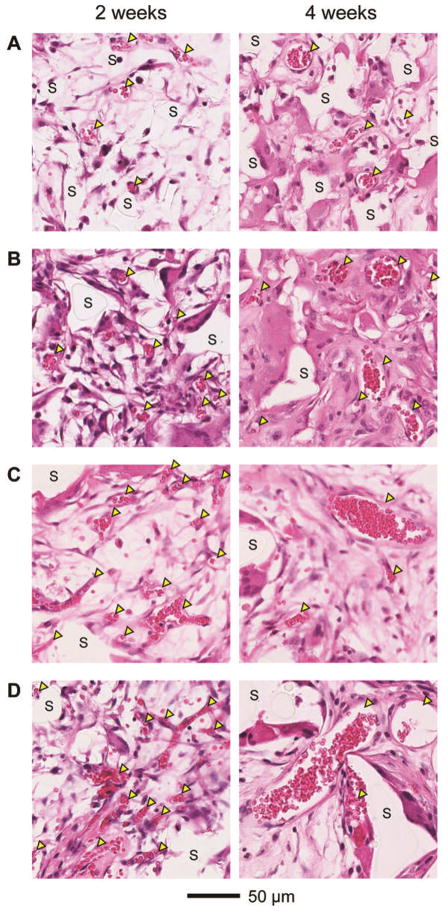
The inverse opal scaffolds with four different pore sizes (and therefore different sizes for the pores on the surface and the windows) were subcutaneously implanted at the dorsal sides of nude mice. Each scaffold was positioned such that the top surface opposed the layer of connective tissue underlying the dermis where the majority of blood vessels resided. In this case, the vessels could only invade into the bulk of the scaffold through the pores at the top surface. Figure 3 shows representative hematoxylin and eosin stained samples obtained from sections approximately 200 μm away from the top surface of the scaffolds at 2 and 4 weeks post implantation. Nascent vessels extending into the implanted scaffolds were histologically confirmed by the presence of red blood cells surrounded by continuous rings of vascular cells (indicated by arrowheads). Scaffolds were identified by the areas where no stains could be observed (indicated by ‘S’). At 2 weeks post implantation, although a number of blood vessels were observed to penetrate into the pores of all implanted scaffolds (Figure 3, left column), scaffolds with large pore sizes (224 and 312 μm) apparently supported higher densities of blood vessels than scaffolds with small pore sizes (79 and 147 μm), with multiple blood vessels invading individual pores. These initially formed blood vessels had an average diameter of ca. 15 μm, irrespective of the pore size of the scaffold. At 4 weeks post implantation, remarkable differences were observed in both the number and size of blood vessels in the implanted scaffolds with different pore sizes (Figure 3, right column). The mean diameter of blood vessels in scaffolds with small pore sizes increased to ca. 25 μm. Interestingly, while scaffolds with large pore sizes supported an increase in the mean diameter of blood vessels to approximately 40 μm, there was a decrease in the number of small vessels relative to the samples at 2 weeks post implantation.
Figure 3.
Representative hematoxylin and eosin stained sections of subcutaneously implanted scaffolds with pore sizes of (A) 79, (B) 147, (C) 224, and (D) 312 μm, respectively, at 2 weeks (left column) and 4 weeks (right column) post implantation. All the images were obtained at approximately 200 μm in depth from the top surface of the scaffolds. Blood vessels are indicated by yellow arrowheads, whereas ‘S’ indicates the scaffolds.
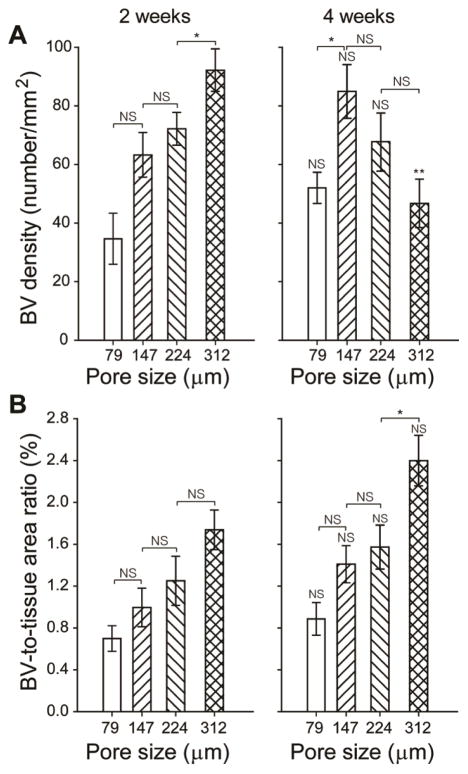
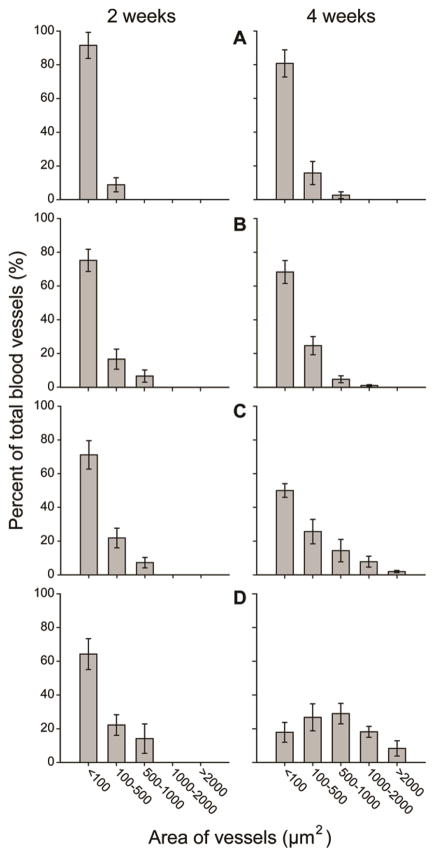
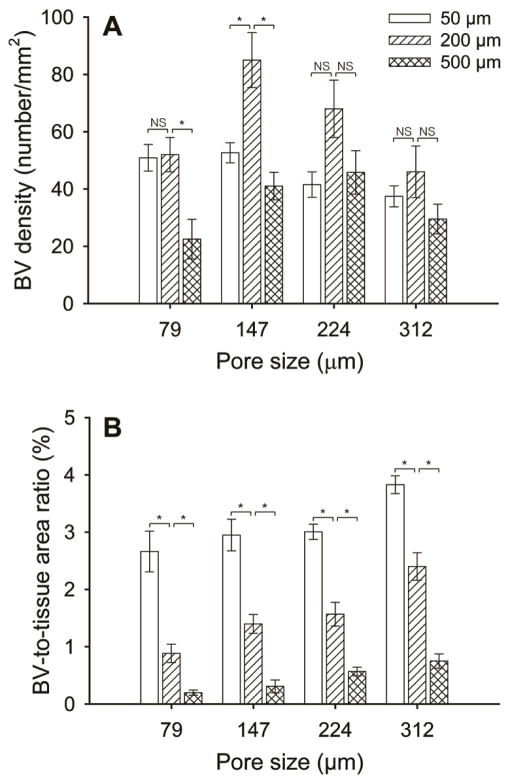
Histology sections were then utilized to quantitatively assess both the blood vessel density and the blood vessel-to-tissue area ratio at the same depth (200 μm) from the top surface of the scaffolds. Blood vessel density was calculated as the number of blood vessels per unit area of the scaffold/tissue section (in the unit of number/mm2). The blood vessel-to-tissue area ratio was defined as the percentage of total areas of all the blood vessels in a scaffold/tissue section against the area of that section (expressed as %). Figure 4A shows plots of blood vessel density as a function of pore size at 2 and 4 weeks post implantation. At 2 weeks, scaffolds with large pore sizes were found to induce a higher density of blood vessels in the scaffolds than scaffolds with small pore sizes. Particularly, the scaffolds with a pore size of 312 μm showed the highest density of blood vessels among the four samples. However, at 4 weeks, the densities of blood vessels in scaffolds with large pore sizes appeared to decrease whereas the densities of vessels in scaffolds with small pore sizes greatly increased. Figure 4B shows plots of the blood vessel-to-tissue area ratio as a function of pore size at 2 and 4 weeks post implantation. The ratio was observed to increase over time in all scaffolds. Despite the reduction in blood vessel densities for scaffolds with large pores at 4 weeks, the scaffolds with a pore size of 312 μm showed substantially higher blood vessel-to-tissue area ratio than other scaffolds, which could be attributed to the presence of a number of large vessels. Indeed, this argument was confirmed by quantifying the distribution of blood vessel areas in these scaffolds (Figure 5). The majority of nascent vessels in all the scaffolds at 2 weeks had small cross-sectional areas (<100 μm2). At 4 weeks, in contrast, scaffolds with large pores showed a markedly different distribution in vessel areas, moving towards blood vessels with larger areas. Particularly, in the case of scaffolds with a pore size of 312 μm, blood vessels with areas ranging from 500–1000 μm2 occupied the highest percentage.
Figure 4.
Plots of (A) blood vessel density and (B) blood vessel-to-tissue area ratio as a function of pore size at 2 and 4 weeks post implantation, both of which were measured from hematoxylin and eosin stained tissue sections obtained at approximately 200 μm in depth from the top surface of the scaffolds. The data are presented as mean ± standard deviation (n = 4). * indicates significant difference between two groups (p<0.005), whereas NS means not statistically significant (p>0.005). ** indicates significant difference relative to the value of the samples at 2 weeks. For each sample, at least 200 blood vessels from 8 tissue sections were examined.
Figure 5.
Plots of distribution of blood vessel areas in the scaffolds with pore sizes of (A) 79, (B) 147, (C) 224, and (D) 312 μm, respectively, at 2 weeks (left column) and 4 weeks (right column) post implantation. The data were measured from hematoxylin and eosin stained tissue sections obtained at approximately 200 μm in depth from the top surface of the scaffolds. The data are presented as mean ± standard deviation (n = 4). For each sample, at least 200 blood vessels from 8 tissue sections were examined.
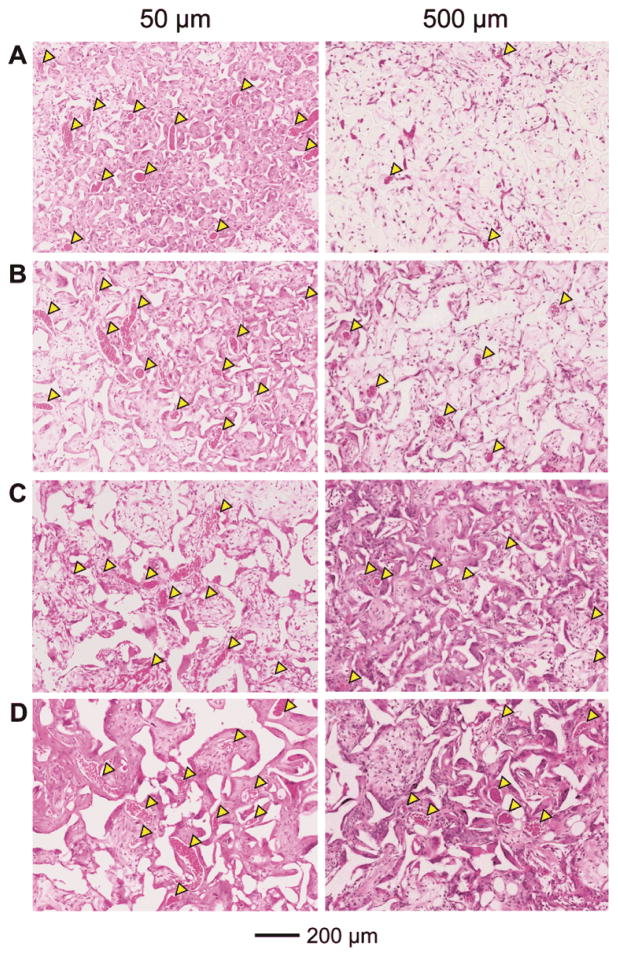
To further assess the effect of pore size on the degree of neovascularization, the ingrowth of blood vessels in the scaffolds at 4 weeks was examined at other two different depths of ca. 50 and 500 μm, respectively, from the top surface of the scaffolds. At a depth of 50 μm, there were a number of large blood vessels present irrespective of the pore size of the scaffolds (Figure 6, left column). The densities of these vessels were lower than those at a depth of 200 μm (Figure 7A), while the blood vessel-to-tissue area ratios of the vessels were remarkably larger (Figure 7B). At a depth of 500 μm, noticeably fewer blood vessels were observed for scaffolds with small pore sizes (Figure 6, A and B, right column, and Figure 7, A and B) relative to the depth of 200 μm (Figure 3, right column and Figure 4A). By contrast, the difference in the densities of blood vessels was less significant for scaffolds with large pore sizes at different depths (Figure 6, C and D, right column, and Figure 7A versus Figure 3, right column, and Figure 4A, right panel), suggesting that the large pore sizes could facilitate the invasion of blood vessels deeply into the bulk of the scaffolds. Scaffolds with large pore sizes also had higher blood vessel-to-tissue area ratios at this depth than scaffolds with small pore sizes (Figure 6F) although the ratios were smaller in all cases in comparison with those close to the surface region (Figure 6, left column, and Figure 4B, right panel).
Figure 6.
Representative hematoxylin and eosin stained tissue sectionsof subcutaneously implanted scaffolds with pore sizes of (A) 79, (B) 147, (C) 224, and (D) 312 μm, respectively, at 4 weeks post implantation at approximately 50 μm (left column) and 500 μm (right column) in depth from the top surface of the scaffolds. Blood vessels are indicated by yellow arrowheads.
Figure 7.
Plots of (A) blood vessel density, and (B) blood vessel-to-tissue area ratio as quantified from histology analyses. Data were presented as mean ± standard deviation (n = 4). * indicates significant difference between two groups (p<0.005), whereas NS means not statistically significant (p>0.005). For each sample, at least 200 blood vessels from 8 tissue sections were examined.
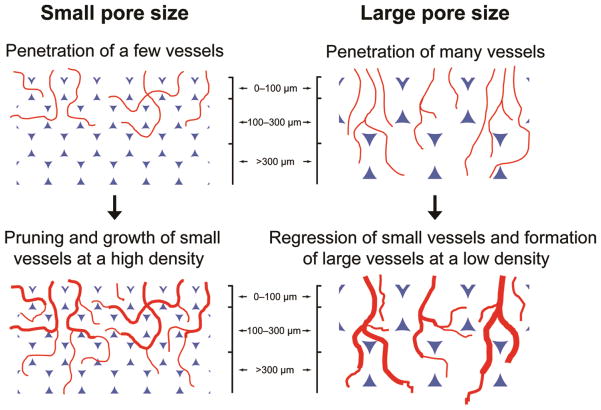
The histology and histomorphometric analyses suggested that the pore size of a scaffold could directly modulate the pattern and degree of neovascularization. Scaffolds with pore sizes smaller than 200 μm favored the formation of vascular networks with small vessels at high densities close to the surface, while vascular networks with large blood vessels and low densities could grow deeply into scaffolds with pore sizes larger than 200 μm. Figure 8 shows the mechanisms proposed to explain these observations on the development of neovasculatures in inverse opal scaffolds with different pore sizes. All four types of scaffolds should have allowed the initial penetration of similar numbers of vessels into the pores on the surface despite the difference in their surface pore sizes, because the percentage of open space was about the same in each case. Some of them competitively developed into large and interconnected vessels while others regressed when the nascent vasculature was consisted of too many small vessels.[38–41] This argument is supported by the observation that large vessels in low quantities formed in the scaffolds at 4 weeks close to the very top surface (50 μm in depth) where the vessels essentially encountered no barriers during the progression (Figure 6, left column and Figure 7, A and B). Although the total number of vessels initially penetrated into each scaffold was similar, scaffolds with small pore sizes had fewer numbers of vessels per pore. Such lower densities of vessels should have resulted in more vessels to grow and prune by themselves rather than forming large vessels by connecting with others, due to the separation by the polymer walls of the pores. Indeed, the density of blood vessels decreased (Figure 7A) while the blood vessel-to-tissue area ratios increased (Figure 7B) as the pore size increased in these scaffolds. After the initial infiltration of blood vessels from the top surface of the scaffolds, the pore size should then play an important role when these vessels further branch and penetrate deeper. It is obvious that it would take a substantially longer time for nascent vessels to cross the spherical pores at the surface of a scaffold when the pore size was increased. As a result, during the same period of time, the blood vessels in scaffolds with large pore sizes were growing and interconnecting with other vessels whereas the vessels in scaffolds with small pore sizes might have encountered the bottom of the spherical pores at the surface and started to enter the pores underneath through the windows. At this point, the window size would then become a critical parameter. For scaffolds with small pore sizes, after the invading tissues and nascent vessels had reached the bottom of the pores at the surface, they could not efficiently penetrate into the pores underneath because of the small windows, leading to three possible outcomes: i) a number of vessels would become trapped in a few layers of pores close to the surface as there were more vessels penetrating and branching than those could progress even deeper; ii) the physical barriers imposed by the polymer backbone of the scaffolds would eventually limit the number of vessels penetrating deeply into the scaffolds, resulting in low densities of blood vessels in the bulk; iii) as the vessels penetrated more deeply, they tended to be separated from each other in individual pores, and therefore could only grow by themselves rather than being interconnected with other vessels. On the contrary, for scaffolds with large pore sizes, the sufficiently large window sizes would allow the invasion of multiple vessels into individual pores underneath, making it possible for the vessels to merge with others. These two arguments regarding the effects of pore size and window size are supported by the following observations. Firstly, scaffolds with large pore sizes (224 and 312 μm) had higher blood vessel densities than those with small pore sizes at a depth of 200 μm at 2 weeks because of the absence of physical barriers for the invading vessels in these scaffolds at such a depth. Nevertheless, for scaffolds with pore sizes of 147 and 79 μm, the vessels had already encountered one and two layers of pores at such a depth, respectively, and a majority of them were blocked by the polymer backbone while some others could penetrate more deeply through the small windows. As more growing or branching vessels with small areas progressed from the top surface, most of them became trapped around this depth in scaffolds with small pore sizes at 4 weeks (Figures 3–5). By contrast, more vessels were able to penetrate to this depth in scaffolds with large pore sizes initially at 2 weeks, leading to decreased numbers of vessels and increased vessel-to-tissue ratios at 4 weeks due to merging and regressing (Figures 3–5). Secondly, while both the blood vessel densities and blood vessel-to-tissue area ratios were reduced in all types of scaffolds, the reduction in scaffolds with small pore sizes was more pronounced due to the obstruction by multiple layers of pores (Figure 6, right column and Figure 7). However, all of these vessels might have not been able to grow and interconnect with others during the period of time tested (4 weeks). This is why there were low blood vessel-to-tissue area ratios at 500 μm below the surface for all the scaffolds (Figure 6, right column and Figure 7B) compared to those close to the surface (Figure 3, right column and Figure 4, right column). Lastly, in addition to endothelial cells and pericytes, the migration of non-vascular cells (e.g., fibroblasts) is also one of the factors critical to neovascularization in a scaffold. As these peripheral cells migrate to the inner space of a scaffold, they tend to become hypoxic due to an environment with a low level of oxygen and thus secret angiogenic factors (e.g., vascular endothelial growth factor, VEGF).[42] These chemical cues can function to recruit endothelial (progenitor) cells, facilitating the development of a neovasculature. Therefore, the limited infiltration of non-vascular cells due to the small surface pore sizes, pore sizes, as well as window sizes could possibly count for another reason why poorer neovascularization developed in scaffolds with small pore sizes (note that in Figure 6, A and B, right column, the scaffolds with small pore sizes were poorly cellularized at the depth of 500 μm).
Figure 8.
Schematic illustrations of the mechanisms by which the pore size of a scaffold affects neovascularization in vivo.
It should be pointed out that, during our 4-week period of in vivo experiments, the PLGA scaffolds did not experience noticeable changes in their overall morphologies although slight deformation in some of the pores could be observed, presumably due to sample preparation for histology (i.e., dehydration and heating during the paraffin section procedures). As shown by the low-magnification images of hematoxylin and eosin stained sections at 4 weeks post implantation (Figure S1), all four types of scaffolds largely retained their structural integrity including the uniform pores and windows. According to our experience, the collapse of these scaffolds in vivo (subcutaneous implantation) typically did not occur until roughly 7–8 weeks post implantation. Therefore, the effect of scaffold degradation could be neglected in studying the pattern and degree of neovascularization.
3. Conclusions
In conclusion, by using inverse opal scaffolds with a well-defined inverse opal structure, we could precisely adjust the surface pore size, pore size, and window size of the scaffolds. When implanted in vivo, we found that scaffolds with small pore sizes favored the formation of smaller blood vessels at higher densities and poor penetration depth, while larger blood vessels at lower densities developed deeply in scaffolds with large pore sizes. We expect our finding on the effect of pore size on neovascularization to be highly useful in serving as a guideline for future design of porous scaffolds by providing a new insight into the mechanisms that control the ingrowth of blood vessels into porous scaffolds.
It should be pointed out that we varied the size of the templating gelatin microspheres and thus the resulting pore size of the inverse opal scaffold. The surface pore size and the window size were both proportional to the pore size. However, each of these two size parameters may be individually adjusted within a certain range depending on the conditions used for fabricating the scaffolds. The effect of variations in these parameters on the pattern and degree of vascular ingrowth requires future studies.
4. Experimental Section
Preparation of gelatin microspheres with different diameters by the fluidic device
The fluidic device consisted of a needle (BD, Franklin Lakes, NJ), a glass capillary (ACE glass, Little Rock, AR), and a silicone tube (1/16 in. i.d. × 3/16 in. o.d., VWR International, Radnor, PA). The device was fabricated by inserting the needle and glass capillary tube into the silicone tube, which was then fixed with epoxy adhesive. An aqueous solution of gelation (type A, from porcine skin, Sigma-Aldrich, St. Louis, MO) and a toluene solution containing Span® 80 (3 wt%, Sigma-Aldrich) served as the discontinuous and continuous phases, respectively. The two phases were independently introduced into the fluidic device by syringe pumps (KD200, KD Scientific, Holliston, MA). The syringe filled with gelatin solution was heated at 45 °C using a heating tape to prevent gelation. The gelatin droplets formed at the tip of the needle flowed along the glass capillary tube into a 1 L tall beaker containing 900 mL of the collection phase (toluene solution containing 3 wt% Span® 80) maintained in an ice bath and gently stirred overnight to allow the droplets to solidify. As shown in Table 1, the diameter of the microspheres was tuned by adjusting the flow rate of each phase, the concentration of gelatin, or the diameters of the needle and the glass capillary. The average diameter and standard deviation were calculated from optical micrographs (Axio Observer, Carl Zeiss, New York, NY) by measuring the diameters of over 100 particles randomly from each sample using ImageJ software (NIH, Bethesda, MD).
Fabrication of inverse opal scaffolds
PLGA inverse opal scaffolds were fabricated according to our previous reports.[33–36] In a typical procedure, ~10 g of a 1.5 wt% dispersion of gelatin microspheres in methanol was added into a 50-mL centrifuge tube, gently tapped, and packed into a cubic-close packed (ccp) lattice. The tube was then tightly capped and placed in an oven heated at 70 °C for 1 h to induce fusion among adjacent gelatin microspheres. After cooling to room temperature, the ccp lattice was carefully harvested as a pellet using a spatula, placed on filter paper to remove methanol, and infiltrated with a PLGA solution in 1,4-dioxane (20 wt%). After removing the excess PLGA solution with filter paper, the pellet with PLGA solution was frozen at −20 °C for 5 h and then lyophilized in a freeze-dryer (Labconco, Kansas City, MO) overnight. Finally, the pellet with freeze-dried PLGA was placed in a 50-mL centrifuge tube filled with ~10 mL ethanol under mild vacuum for 5 min to completely remove the air trapped inside due to the freeze-drying process. The samples were subsequently immersed in a 1 L tall beaker containing 900 mL of water heated at 45 °C for 3 h with gentle stirring to dissolve the gelatin templates (usually ~10 samples per beaker). After cooling down to room temperature, the PLGA scaffolds were collected in water. The scaffolds had a diameter of ~4 mm at the top surface, a thickness of ~1 mm, and a diameter of ~6 mm at the bottom due to the mold used (50-mL centrifuge tubes). Prior to implantation, the scaffolds were sterilized overnight in 70% ethanol and rinsed three times with sterile phosphate buffered saline.
Experimental design and surgical procedure
Sixteen adult male athymic nude mice (7–8 weeks old, Harlan Laboratories Inc., Indianapolis, IN) were randomly divided into eight groups (I–VIII) with two animals in each group. Animals in all groups were anesthetized by administration of gaseous isoflurane (2%, Butler Inc., Dublin, OH) and aseptically prepared for implantation of scaffolds. Two parasagittal incisions were made on the dorsum of each animal approximately 1 cm rostal to the hip and 0.5 cm lateral to the spine. Subcutaneous pockets were created lateral to both incisions by separating the subcutaneous facial plane using blunt dissection. One scaffold was inserted into each subcutaneous pocket (i.e., two scaffolds per animal) and positioned such that the top surface of the scaffold opposed the layer of connective tissue underlying the dermis. Animals in Groups I and V, II and VI, III and VII, and IV and VIII received inverse opal scaffolds with pore sizes of 79, 147, 224, and 312 μm, respectively. Skin incisions were then closed with 5–0 Ethilon suture (Ethicon, Somerville, NJ) and secured using VetBond dermal adhesive (3M, St. Paul, MN). Two weeks post implantation all animals in Groups I–IV were euthanized using sodium pentobarbital (200 mg/kg, IP) prior to explantation of the scaffolds. Four weeks post implantation all animals in Groups V–VIII were similarly euthanized prior to explantation of the scaffolds. All surgical procedures were performed in accordance with the National Institutes of Health (NIH, Bethesda, MD) Guidelines and were approved by the Washington University Animal Studies Committee.
Histological assessment and histomorphometric analyses
Following explantation, the PLGA scaffolds were fixed in 3.7% formaldehyde in phosphate buffered saline (PBS, Invitrogen, Carlsbad, CA) for 24 h, dehydrated, embedded in paraffin wax, and then serially sectioned (5 μm in thickness). The collected cross sections were mounted on glass slides and stained with hematoxylin and eosin to examine infiltration of host tissues and vasculatures into the scaffolds. The as-prepared slides were imaged using a Nanozoomer 2.0-HT slide scanner (Hamamatsu, Hamamatsu City, Japan). The acquired images were utilized to quantify both the blood vessel density and the blood vessel-to-tissue area ratio in the porous structures of the scaffolds using ImageJ software (NIH). Specifically, to calculate the density, blood vessels were manually counted and the number was normalized against the area of the scaffold/tissue section, and expressed in the form of number per mm2. The blood vessel-to-tissue area ratio was calculated by normalizing the total area of all the blood vessels against the area of the scaffold/tissue section, and was expressed in the form of percentage. For each sample, at least 200 blood vessels from 8 tissue sections randomly chosen within the region of interest were examined.
Statistical analysis
Results were reported as mean ± standard deviation, unless otherwise noted. Statistical analyses were performed using Statistica software (Version 6.0, Statsoft, Tulsa, OK). Planned comparisons were made between both experimental and control groups via analysis of variance (ANOVA) using Fisher’s least significant difference (LSD) test for planned comparisons between groups. Statistical significance was set at p<0.005 to account for multiple comparisons.
Scanning electron microscopy
Scanning electron microscopy (SEM, Nova NanoSEM 2300, FEI) was used to characterize the PLGA inverse opal scaffolds. Prior to imaging, the samples were sputter-coated with gold for ~60 s. Images were taken at an accelerating voltage of 5 kV.
Supplementary Material
Footnotes
This work was supported in part by an NIH Director’s Pioneer Award (DP1 OD000798) and startup funds from Washington University in St. Louis. This research used the Alafi Neuroimaging Facility at the Hope Center for Neurological Disorders (NIH Neuroscience Blueprint Center Core Grant P30 NS057105).
References
- 1.Langer R, Vacanti JP. Science. 1993;260:920. doi: 10.1126/science.8493529. [DOI] [PubMed] [Google Scholar]
- 2.Langer R. e-Biomed: J Regen Med. 2004;1:5. [Google Scholar]
- 3.Langer R. Adv Mater. 2009;21:3235. doi: 10.1002/adma.200902589. [DOI] [PubMed] [Google Scholar]
- 4.Ma PX. Mater Today. 2004;7:30. [Google Scholar]
- 5.Hollister SJ. Nat Mater. 2005;4:518. doi: 10.1038/nmat1421. [DOI] [PubMed] [Google Scholar]
- 6.Jain RK, Au P, Tam J, Duda DG, Fukumura D. Nat Biotechnol. 2005;23:821. doi: 10.1038/nbt0705-821. [DOI] [PubMed] [Google Scholar]
- 7.Moon JJ, West JL. Curr Top Med Chem. 2008;8:300. doi: 10.2174/156802608783790983. [DOI] [PMC free article] [PubMed] [Google Scholar]
- 8.Quint C, Kondo Y, Manson RJ, Lawson JH, Dardik A, Niklason LE. Proc Natl Acad of Sci USA. 2011;108:9214. doi: 10.1073/pnas.1019506108. [DOI] [PMC free article] [PubMed] [Google Scholar]
- 9.Pieper JS, van Wachem PB, van Luyn MJA, Brouwer LA, Hafmans T, Veerkamp JH, van Kuppevelt TH. Biomaterials. 2000;21:1689. doi: 10.1016/s0142-9612(00)00052-1. [DOI] [PubMed] [Google Scholar]
- 10.Anderson CR, Ponce AM, Price RJ. J Histochem Cytochem. 2005;52:1063. doi: 10.1369/jhc.4A6250.2004. [DOI] [PubMed] [Google Scholar]
- 11.Tabata Y, Miyao M, Yamamoto M, Ikada Y. J Biomater Sci Polymer Ed. 1999;10:957. doi: 10.1163/156856299x00559. [DOI] [PubMed] [Google Scholar]
- 12.Sheridan MH, Shea LD, Peters MC, Mooney DJ. J Control Release. 2000;64:91. doi: 10.1016/s0168-3659(99)00138-8. [DOI] [PubMed] [Google Scholar]
- 13.Richardson TP, Peters MC, Ennett AB, Mooney DJ. Nat Biotechnol. 2001;19:1029. doi: 10.1038/nbt1101-1029. [DOI] [PubMed] [Google Scholar]
- 14.Perets A, Baruch Y, Weisbuch F, Shoshany G, Neufeld G, Cohen S. J Biomed Mater Res. 2003;65:489. doi: 10.1002/jbm.a.10542. [DOI] [PubMed] [Google Scholar]
- 15.Holder WD, Gruber HE, Roland WD, Moore AL, Culberson CR, Loebsack AB, Burg KJL, Mooney DJ. Tissue Eng. 1997;3:149. [Google Scholar]
- 16.Rafii S, Lyden D. Nat Med. 2003;9:702. doi: 10.1038/nm0603-702. [DOI] [PubMed] [Google Scholar]
- 17.Jabbarzadeh E, Starnes T, Khan YM, Jiang T, Wirtel AJ, Deng M, Lv Q, Nair LS, Doty SB, Laurencin CT. Proc Natl Acad Sci USA. 2008;105:11099. doi: 10.1073/pnas.0800069105. [DOI] [PMC free article] [PubMed] [Google Scholar]
- 18.a) Klenke FM, Liu Y, Yuan H, Hunziker EB, Siebenrock KA, Hofstetter W. J Biomed Mater Res A. 2007;85:777. doi: 10.1002/jbm.a.31559. [DOI] [PubMed] [Google Scholar]; b) Druecke D, Langer S, Lamme E, Pieper J, Ugarkovic M, Steinau HU, Homann HH. J Biomed Mater Res A. 2004;68:10. doi: 10.1002/jbm.a.20016. [DOI] [PubMed] [Google Scholar]
- 19.Lutolf MP, Hubbell JA. Nat Biotechnol. 2005;23:47. doi: 10.1038/nbt1055. [DOI] [PubMed] [Google Scholar]
- 20.Boyan BD, Hummert TW, Dean DD, Schwartz Z. Biomaterials. 1996;17:137. doi: 10.1016/0142-9612(96)85758-9. [DOI] [PubMed] [Google Scholar]
- 21.Harley BA, Kim HD, Zaman MH, Yannas IV, Lauffenburger DA, Gibson LJ. Biophys J. 2008;95:4013. doi: 10.1529/biophysj.107.122598. [DOI] [PMC free article] [PubMed] [Google Scholar]
- 22.a) Marshall AJ, Barker T, Sage EH, Hauch KD, Ratner BD. 7th World Biomaterials Congress; The Australian Society for Biomaterials Inc., Sydney. 2004. p. 710. [Google Scholar]; b) Madden LR, Mortisen DJ, Sussman EM, Dupras SK, Fugate JA, Cuy JL, Hauch KD, Laflamme MA, Murry CE, Ratner BD. Proc Natl Acad Sci USA. 2010;107:15211. doi: 10.1073/pnas.1006442107. [DOI] [PMC free article] [PubMed] [Google Scholar]
- 23.Bai F, Zhang J, Wang Z, Lu J, Chang J, Liu J, Meng G, Dong X. Biomed Mater. 2011;6:015007. [Google Scholar]
- 24.Kotov NA, Liu Y, Wang S, Cumming C, Eghtedari M, Vargas G, Motamedi M, Nichols J, Cortiella J. Langmuir. 2004;20:7887. doi: 10.1021/la049958o. [DOI] [PubMed] [Google Scholar]
- 25.Stachowiak AN, Bershteyn A, Tzatzalos E, Irvine DJ. Adv Mater. 2005;17:399. [Google Scholar]
- 26.Choi SW, Xie J, Xia Y. Adv Mater. 2009;21:2997. doi: 10.1002/adma.200803504. [DOI] [PMC free article] [PubMed] [Google Scholar]
- 27.Chung KY, Mishra NC, Wang CC, Lin FH, Lin KH. Biomicrofluidics. 2009;3:22403. doi: 10.1063/1.3122665. [DOI] [PMC free article] [PubMed] [Google Scholar]
- 28.Lin J-Y, Lin W-J, Hong W-H, Hung W-C, Nowotarski SH, Gouveia SM, Cristo I, Lin K-H. Soft Matter. 2011. [Google Scholar]
- 29.Lee J, Cuddihy MJ, Cater GM, Kotov NA. Biomaterials. 2009;30:4687. doi: 10.1016/j.biomaterials.2009.05.024. [DOI] [PubMed] [Google Scholar]
- 30.Stachowiak AN, Irvine DJ. J Biomed Mater Res A. 2008;85A:815. doi: 10.1002/jbm.a.31661. [DOI] [PubMed] [Google Scholar]
- 31.Liu B, Jin Z, Qu X, Yang Z. Macromol Rapid Commun. 2007;28:322. [Google Scholar]
- 32.Choi SW, Xie J, Xia Y. Adv Mater. 2009;21:2997. doi: 10.1002/adma.200803504. [DOI] [PMC free article] [PubMed] [Google Scholar]
- 33.Choi SW, Zhang Y, Thomopoulos S, Xia Y. Langmuir. 2010;26:12126. doi: 10.1021/la101519b. [DOI] [PMC free article] [PubMed] [Google Scholar]
- 34.Zhang Y, Cai X, Choi SW, Kim C, Wang LV, Xia Y. Biomaterials. 2010;31:8651. doi: 10.1016/j.biomaterials.2010.07.089. [DOI] [PMC free article] [PubMed] [Google Scholar]
- 35.Choi SW, Zhang Y, Xia Y. Langmuir. 2010;26:19001. doi: 10.1021/la104206h. [DOI] [PMC free article] [PubMed] [Google Scholar]
- 36.Zhang Y, Choi SW, Xia Y. Macromol Rapid Commun. 2012;33:296. doi: 10.1002/marc.201100695. [DOI] [PubMed] [Google Scholar]
- 37.Zhang Y, Xia Y. Adv Funct Mater. 2011;22:121. [Google Scholar]
- 38.Carmeliet P. Nat Med. 2000;6:389. doi: 10.1038/74651. [DOI] [PubMed] [Google Scholar]
- 39.Cameliet P, Conway EM. Nat Biotechnol. 2001;19:1019. doi: 10.1038/nbt1101-1019. [DOI] [PubMed] [Google Scholar]
- 40.Carmeliet P. Nat Med. 2003;9:653. doi: 10.1038/nm0603-653. [DOI] [PubMed] [Google Scholar]
- 41.Djonov V, Schmid M, Tschanz SA, Burri PH. Circ Res. 2000;86:286. doi: 10.1161/01.res.86.3.286. [DOI] [PubMed] [Google Scholar]; Burri PH, Djonov V. Mol Aspects Med. 2002;23:1. doi: 10.1016/s0098-2997(02)00096-1. [DOI] [PubMed] [Google Scholar]
- 42.Steinbrech DS, Longaker MT, Mehrara BJ, Saadeh PB, Chin GS, Gerrets RP, Chau DC, Rowe NM, Gittes GK. J Surg Res. 1999;84:127. doi: 10.1006/jsre.1999.5627. [DOI] [PubMed] [Google Scholar]
Associated Data
This section collects any data citations, data availability statements, or supplementary materials included in this article.


