

Abstract
The characteristic features of senescent cells such as their “flattened” appearance, enlarged nuclei and low saturation density at the plateau phase of cell growth, can be conveniently measured by image-assisted d cytometry such as provided by the laser scanning cytometry (LSC). The “flattening” of senescent cells is reflected by the decline in local density of staining (intensity of maximal pixel) of DNA-associated fluorescence [4,6-diamidino-2- phenylindole (DAPI)] paralleled by an increase in nuclear size (area). Thus, the ratio of the maximal pixel of DAPI fluorescence per nucleus to the nuclear area provides a very sensitive morphometric biomarker of “depth” of senescence, which progressively declines during induction of senescence. Also recorded is cellular DNA content revealing cell cycle phase, as well as the saturation cell density at plateau phase of growth, which is dramatically decreased in cultures of senescent cells. Concurrent immunocytochemical analysis of expression of p21WAF1, p16INK4a or p27KIP1 cyclin kinase inhibitor provides additional markers of senescence. These biomarker indices can be expressed in quantitative terms (“senescence indices”) as a fraction of the same markers of the exponentially growing cells in control cultures.
Keywords: Cell aging, chromatin structure, cell cycle, apoptosis, nuclear size, laser scanning cytometry, p21WAF1, p16INK4a, p27KIP1, premature cell senescence
1. Introduction
Cellular senescence can be subdivided into two distinct categories. The first is replicative senescence, observed after certain rounds of division as a loss of replicative capacity of normal proliferating diploid cells in culture (“Hayflick’s limit”) (1). This type of senescence is a consequence of a progressive shortening of telomeres with each division until a cell reaches the state of telomere dysfunction (2). The second category is independent on telomere shortening or dysfunction and is referred to as premature cell senescence (review, 3). Persistent cellular stress including oxidative DNA damage leading to constitutive replication stress (4,5), activation of oncogenes (6) and loss of tumor suppressor genes (7) are among the factors and mechanisms inducing premature cells senescence. Although during chemo- or radio- therapy apoptosis is preferred mode of cell death in certain malignancies such as acute leukemias, in solid tumors the mechanism of growth suppression often relies on irreversible impairment of cell reproductive capacity defined as a drug- or radiation-induced senescence, which also belongs to the category of premature senescence (8,9). There is growing body of evidence that induction of premature senescence in vivo plays also a critical role as barrier in tumor development, including prevention of tumorigenesis of the induced pluripotent stem cells ( iPSCs; 10).
Regardless of the category and the mechanism of induction of senescence there are common markers to identify senescent cells. The most characteristic are morphological features (11). Senescent cells are characterized by much “flattened” appearance, enlarged and often irregular-shape nuclei, cytoplasmic granularities and low saturation density at the plateau phase of growth. An increase in cellular size is accompanied by an increase in nuclear and nucleolar size. There are numerous vacuoles in the cytoplasm, increased number of cytoplasmic microfilaments, the presence of enlarged lysosomal bodies and prominent Golgi apparatus (11–13). Also apparent in some types of cells are abnormalities of nuclear chromatin presented as senescence-associated heterochromatic foci (SAHF). SAHF are abundant in histone H3 modified at lysine 9 (K9M H3) and its binding partner heterochromatin protein 1 (HP1) (13–16).
Several molecular biomarkers also characterize senescent cells. Suppression of proliferation of these cells is to a large degree mediated by over-expression of inhibitors of cyclin-dependent kinases (CKIs) p21WAF1, p16INK4A and/or p27KIP1 associated with activation of tumor suppressor p53 pathways (17–20). Persistent expression of markers of DNA damage response, particularly of Ser139-phosphorylated histone H2AX (γH2AX), is an additional feature of senescent cells (21,22). These molecular markers, however, are neither unique nor highly specific to senescent cells. Among all biomarkers the most specific are: (i) the characteristic changes in cell morphology, and (ii) the induction of senescence-associated β-galactosidase activity, the latter considered to be the hallmark of cell senescence (23,24).
We have recently reported that one of the most specific morphological features of senescent cells, namely their “flattening” and nuclear enlargement, can be quantitatively assessed using imaging cytometry, such as provided by laser scanning cytometer (LSC) (25,26). LSC is the microscope-based quantitative-image analyzer that offers the combined advantages of flow cytometry and image analysis (27–29) (Fig. 1). It can analyze over 100 cells per second, record a large number of the measured parameters including cell morphometric data, and preserve images of the analyzed cells. We have recently shown that a simple assay based on measurement of nuclear size (area) combined with the intensity of maximal pixel of DNA-associated fluorescence per nucleus, after DNA staining with fluorescent dyes [(e.g. 4,6-diamidino-2-phenylindole (DAPI)], provides a convenient marker of the degree (“depth”) of cell senescence (25). The protocol for identification of senescent cells and for quantitative assessment of a “depth” of cell senescence is given below. This protocol includes also immunocytochemical detection of CKIs p21WAF1, p27KIP1 or p16INK4a which are additional, although as mentioned, not highly specific markers of senescent cells (17–20).
Fig. 1.
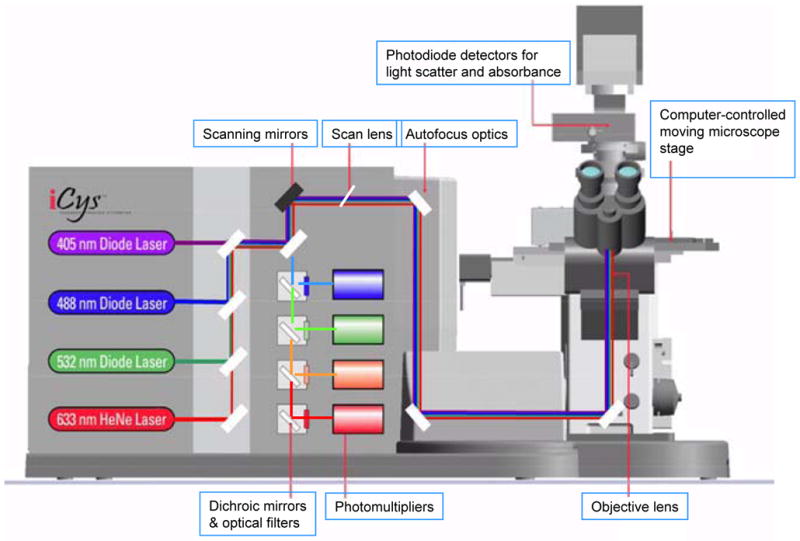
Schematic illustration of iCys® Research Imaging Cytometer outfitted with 405, 488, 532, and 633 nm lasers.
2. Materials
2.0. Common materials
Chambered slides, available from Nunc Lab-Tek II (Fisher Scientific, Pittsburgh, PA): see Subheading 3.1.
Phosphate-buffered saline (PBS), pH 7.4.
Formaldehyde (methanol-free, “ultrapure”) (Polysciences, Warrington, PA), 1% (v/v) in PBS (See note 1).
Ethanol (70%).
Coplin jars
Parafilm “M” (American National Can, Greenwich, CT)
Solution of 0.1%Triton X-100 (v/v) (Sigma/Aldrich, St. Louis, MO) in PBS
Antifade coverslips mounting medium (Invitrogen/Molecular Probes).
2.1. Immunocytochemical and DNA staining reagents
Bovine serum albumin (BSA; Sigma/Aldrich) dissolved (1%; w/v) in PBS (BSA solution)
p21WAF1 and/or p16INK4a and/or p27KIP1Ab (Santa Cruz Biotechnology, Santa Cruz, CA) (See subheading 3)
The secondary fluorochrome-tagged Abs: AlexaFluor 488 or AlexaFluor 633 Ab (Invitrogen/Molecular Probes, Eugene, OR).
Stock solution of 4′,6-diamidino-2-phenylindole (DAPI; Invitrogen/Molecural Probes). Dissolve 1 mg DAPI dihydrochloride in 1 mL of deionized water (2.66 mM concentration) (See note 2);
Staining solution of DAPI prepared freshly before the use: Add 5 uL of the stock DAPI solution to 2 mL of PBS (final DAPI concentration 2.5 ug/mL)
2.2. Equipment to measure cell fluorescence
3. Methods
3.1. Induction of cell senescence
The methodology is applicable to cells growing attached to surface of culture vessel and not to cells growing in suspension. Because morphology of cells undergoing replicative senescence (e.g. due to telomere dysfunction) is similar to that of premature senescence such as that of stress- or drug-induced, this protocol can be used to assess depth of senescence in either case. Prepare cell cultures by seeding cells on single- or multi- chambered incubation slides. (See notes 4, 5 and 6 for approaches to induce premature cell senescence in these chambered cultures).
3.2. Cell fixation and staining
Remove the culture medium from each chamber on the slide and replace it with PBS, to fill up the chamber
Remove PBS and replace it with ice-cold 1% formaldehyde solution in PBS, to fill up the chamber, close chambers caps. Keep cells in formaldehyde on ice for 15 min.
Remove formaldehyde and replace it with ice-cold 70% ethanol, close chamber caps and transfer slides to freezer at −20 °C. The slides can be stored in 70% ethanol at −20 °C for several days.
After storage in ethanol, carefully remove the chamber’s walls from the slides and incubate the slides in PBS in Coplin jars for 5min, then repeat incubation in fresh PBS for another 5 min.
Remove the slides from Coplin jar and place them horizontally in a moisturized chamber.
Carefully layer a small volume (approximately100 μl) of 0.1% Triton X-100 in PBS for 15min, then 1% BSA solution for 30min.
After 30 min replace the BSA solution with the solution of BSA containing primary p21 or p16 Ab at 1:100 dilution (See notes 7 and 8), incubate at room temperature for 1.5 h or overnight at 4°C.
Rinse the cells with 1% BSA solution in PBS and layer approximately 100 μl of BSA solution containing AlexaFluor 488 or AlexaFluor 633- tagged secondary Ab at 1:100 dilution (See note 7), incubate for 45min at room temperature.
Rinse the slides with PBS and layer approximately 100 μl of DAPI staining solution.
After 15 min, rinse away the DAPI staining solution with PBS, then add a drop of anti-fade mounting medium and mount under the coverslip (See note 9).
3.3. Fluorescence measurement and data analysis
Measure cell fluorescence on LSC. Excite DAPI fluorescence with 405 nm diode laser, AlexaFluor 488 with 488 nm diode laser and AlexaFluor 633 with 633 nm Helium-Neon laser. Collect blue (DAPI), green (AlexaFluor 488) and far red (AlexaFluor 633) fluorescence emission with the respective photomultipliers (See notes 10, 11, 12, and 13).
Fig. 2.
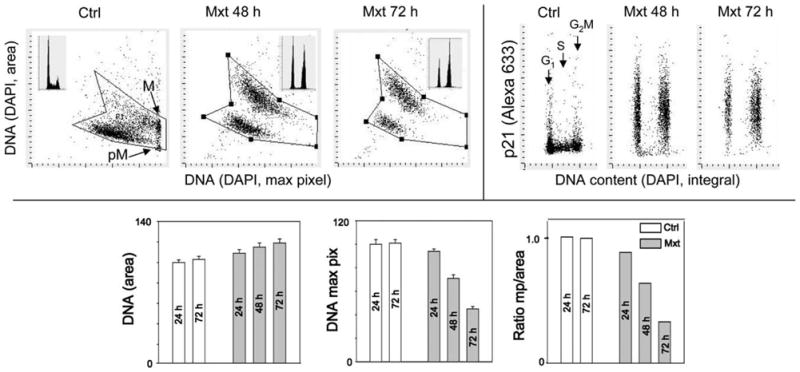
Analysis of nuclear changes and expression of p21WAF1 of A549 cells in cultures treated with Mxt to induce cell senescence.
The cells were untreated (Ctrl) or treated with 2 nM Mxt for 24, 48, or 72 h, their DNA was stained with DAPI and expression of p21WAF1 was detected immunocytochemically (AlexaFluor 633 nm indirect Ab). The intensity of maximal (max) pixel of DNA-bound DAPI fluorescence reveals highest local level of chromatin condensation per nucleus. In the untreated cultures mitotic (M) and immediately postmitotic (pM) cells have the highest value of maximal pixel, reflecting their highly condensed chromatin. In senescing cells due to “flattening” of the cell and nucleus, the nuclear area is increased and intensity of maximal pixel of DAPI fluorescence is decreased (25). The insets in the top left panels show DNA frequency histograms of cells from the respective cultures. The bar plots at the bottom panels show mean values (+standard deviation) of nuclear DNA(DAPI) area, mean value of DNA(DAPI) fluorescence intensity of maximal pixel per nucleus, and the ratio of maximal pixel to nuclear area. The ratio of maximal pixel to nuclear area of the Mxt-treated cells (“cell senescence index”; SI) is expressed as a fraction of such ratio of the respective control (untreated cells, cells growing exponentially) (SI = 1.0). The lowest is the SI value the greater is “depth’ of senescence.
Fig. 3.
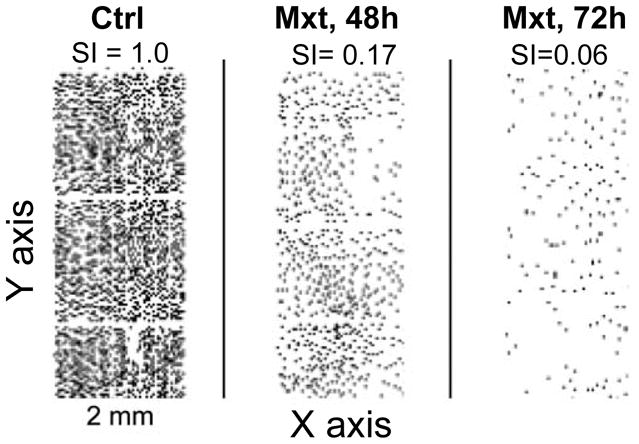
Decreased cell saturation density at confluence as another marker (senescence index, SI) reflecting “depth” of cell senescence.
The A6549 cells were untreated (Ctrl) or grown in the presence of 2 nM Mxt for 48 or 72 h in chamber slide-cultures. The cells were fixed and stained with DAPI as described in the protocol. Their presence and location on the slides concurrently with other parameters (measured as shown in Fig 2) was recorded by LSC (25,27–29). The observed decrease in cell density in the Mxt-treated cultures is presented as a fraction (senescence index, SI) of cell density in the untreated exponentially growing culture (SI = 1.00).
Acknowledgments
Supported by NCI grant RO1 28 704
Abbreviations
- Ab
Antibody
- ATM
Ataxia Telangiectasia mutated protein kinase
- BSA
Bovine serum albumin
- CKIs
Inhibitors of cyclin-dependent kinases
- DAPI
4,6-diamidino-2-phenylindole
- γH2AX
Ser139-phosphorylated histone H2AX
- HP1
heterochromatin protein 1
- iCys
Research Imaging Cytometer®
- Mtx
Mitoxantrone
- iPSCs
Induced pluripotent stem cells
- LSC
Laser scanning cytometry
- PBS
Phosphate-buffered saline
- PI
Propidium iodide
- SI
Senescence Index
- SAHF
Senescence-associated heterochromatic foci
- TSA
Trichosporin A
Footnotes
Formaldehyde is a strong carcinogenic agent. Care should be exercised in handling this reagent. It should be noted that the use of methanol-free formaldehyde, as specified in this protocol, substitutes the use of paraformaldehyde (solid state substance), which is even more hazardous since it requires heating to hydrolyze it to obtain formaldehyde.
The stock solution of DAPI is stable for several months when stored at 4°C in the dark.
Other type of fluorescence microscope or imaging system may by used provided that its capability for fluorescence analysis (hardware and software) makes possible to assess the cell nuclear area and intensity of maximal pixel of DNA-associated nuclear fluorescence (after staining with DAPI or with another DNA-fluorochrome).
Premature senescence can be induced by cell treatment with low concentrations of a DNA damaging drug, which leads to persistent replication stress revealed as inhibited progression through S phase. Alternatively one can induce premature senescence by upregulation of expression of CKIs which often arrests cells in G1 or G2. Activation of certain oncogenes that leads to enhancement of transcription and/or translation can also induce senescence. The premature cell senescence is optimally induced by promoting growth imbalance which takes place when cell growth (overall transcription and translation) continues concurrently with inhibition of cell cycle progression (25,30). When the rates of transcription and translation are high (e.g. activated by certain oncogenes) and cell cycle progression is abruptly halted the induction of senescence is rapid, generally seen within the time period equivalent of two to three cell generation times. Slowing the growth rate slows the induction- and reduces the depth- of cell senescence (25). (See notes 5 and 6).
We induced premature senescence by exposure of cells to low concentration of DNA topoisomerase II inhibitor mitoxantrone (Mxt) (25). Specifically human pulmonary carcinoma A549 cells cultured in Ham’s F12K medium (GIBCO/Invitrogen) or WI-38 fibroblasts grown in MEM Eagle Earle (GIBCO/Invitrogen) were treated with 1 or 2 nM Mxt (Sigma/Aldrich) for 2–4 days. In another set of experiments senescence of A549 or WI-37 cells was induced by treatment with 0.5 or 1.0 μM histone deacetylase inhibitor Trichostatin A (TSA) (Sigma/Aldrich) for 2 or 3 days (25).
Other drugs than Mxt or TSA can be used to induce premature cell senescence. As mentioned, their concentration should be high enough to arrest cell cycle progression but not too high to significantly suppress transcription and translation. The “depth” of cell senescence correlates with time interval of treatment with the drug. This protocol can also be used to assess replicative senescence of normal cells resulting from telomeres dysfunction (1,2).
For optimal immunocytochemical detection it is advised to test various dilutions (titer) of the primary and secondary Abs in the pilot experiments. Specifically, in addition to the concentration advised by the supplier, two-and four- fold lower and higher concentrations have to be tested. The optimal concentration is the one at which the signal to noise ratio (ratio of the highest fluorescence intensity of cells positively stained with Ab to fluorescence intensity of Ab-negative cells) is maximal.
Primary and /or secondary Abs from suppliers other than listed in this protocol can be used to immunocytochemically to detect p21WAF1, p16INK4a, or p27KIP1 protein. While ordering, check the supplier whether the primary Abs can be used for immunocytochemistry and not only for Western blotting.
To preserve the specimen for longer period of time or transport it, seal the cells mounted in anti-fade under coverslip with nail polish or melted paraffin.
In addition to measurement of fluorescence of DAPI concurrently with expression of p21WAF1, p16INK4a, or p27KIP1 other markers relevant to cell senescence can be analyzed. Among the latter are markers of DNA damage response such as expression of γH2AX and/or activation of Ataxia Telangiectasia mutated (ATM) protein kinase which can be detected by phospho-specific Abs and measured by LSC (31–33).
The integral of DAPI fluorescence intensity per nucleus provides information on cellular DNA content and thereby on cell cycle-phase distribution of the population of senescent cells (Fig. 2; DNA content frequency histograms).
Fluorochromes other than DAPI [e.g. Hoechst 33342, DyeCycle Violet, DRAQ5 or propidium iodide (PI)] can be used to stain DNA (33). The use of PI requires pretreatment of cells with RNase A.
Among the measured by LSC parameters useful to characterize “depth” of cell senescence are: (i) intensity of maximal pixel of DNA-associated fluorescence (DAPI); (ii) area of nucleus based on the image of DAPI-fluorescence, which equals to the number of DAPI pixels; (iii) fluorescence intensity of Ab used as a marker of the respective CKI (p21WAF1; p16INK4a or p27KIP1) integrated over the nucleus, and (iv) intensity of DAPI fluorescence over the nucleus (integral), providing information about position of cell in the cell cycle (G1 vs S vs G2M). Recorded is also cell density on the slide which provides information about the saturation density of cells at confluence. Compare changes in these parameters recorded on senescent cells with the control exponentially growing cells to obtain the ”Senescence Index” (SI). Examples of analysis of these parameters are provided in the legends to Fig. 2 and 3.
References
- 1.Hayflick L. The limited in vitro lifetime of human diploid cell strains. Exp Cell Res. 1965;37:614–636. doi: 10.1016/0014-4827(65)90211-9. [DOI] [PubMed] [Google Scholar]
- 2.Harley CB, Futcher AB, Greider CW. Telomeres shorten during ageing of human fibroblasts. Nature. 1990;345:458–460. doi: 10.1038/345458a0. [DOI] [PubMed] [Google Scholar]
- 3.Kuilman T, Michaloglou C, Mooi W, Peeper DS. The essence of senescence. Genes Dev. 2010;24:2463–2479. doi: 10.1101/gad.1971610. [DOI] [PMC free article] [PubMed] [Google Scholar]
- 4.Parrinello S, Samper E, Krtolica A, Goldstein J, Melov S, Campisi J. Oxygen sensitivity severely limits the replicative lifespan of murine fibroblasts. Nat Cell Biol. 2003;5:741–747. doi: 10.1038/ncb1024. [DOI] [PMC free article] [PubMed] [Google Scholar]
- 5.Sherr CJ, DePinho RA. Cellular senescence: Mitotic clock or culture shock? Cell. 2000;102:407–410. doi: 10.1016/s0092-8674(00)00046-5. [DOI] [PubMed] [Google Scholar]
- 6.Serrano M, Lin AW, McCurrach ME, Beach D, Lowe SW. Oncogenic ras provokes premature cell senescence associated with accumulation of p53 and p16INK4a. Cell. 1997;88:593–602. doi: 10.1016/s0092-8674(00)81902-9. [DOI] [PubMed] [Google Scholar]
- 7.Chen Z, Trotman LC, Shaffer D, Lin H-K, Dotan ZA, Niki M, Koutcher JA, Scher HI, Ludwig T, Gerald W, et al. Crucial role of p53-dependent cellular senescence in suppression of Pten-deficient tumorigenesis. Nature. 2005;436:725–730. doi: 10.1038/nature03918. [DOI] [PMC free article] [PubMed] [Google Scholar]
- 8.Gerwitz DA, Holt SE, Elmore LW. Accelerated senescence: An emerging role in tumor cell response to chemotherapy and radiation. Biochem Pharmacol. 2008;76:947–957. doi: 10.1016/j.bcp.2008.06.024. [DOI] [PubMed] [Google Scholar]
- 9.Litwiniec A, Grzanka A, Helmin-Basa A, Gackowska L, Grzanka D. Features of senescence and cell death induced by doxorubicin in A549 cells: Organization and level of selected cytoskeletal proteins. J Canc Res Clin Oncol. 2010;136:717–736. doi: 10.1007/s00432-009-0711-4. [DOI] [PubMed] [Google Scholar]
- 10.Banito A, Gil J. Induced pluripotent stem cells and senescence: Learning the biology to improve the technology. EMBO Reports. 2010;11:353–359. doi: 10.1038/embor.2010.47. [DOI] [PMC free article] [PubMed] [Google Scholar]
- 11.Cristofalo VJ, Pignolo RJ. Replicative senescence of human fibroblast-like cells in culture. Physiol Rev. 1993;78:617–625. doi: 10.1152/physrev.1993.73.3.617. [DOI] [PubMed] [Google Scholar]
- 12.Cho S, Hwang ES. Fluorescence-based detection and quantification of features of cellular senescence. Methods Cell Biol. 2010;103:149–188. doi: 10.1016/B978-0-12-385493-3.00007-3. [DOI] [PubMed] [Google Scholar]
- 13.Funayama R, Ishikawa F. Cellular senescence and chromatin structure. Chromosoma. 2007;116:431–440. doi: 10.1007/s00412-007-0115-7. [DOI] [PubMed] [Google Scholar]
- 14.Narita M, Lowe SW. Executing cell senescence. Cell Cycle. 2004;3:244–246. [PubMed] [Google Scholar]
- 15.Zhang R, Adams PD. Heterochromatin and its relationship to cell senescence. Cell Cycle. 2007;6:784–789. doi: 10.4161/cc.6.7.4079. [DOI] [PubMed] [Google Scholar]
- 16.Li Q, Ma L, Zhang Z-Y, Tong T-J. SAHF: A new biomarker of cellular senescence. Progress Biochem Biophys. 2007;11:1123–1128. [Google Scholar]
- 17.Qian Y, Chen X. Tumor suppression by p53: making cells senescent. Histol Histopathol. 2010;25:515–526. doi: 10.14670/hh-25.515. [DOI] [PMC free article] [PubMed] [Google Scholar]
- 18.Shen H, Maki CG. Persistent p21 expression after Nutlin-3a removal is associated with senescence-like arrest in 4N cells. J Biol Chem. 2010 May 20;2010 doi: 10.1074/jbc.M110.124990. (Epub) [DOI] [PMC free article] [PubMed] [Google Scholar]
- 19.Korotchkina LG, Demidenko ZN, Gudkov AV, Blagosklonny MV. Cellular quiescence caused by Mdm2 inhibitor nutlin-3A. Cell Cycle. 2009;8:3777–3781. doi: 10.4161/cc.8.22.10121. [DOI] [PubMed] [Google Scholar]
- 20.Demidenko ZN, Korotchkina LG, Gudkov AV, Blagosklonny MV. Paradoxical suppression of cellular senescence by p53. Proc Natl Acad Sci USA. 2009;107:9660–9664. doi: 10.1073/pnas.1002298107. [DOI] [PMC free article] [PubMed] [Google Scholar]
- 21.Mah LJ, El-Osta A, Karagiannis TC. γH2AX as a molecular marker of aging and disease. Epigenetics. 2010;5:129–136. doi: 10.4161/epi.5.2.11080. [DOI] [PubMed] [Google Scholar]
- 22.Malette FA, Farbeyre G. The DNA damage signaling pathway connects oncogenic stress to cellular senescence. Cell Cycle. 2007;6:1831–1836. doi: 10.4161/cc.6.15.4516. [DOI] [PubMed] [Google Scholar]
- 23.Dimri GP, Lee X, Basile G, Acosta M, Scott G, Rockelley C, Medrano EE, Linskens M, Rubelj I, Pereira-Smith O, Peacocke M, Campisi J. A biomarker that identifies senescent human cells in culture and in aging skin in vivo. Proc Natl Acad Sci USA. 1995;92:9363–9367. doi: 10.1073/pnas.92.20.9363. [DOI] [PMC free article] [PubMed] [Google Scholar]
- 24.Itahana K, Campisi J, Dimri GP. Methods to detect biomarkers of cellular senescence: the senescence-associated β-galactosidase assay. Meth Mol Biol. 2007;371:21–31. doi: 10.1007/978-1-59745-361-5_3. [DOI] [PubMed] [Google Scholar]
- 25.Zhao H, Halicka HD, Traganos F, Jorgensen E, Darzynkiewicz Z. New biomarkers probing depth of cell senescence assessed by laser scanning cytometry. Cytometry A. 2010;77A:99–107. doi: 10.1002/cyto.a.20983. [DOI] [PMC free article] [PubMed] [Google Scholar]
- 26.Nowicki TS, Zhao H, Darzynkiewicz Z, Moscatello A, Shin E, Schantz S, Tiwari RK, Geliebter J. Down-regulation of uPAR inhibits migration, invasion, proliferation, and FAK/PI3K/Akt signaling in papillary thyroid carcinoma cells. Cell Cycle. 2011;10:100–107. doi: 10.4161/cc.10.1.14362. [DOI] [PMC free article] [PubMed] [Google Scholar]
- 27.Kamentsky LA, Kamentsky LD. Microscope-based multiparameter laser scanning cytometer yielding data comparable to flow cytometry data. Cytometry. 1991;12:381–387. doi: 10.1002/cyto.990120502. [DOI] [PubMed] [Google Scholar]
- 28.Darzynkiewicz Z, Bedner E, Gorczyca W, Melamed MR. Laser scanning cytometry. A new instrumentation with many applications. Exp Cell Res. 1999;249:1–12. doi: 10.1006/excr.1999.4477. [DOI] [PubMed] [Google Scholar]
- 29.Henriksen M, Miller B, Newmark J, Al-Kofahi Y, Holden E. Laser scanning cytometry and its applications: a pioneering technology in the field of quantitative imaging. Methods Cell Biol. 2011;102:161–205. doi: 10.1016/B978-0-12-374912-3.00007-9. [DOI] [PubMed] [Google Scholar]
- 30.Gong JP, Traganos F, Darzynkiewicz Z. Growth imbalance and altered expression of cyclins B1, A. E and D3 in MOLT-4 cells synchronized in the cell cycle by inhibitors of DNA replication. Cell Growth & Differentiation. 1995;6:1485–1493. [PubMed] [Google Scholar]
- 31.Tanaka T, Halicka HD, Huang X, Traganos F, Darzynkiewicz Z. Constitutive histone H2AX phosphorylation and ATM activation, the reporters of DNA damage by endogenous oxidants. Cell Cycle. 2006;5:1940–1945. doi: 10.4161/cc.5.17.3191. [DOI] [PMC free article] [PubMed] [Google Scholar]
- 32.Zhao H, Tanaka T, Halicka HD, Traganos F, Zarebski M, Dobrucki J, Darzynkiewicz Z. Cytometric assessment of DNA damage by exogenous and endogenous oxidants reports the aging-related processes. Cytometry A. 2007;71A:905–914. doi: 10.1002/cyto.a.20469. [DOI] [PMC free article] [PubMed] [Google Scholar]
- 33.Zhao H, Traganos F, Dobrucki J, Wlodkowic D, Darzynkiewicz Z. Induction of DNA damage response by the supravital probes of nucleic acids. Cytometry A. 2009;75A:510–519. doi: 10.1002/cyto.a.20727. [DOI] [PMC free article] [PubMed] [Google Scholar]