

The precise spatial and temporal presentation of growth factors is critical for cartilage development, during which tightly controlled patterns of signals direct cell behavior and differentiation. This study elucidates the effects of varied conditions of transforming growth factor-β1-loaded microsphere incorporation on human mesenchymal stem cell chondrogenesis, demonstrating that both spatiotemporal growth factor presentation and donor variability influence chondrogenic differentiation within microsphere-incorporated cellular constructs.
Keywords: Adult stem cells, Chondrogenesis, Mesenchymal stem cells, TGF-β1, Stem cell-microenvironment interactions
Abstract
The precise spatial and temporal presentation of growth factors is critical for cartilage development, during which tightly controlled patterns of signals direct cell behavior and differentiation. Recently, chondrogenic culture of human mesenchymal stem cells (hMSCs) has been improved through the addition of polymer microspheres capable of releasing growth factors directly to cells within cellular aggregates, eliminating the need for culture in transforming growth factor-β1 (TGF-β1)-containing medium. However, the influence of specific patterns of spatiotemporal growth factor presentation on chondrogenesis within microsphere-incorporated cell systems is unclear. In this study, we examined the effects of altering the chondrogenic microenvironment within hMSC aggregates through varying microsphere amount, growth factor concentration per microsphere, and polymer degradation time. Cartilage formation was evaluated in terms of DNA, glycosaminoglycan, and type II collagen in hMSCs from three donors. Chondrogenesis equivalent to or greater than that of aggregates cultured in medium containing TGF-β1 was achieved in some conditions, with varied differentiation based on the specific conditions of microsphere incorporation. A more spatially distributed delivery of TGF-β1 from a larger mass of fast-degrading microspheres improved differentiation by comparison with delivery from a smaller mass of microspheres with a higher TGF-β1 concentration per microsphere, although the total amount of growth factor per aggregate was the same. Results also indicated that the rate and degree of chondrogenesis varied on a donor-to-donor basis. Overall, this study elucidates the effects of varied conditions of TGF-β1-loaded microsphere incorporation on hMSC chondrogenesis, demonstrating that both spatiotemporal growth factor presentation and donor variability influence chondrogenic differentiation within microsphere-incorporated cellular constructs.
Introduction
Because of the well-known inability of adult articular cartilage to undergo self-repair and the worldwide prevalence of osteoarthritis, cartilage is an attractive candidate for tissue engineering strategies. The majority of approaches to the repair and regeneration of articular cartilage are cell-based, using either mature articular chondrocytes harvested from a location of healthy tissue or progenitor cells capable of differentiating into chondrocytes. As harvesting healthy chondrocytes leads to problems such as donor-site morbidity, and mature chondrocytes are known to rapidly lose their phenotype during monolayer culture expansion, mesenchymal stem cells (MSCs) may be a better choice for tissue-engineered cartilage therapies.
MSCs from bone marrow are a popular therapeutic stem cell source because of both their multipotent differentiation capacity and their emerging role as cellular modulators within the body [1]. MSCs have been shown to differentiate into multiple cell types of the connective tissue lineage, including osteoblasts, adipocytes, and chondrocytes [2–5], and have been widely used for engineering a variety of tissues [6]. These cells are well-suited for tissue engineering applications, as they are available in relative abundance in the bone marrow and can be expanded through several passages in vitro without losing their multipotent differentiation capabilities. In particular, the chondrogenic differentiation capacity of MSCs has been explored as part of therapeutic strategies for the tissue engineering of articular cartilage. Bone marrow-derived MSCs can undergo chondrogenic differentiation under a specific set of culture conditions, including three-dimensional conformation of cells in high-density aggregates where abundant cell-cell interactions occur, and supplementation with transforming growth factor-β1 (TGF-β1) [2–4, 7]. Typically, these cell aggregates are cultured in vitro for a period of up to 3 weeks, resulting in neocartilage formation as indicated by the presence of articular cartilage-specific extracellular matrix molecules such as type II collagen and glycosaminoglycans (GAGs) [2–4, 7]. Within these cellular aggregates, however, differentiation may be limited by the diffusion of chondrogenic growth factor from the culture medium to cells within the aggregate interior [4]. Additionally, the extended in vitro culture periods are time-consuming and costly.
Recent advances in high-density chondrogenic stem cell culture involve the incorporation of growth factor-loaded polymer microspheres within cellular constructs, enabling cartilage production without exogenous growth factor supplementation [8–10]. Gelatin hydrogel microspheres are particularly useful for this application, as they are biocompatible, may deliver charged growth factors in a sustained manner, and degrade via cell-mediated proteolysis at rates dependent on the hydrogel cross-linking density [11]. The incorporation of gelatin hydrogel microspheres has been shown to improve the mechanical properties and matrix uniformity of densely cellular constructs, as well as helping the constructs to maintain shape [10]. Gelatin microsphere incorporation may also improve nutrient diffusion within cellular aggregates [12]. Within these cellular constructs, local delivery of chondrogenic growth factor eliminates the need for extended in vitro culture, potentially enabling earlier in vivo implantation as part of cartilage repair and regeneration strategies.
The precise spatial and temporal presentation of growth factors is critical for cartilage growth and development, during which tightly controlled patterns of signals direct cell behavior and differentiation [13]. Specific patterns of exposure to chondrogenic factors have also been shown to influence differentiation and neocartilage matrix production by MSCs in vitro, with varying effects based on growth factor concentration [2, 14] and on temporal [15, 16] and spatial [17, 18] delivery profiles. Within microsphere-incorporated cell systems, microenvironmental signaling involves multiple parameters, including local growth factor concentration and release rate, cell-biomaterial interactions, and spatial distribution of polymer and growth factor. The regulation of these parameters may be necessary to exert spatiotemporal control of microsphere-mediated MSC differentiation within these high cell density systems, but to date the impact of these factors on stem cell chondrogenesis remains unclear. To elucidate the effects of these complex interactions occurring within these systems, various conditions of gelatin microsphere-mediated growth factor delivery were explored in this study. Specifically, we aimed to determine the effects of TGF-β1 concentration, amount of incorporated microspheres, and polymer degradation rate on the chondrogenic differentiation of human MSCs (hMSCs) in aggregate culture.
Materials and Methods
hMSC Isolation and Culture
Bone marrow aspirates were obtained from the posterior iliac crest of three adult donors under a protocol approved by the University Hospitals of Cleveland Institutional Review Board and processed as previously described [19]. Briefly, the aspirates were washed with growth medium composed of low-glucose Dulbecco's modified Eagle's medium (DMEM) (Sigma-Aldrich, St. Louis, MO, http://www.sigmaaldrich.com) containing 10% prescreened fetal bovine serum (Gibco, Grand Island, NY, http://www.invitrogen.com) [20]. Mononucleated cells were isolated with a Percoll (Sigma-Aldrich) density gradient, seeded at a density of 1.8 × 10⁵ cells per cm2 in growth medium, and cultured at 37°C with 5% CO2 in a humidified incubator. After 4 days, nonadherent cells were removed via medium change. Subsequently, the medium was changed every 3 days. After approximately 14 days, primary cultures were subcultured and plated at 5 × 10³ cells per cm2. Cells were used at passage 2.
Gelatin Microsphere Synthesis
Gelatin microspheres were produced according to a protocol as previously described [10]. Briefly, 11.1 wt% acidic gelatin (Sigma-Aldrich) was added dropwise into 250 ml of olive oil (Gia Russa, Coitsville, OH, http://www.giarussa.com) and stirred for 10 minutes at 45°C. The temperature of the stirring solution was lowered to 4°C for 30 minutes, and 100 ml of chilled acetone (Fisher Chemical, Fairlawn, NJ, http://www.fishersci.com) was added. After 1 hour of constant stirring, another 100 ml of chilled acetone was added and stirring was continued for 5 minutes. The microspheres were then collected via filtration, washed with acetone to remove residual oil, and air dried. Dry microspheres were cross-linked at room temperature in an aqueous solution of 1 wt% genipin (Gp) (Wako USA, Richmond, VA, http://www.wakousa.com) in ultrapure deionized water (diH2O) for 2 hours (low-Gp) or 21 hours (high-Gp) to produce microspheres that were 28.3 ± 7.2% (low-Gp) and 67.6 ± 4.5% (high-Gp) cross-linked as measured by ninhydrin assay [10]. Cross-linked microspheres were collected via filtration, washed three times with ultrapure diH2O, and lyophilized. Microspheres were UV sterilized for 10 minutes and loaded with growth factor by soaking in a solution of TGF-β1 (Peprotech, Rocky Hill, NJ, http://www.peprotech.com) in phosphate-buffered saline (PBS) at pH 7.4 for 2 hours at 37°C. At this pH, complexation occurs between positively charged TGF-β1 and negatively charged acidic gelatin [21]. The volume of TGF-β1 solution added was much less than the equilibrium swelling volume of the microspheres to ensure complete absorption during loading [22]. Unloaded microspheres without growth factor were hydrated with PBS only.
Microsphere Size Characterization
Hydrated microspheres were imaged via light microscopy on a TMS microscope (Nikon, Tokyo, Japan, http://www.nikon.com) with a Coolpix 995 camera (Nikon), and their diameters were measured using NIH ImageJ analysis software (n = 245, low-Gp; n = 230, high-Gp).
Microsphere-Incorporated hMSC Aggregate Production
Sterile microspheres were loaded as described above with 400 ng of TGF-β1 per mg of microspheres (1× growth factor), 1,200 ng of TGF-β1 per mg of microspheres (3× growth factor), or PBS only. hMSCs were suspended at a concentration of 1.25 × 10⁶ cells per milliliter in a chemically defined medium (high-glucose DMEM with 1% ITS+ Premix [BD Biosciences, San Diego, CA, http://www.bdbiosciences.com], 37.5 μg/ml ascorbate-2-phosphate [Wako USA], 10−7 M dexamethasone [MP Biomedicals, Irvine CA, http://www.mpbio.com], 1% nonessential amino acids [HyClone, Logan, UT, http://www.hyclone.com], and 1% sodium pyruvate [HyClone]), and high-Gp or low-Gp microspheres with or without loaded growth factor were added at a concentration of 0 mg (for cell only controls), 0.05 mg of microspheres per aggregate (1× microsphere mass), or 0.15 mg of microspheres per aggregate (3× microsphere mass). Two-hundred-microliter aliquots of the cell suspensions with or without microspheres were added to the wells of sterile 96-well V-bottom polypropylene plates (Phenix, Candler, NC, http://phenixresearch.com), centrifuged for 5 minutes at 500g, and cultured in a humidified incubator at 37°C with 5% CO2 [9]. The medium was changed every other day, with 10 ng/ml TGF-β1 added to the medium of control aggregates without microspheres and aggregates containing microspheres without loaded growth factor. Negative control aggregates were also formed containing unloaded microspheres and cultured in medium without growth factor. Aggregates were harvested for analysis after 1 or 2 weeks.
Biochemical Analysis
Aggregates designated for DNA and GAG quantification (n = 4) were digested in a papain solution (Sigma-Aldrich) [23] at 65°C for 2 hours, and the digests were assayed for DNA and GAG content with PicoGreen (Invitrogen, Carlsbad, CA, http://www.invitrogen.com) [24] and dimethylmethylene blue dye (Sigma-Aldrich) [21], respectively.
Histology and Immunohistochemistry
After 2 weeks of culture, aggregates were fixed in formalin and paraffin-embedded (n ≥ 2). Five-micrometer sections from central regions of the aggregates were mounted on slides, deparaffinized and dehydrated, and stained for GAG content via Safranin O (Acros Organics, Geel, Belgium, http://www.acros.com) with a Fast Green counterstain (Fisher Chemical) or for type I and II collagen with a Histostain-Plus kit according to the manufacturer's instructions (Invitrogen) [25]. For immunohistochemistry, the primary antibody anti-collagen type I (Sigma-Aldrich), anti-collagen type II (catalog no. II-II6B3; Developmental Studies Hybridoma Bank, Iowa City, IA, http://www.uiowa.edu/∼dshbwww), or control mouse IgG (Vector Laboratories, Burlingame, CA, http://www.vectorlabs.com) was used at a 1:200 dilution. Aminoethyl carbazole chromogen reagent (Invitrogen) was used to visualize the target antigen (red) with a Fast Green counterstain. Slides were mounted with glycerol vinyl alcohol (Invitrogen) and imaged using an Axio Observer Z1 (Carl Zeiss, Jena, Germany, http://www.zeiss.com) inverted microscope equipped with an AxioVision digital camera (Carl Zeiss).
Statistical Analysis
Statistical analyses were performed using one-way analysis of variance with Tukey's post hoc tests with InStat 3.06 software (GraphPad Software, Inc., San Diego, CA, http://www.graphpad.com). Values of p < .05 were considered statistically significant. All values are reported as mean ± SD.
Results
Microsphere Size Characterization
Hydrated gelatin microspheres were smooth and generally spherical (Fig. 1A, 1B), with size distributions shown in the diameter histogram plot (Fig. 1C). High-Gp microspheres were a dark blue color because of the genipin cross-linking reaction [26].
Figure 1.
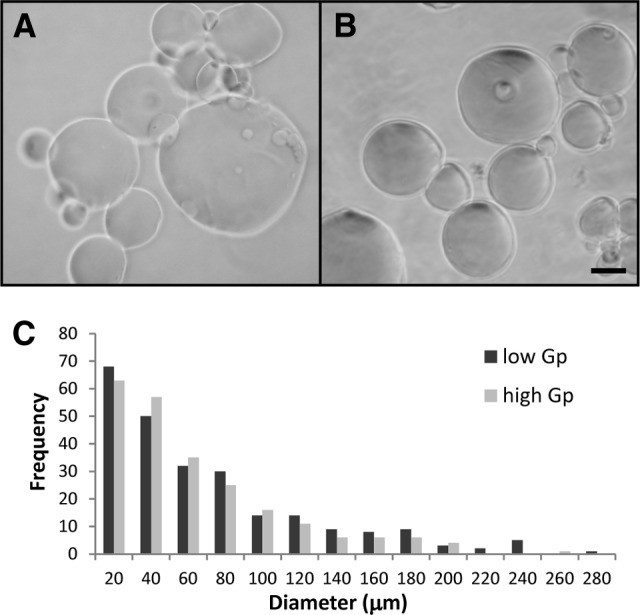
Cross-linked gelatin microspheres. (A, B): Light photomicrographs of low-Gp (A) and high-Gp (B) microspheres hydrated in phosphate-buffered saline. Scale bar = 50 μm. (C): Histogram of microsphere diameters. Abbreviation: Gp, genipin.
Microsphere-Incorporated hMSC Aggregate Production
Cell aggregates from three different donors were prepared for nine experimental conditions (Table 1). Negative control aggregates containing microspheres without growth factor cultured in medium without TGF-β1 were also formed, but most dissociated during culture. The negative control aggregates that did not dissociate were purely fibrous with no GAG staining, as indicated by histology (data not shown), and they were excluded from further analysis.
Table 1.
Experimental conditions of microsphere-incorporated human mesenchymal stem cell aggregate production
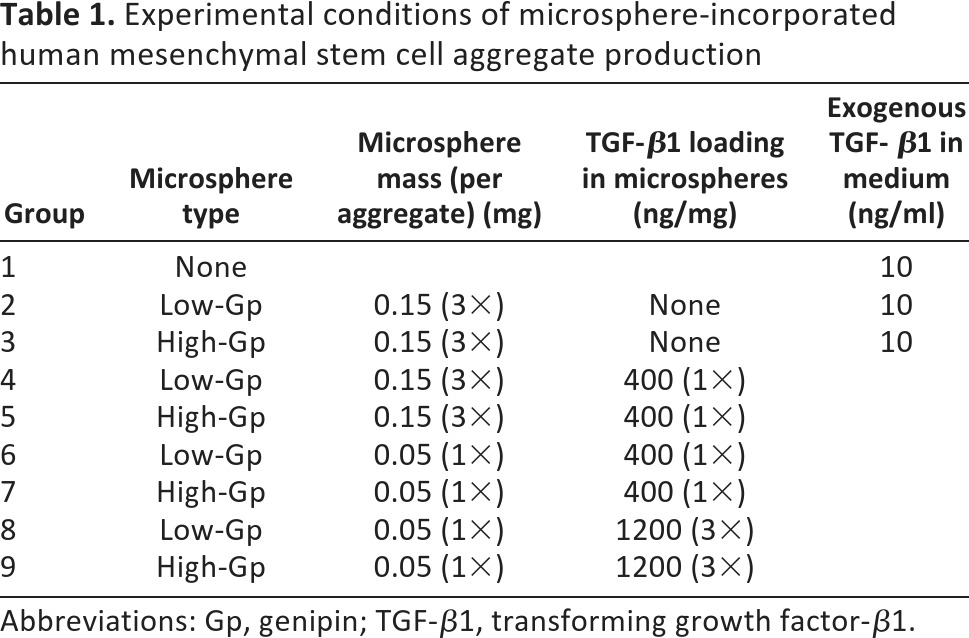
Abbreviations: Gp, genipin; TGF-β1, transforming growth factor-β1.
Biochemical Analysis
DNA and GAG content were quantified and comparisons for total GAG and GAG normalized to DNA were made among groups 1–9 for each individual donor at each time point (Fig. 2). Specifically, group 1 was compared with all other groups (groups 2–9), group 4 was compared with groups 6 and 8, group 5 was compared with groups 7 and 9, and groups 6 and 7 were compared with groups 8 and 9, respectively.
Figure 2.

DNA (top row), GAG (middle row), and GAG/DNA (bottom row) content in aggregates from three different human mesenchymal stem cell donors after 1 (light gray) and 2 (dark gray) weeks of culture. Comparisons of GAG and GAG/DNA were made among the nine groups at each time point for each donor. ×, Significantly greater than group 1; +, significantly less than all groups except 1 and 7; ★, significantly less than all groups except 3 and 7; ♦, significantly less than group 4; ♢, significantly less than group 5. Abbreviation: GAG, glycosaminoglycan.
Donor A
At week 1, very little GAG was measured for any of the groups. By week 2, all microsphere-incorporated aggregate groups had significantly more GAG and GAG per DNA than group 1, with the exception of groups 3 and 7. Notably, groups 4 and 5 were significantly greater than groups 6 and 7, respectively, in terms of both GAG and GAG per DNA at 2 weeks. GAG and GAG per DNA contents for group 4 were greater than those of group 8, but the difference was significant only for total GAG (not normalized to DNA).
Donor B
After 1 week, groups 2–4 had significantly more GAG and GAG per DNA than the control (group 1). Group 4 was significantly greater than 6 and 8, whereas group 5 was statistically equivalent to 7 and 9 in terms of both GAG and GAG per DNA. The average GAG and GAG per DNA values for group 7 were lower than those of groups 5 and 9, but the difference was significant only between groups 7 and 9. By week 2, groups 4 and 5 were significantly greater than groups 6 and 7, respectively, in terms of both GAG and GAG per DNA. GAG and GAG per DNA contents for group 4 were significantly greater than those of group 8, whereas those of groups 5 and 9 were equivalent.
Donor C
By week 1, more GAG was present in most of the groups from donor C than for the other two donors at the same time point. For donor C at 1 week, the GAG content for group 6 was significantly lower than all other groups except for group 7, and the GAG per DNA for group 6 was significantly less than that for all groups except 1 and 7. Total GAG was significantly higher in groups 8 and 9 than in group 1. By week 2, all of the GAG and GAG per DNA levels in the growth factor-loaded microsphere groups were similar, with groups 4 and 9 containing significantly more GAG per DNA than group 1.
Histological and Immunohistochemical Analysis
Histological sections were stained with Safranin O to indicate the presence of GAG within the cell aggregates after 2 weeks of culture. Representative sections from donor B are shown (Fig. 3). Areas of GAG staining and tissue morphologically resembling cartilage appeared in regions throughout the aggregates and were not always localized to areas in which growth factor-containing microspheres were visible. Dark blue high-Gp microspheres undergoing proteolytic degradation were present in groups 3, 5, 7, and 9. Some remnants of low-Gp microspheres undergoing degradation were apparent in groups 2 and 4, with very few microsphere remnants visible in groups 6 and 8. Generally, the histological results corresponded to the biochemical GAG data for all donors, with the most intense orange stain for donor B apparent in groups 1–5 and 9, with groups 6–8 exhibiting less total staining.
Figure 3.

Photomicrographs of representative Safranin O/Fast Green histology of microsphere-incorporated aggregates after 2 weeks of culture for each of the groups 1–9 from donor B. Scale bar = 200 μm. Dark blue residual microspheres are visible in groups incorporated with high-genipin microspheres (3, 5, 7, and 9).
Immunohistochemical staining for type I and type II collagen was performed to assess the amount and distribution of collagen within the cellular aggregates. The most intense type II collagen staining was observed in groups 1–5 and 9 (Fig. 4) and corresponded to regions that also exhibited GAG staining and areas of tissue morphologically resembling cartilage. The faintest overall type II staining was apparent in groups 6 and 7. Staining for type I collagen was very faint for all conditions tested, and no regions of intense stain were observed in any of the groups (Fig. 5).
Figure 4.

Photomicrographs of the regions of the most intense type II collagen staining (red) in aggregates after 2 weeks of culture for each of the groups 1–9 from donor B. Scale bar = 100 μm. Blue residual microspheres are visible in some of the groups incorporated with high-genipin microspheres (5 and 9).
Figure 5.

Photomicrographs of regions of faint type I collagen staining (red) in aggregates after 2 weeks of culture for each of the groups 1–9 from donor B. Scale bar = 100 μm. Blue residual microspheres are visible in some of the groups incorporated with high-genipin microspheres (5 and 9).
Discussion
The purpose of this study was to investigate the effects of varied conditions of growth factor-loaded gelatin microsphere incorporation on hMSC aggregate chondrogenesis. Gelatin microspheres were used in this system because of their ability to retain TGF-β1 via charge interactions with the hydrogel matrix [10]. Cross-linked gelatin hydrogels degrade via proteolysis in the presence of cell-secreted enzymes, at rates dependent on the level of hydrogel cross-linking [11, 27, 28]. Within this system, positively charged TGF-β1 is retained within the negatively charged gelatin matrix until polymer degradation occurs because of cell-mediated proteolytic activity, allowing growth factor release from the hydrogel microspheres [11, 27, 28]. Genipin was used as the microsphere cross-linking agent because of its low cytotoxicity [29]. The high and low cross-linked microspheres had similar size distributions with a wide range of diameters (Fig. 1C), indicating that the cross-linking density did not affect the microsphere size under these conditions. Based on our previous work, complete degradation of low-Gp microspheres was expected to occur within 2–3 weeks, whereas high-Gp microspheres were expected to undergo degradation over a period of more than 3 weeks [10].
The inclusion of microspheres did not affect DNA content in the aggregates, indicating that the incorporated microspheres had no apparent influence on cell viability or proliferation (Fig. 2). Although GAG levels varied widely among the three donors for the nine conditions tested (Fig. 2), group 4 (3× low-Gp microsphere mass, 1× growth factor) exhibited the most consistently high GAG production among the growth factor microsphere-incorporated groups after 2 weeks. In two of three donors, group 4 produced significantly more total GAG after 2 weeks than group 8 (1× low-Gp microsphere mass, 3× growth factor), which had the same total TGF-β1 loading but fewer fast-degrading microspheres with more growth factor per microsphere. It is plausible that the more spatially distributed presentation of a lower dose of growth factor by the larger mass of fast-degrading microspheres in group 4 had a positive effect on chondrogenesis within the cell aggregates. It is also possible that the rapid release of a high local concentration of TGF-β1 had detrimental effects on chondrogenic differentiation within the group 8 aggregates, although the cell viability was unaffected.
This trend was not evident in the high-Gp microsphere-loaded groups, and GAG production in group 5 (3× high-Gp microsphere mass, 1× growth factor) was generally equivalent to that of group 9 (1× high-Gp microsphere mass, 3× growth factor) after 2 weeks. This result could be due to the slower, more sustained rate of polymer degradation and growth factor delivery from the high-Gp microspheres. The high-Gp microspheres were only partially degraded after 2 weeks, and much of the incorporated TGF-β1 likely remained complexed within the gelatin matrix [11, 28]. This could potentially reduce the influence of local growth factor dose on aggregate chondrogenesis at this time point.
In many cases, GAG production in groups 4 and 5 was significantly greater than that in groups 6 and 7, respectively. This was expected, as groups 6 and 7 contained fewer microspheres but the same amount of growth factor per microsphere as in groups 4 and 5, resulting in less total TGF-β1 incorporated per aggregate [9]. In donor C, however, this effect was observed only at 1 week. This result serves to highlight the varied donor cell responses to different doses of TGF-β1 within this system. The variability in hMSC chondrogenesis among human donors was not unexpected, as it has been reported in other studies [30, 22].
Interestingly, in two of three donors, GAG production in the aggregates incorporated with non-growth-factor-loaded microspheres and cultured in TGF-β1-containing medium (groups 2 and 3) exceeded GAG production in the control (group 1). The incorporated microspheres themselves may have had some effect on differentiation within this system, as gelatin has been shown in previous studies to influence cell behavior [31, 32], potentially because of cellular interactions with integrin-binding domains on the material. However, without TGF-β1 supplied in the microspheres or in the culture medium, the gelatin microspheres were unable to induce aggregate chondrogenesis (data not shown), indicating that the material interactions alone were not responsible for the observed cartilage formation.
For all three donors tested, TGF-β1-loaded microsphere aggregates with a high total growth factor loading (groups 4, 5, 8, and 9) produced GAG at levels at least equivalent to and in some cases greater than those of the control (group 1) at 1 and 2 weeks. This result demonstrated that the growth factor released from microspheres incorporated within the aggregates was capable of inducing chondrogenesis at levels comparable to those achieved by traditional aggregate culture in TGF-β1-containing medium. For at least one time point for each donor, all three donors exhibited higher GAG production in group 4 than the control (group 1), indicating improved chondrogenesis under these conditions.
In aggregates initially incorporated with low-Gp microspheres (groups 2, 4, 6, and 8), most of the microspheres appeared to be degraded by 2 weeks (Fig. 3), which was consistent with the expected degradation time of the low cross-linked microspheres [9]. All aggregates initially incorporated with high-Gp microspheres (groups 3, 5, 7, and 9) had remaining microspheres that were visually apparent after 2 weeks (Fig. 3), which was expected because of the more prolonged degradation profile of the high cross-linked polymer [9]. Generally, the histological evidence of GAG production corresponded to the results of the biochemical analysis. Some regions of cartilage-like histological morphology were observed in aggregates from each of the nine groups, with areas of rounded cells separated from each other by regions of GAG-containing matrix. This was less evident in aggregates from groups 6 and 7, indicating weaker chondrogenesis in these groups. Histological GAG staining was not always colocalized with remaining undegraded growth factor-loaded microspheres in the aggregates. This could be due to the released growth factor acting on cells not in the immediate vicinity of the microspheres, or it could be that the regions of GAG production correspond to areas where growth factor-loaded microspheres had previously been located prior to undergoing complete degradation.
Immunohistochemical staining revealed the presence of type II collagen, an important molecular component of articular cartilage, in almost all of the aggregate groups, with the most staining present in groups 1–5 and 9. The regions of highest intensity of type II collagen staining (Fig. 4) corresponded to areas with intense GAG staining and neocartilaginous morphology, indicating chondrogenic differentiation and cartilage production within these regions. As with the GAG staining, the least overall type II collagen staining was observed in groups 6 and 7, demonstrating reduced differentiation as expected under these conditions of lower microsphere mass and growth factor concentration. The faint staining for type I collagen for all groups (Fig. 5) indicated a lack of fibrocartilage formation.
Notably, the distribution of hydrogel microspheres was not completely uniform throughout the cellular aggregates after 2 weeks. The uniformity of microsphere distribution could potentially be improved through the use of a self-assembly process for the formation of aggregates [33] or sheets [10] rather than centrifugation, allowing the cells and microspheres to settle out of suspension and coalesce into microsphere-containing cellular structures.
This system has applicability beyond examining the complex interactions occurring within microsphere-incorporated cell systems, and it could be used as a screening method to determine the optimal conditions of microsphere incorporation and growth factor presentation for application in engineered cartilage constructs of a more clinically relevant shape and size, such as microsphere-incorporated hMSC sheets [10]. Additionally, this system could also be used to explore the role of spatiotemporal presentation of other growth factors from microspheres to other cell populations in high-cell-density systems for the engineering of different tissues.
Conclusion
This study demonstrates differences in chondrogenic differentiation as a result of varied microsphere amounts, initial growth factor concentrations, and polymer degradation rates in hMSC aggregates from three donors. For all donors tested, GAG production was improved in aggregates with specific conditions of growth factor presentation from fast-degrading gelatin microspheres by comparison to aggregates without microspheres cultured in TGF-β1-containing medium. Chondrogenic differentiation was generally improved by the incorporation of a greater mass of TGF-β1-loaded microspheres rather than a smaller mass of microspheres with the same growth factor concentration per microsphere. In the conditions tested, incorporation of a larger mass of microspheres with a smaller growth factor concentration tended to induce chondrogenesis better than a smaller mass of microspheres with a higher growth factor concentration, but only in the case of fast-degrading microspheres. On the basis of the findings presented here, it may be possible to exert spatiotemporal control over chondrogenic differentiation and cartilage formation through the specific conditions of microsphere-mediated growth factor delivery within high-density cell systems. It is apparent that both conditions of microsphere-mediated growth factor presentation and MSC donor variability should be considered in the design of biopolymer-incorporated cellular constructs. In addition to its utility for examining the complex interactions occurring within microsphere-incorporated cell systems, the approach outlined here may be useful as a screening system to assess the chondrogenic potential of various conditions of microsphere incorporation within high-density stem cell cultures.
Acknowledgments
We thank Amad Awadallah for assistance with histological processing. This work was supported by NIH/National Institute of Arthritis and Musculoskeletal and Skin Diseases Grant T32 AR007505 (to L.D.S.), a National Science Foundation Graduate Research Fellowship (to P.N.D.), Biomedical Research and Technology Transfer Grant 09-071 from the Ohio Department of Development (to E.A.), and a New Scholar in Aging grant from the Ellison Medical Foundation (to E.A.).
Author Contributions
L.D.S.: conception and design, collection and/or assembly of data, data analysis and interpretation, manuscript writing, final approval of manuscript; C.D.D., P.N.D., and E.L.V.: collection and assembly of data, data analysis and interpretation; E.A.: conception and design, financial support, provision of study material or patents, collection and/or assembly of data, data analysis and interpretation, manuscript writing, final approval of manuscript.
Disclosure of Potential Conflicts of Interest
The authors indicate no potential conflicts of interest.
References
- 1.Caplan AI, Correa D. The MSC: An injury drugstore. Cell Stem Cell. 2011;9:11–15. doi: 10.1016/j.stem.2011.06.008. [DOI] [PMC free article] [PubMed] [Google Scholar]
- 2.Johnstone B, Hering TM, Caplan AI, et al. In vitro chondrogenesis of bone marrow-derived mesenchymal progenitor cells. Exp Cell Res. 1998;238:265–272. doi: 10.1006/excr.1997.3858. [DOI] [PubMed] [Google Scholar]
- 3.Mackay AM, Beck SC, Murphy JM, et al. Chondrogenic differentiation of cultured human mesenchymal stem cells from marrow. Tissue Eng. 1998;4:415–428. doi: 10.1089/ten.1998.4.415. [DOI] [PubMed] [Google Scholar]
- 4.Yoo JU, Barthel TS, Nishimura K, et al. The chondrogenic potential of human bone-marrow-derived mesenchymal progenitor cells. J Bone Joint Surg Am. 1998;80:1745–1757. doi: 10.2106/00004623-199812000-00004. [DOI] [PubMed] [Google Scholar]
- 5.Dennis JE, Merriam A, Awadallah A, et al. A quadripotential mesenchymal progenitor cell isolated from the marrow of an adult mouse. J Bone Miner Res. 1999;14:700–709. doi: 10.1359/jbmr.1999.14.5.700. [DOI] [PubMed] [Google Scholar]
- 6.Tuan RS, Boland G, Tuli R. Adult mesenchymal stem cells and cell-based tissue engineering. Arthritis Res Ther. 2003;5:32–45. doi: 10.1186/ar614. [DOI] [PMC free article] [PubMed] [Google Scholar]
- 7.Pittenger MF, Mackay AM, Beck SC, et al. Multilineage potential of adult human mesenchymal stem cells. Science. 1999;284:143–147. doi: 10.1126/science.284.5411.143. [DOI] [PubMed] [Google Scholar]
- 8.Fan H, Zhang C, Li J, et al. Gelatin microspheres containing TGF-beta3 enhance the chondrogenesis of mesenchymal stem cells in modified pellet culture. Biomacromolecules. 2008;9:927–934. doi: 10.1021/bm7013203. [DOI] [PubMed] [Google Scholar]
- 9.Solorio LD, Fu AS, Hernandez-Irizarry R, et al. Chondrogenic differentiation of human mesenchymal stem cell aggregates via controlled release of TGF-beta1 from incorporated polymer microspheres. J Biomed Mater Res A. 2010;92:1139–1144. doi: 10.1002/jbm.a.32440. [DOI] [PMC free article] [PubMed] [Google Scholar]
- 10.Solorio LD, Vieregge EL, Dhami CD, et al. Engineered cartilage via self-assembled hMSC sheets with incorporated biodegradable gelatin microspheres releasing transforming growth factor-beta1. J Control Release. 2012;158:224–232. doi: 10.1016/j.jconrel.2011.11.003. [DOI] [PMC free article] [PubMed] [Google Scholar]
- 11.Young S, Wong M, Tabata Y, et al. Gelatin as a delivery vehicle for the controlled release of bioactive molecules. J Control Release. 2005;109:256–274. doi: 10.1016/j.jconrel.2005.09.023. [DOI] [PubMed] [Google Scholar]
- 12.Hayashi K, Tabata Y. Preparation of stem cell aggregates with gelatin microspheres to enhance biological functions. Acta Biomater. 2011;7:2797–2803. doi: 10.1016/j.actbio.2011.04.013. [DOI] [PubMed] [Google Scholar]
- 13.Goldring MB, Tsuchimochi K, Ijiri K. The control of chondrogenesis. J Cell Biochem. 2006;97:33–44. doi: 10.1002/jcb.20652. [DOI] [PubMed] [Google Scholar]
- 14.Park H, Temenoff JS, Tabata Y, et al. Injectable biodegradable hydrogel composites for rabbit marrow mesenchymal stem cell and growth factor delivery for cartilage tissue engineering. Biomaterials. 2007;28:3217–3227. doi: 10.1016/j.biomaterials.2007.03.030. [DOI] [PMC free article] [PubMed] [Google Scholar]
- 15.Kim HJ, Kim YJ, Im GI. Is continuous treatment with transforming growth factor-beta necessary to induce chondrogenic differentiation in mesenchymal stem cells? Cells Tissues Organs. 2009;190:1–10. doi: 10.1159/000153041. [DOI] [PubMed] [Google Scholar]
- 16.Buxton AN, Bahney CS, Yoo JU, et al. Temporal exposure to chondrogenic factors modulates human mesenchymal stem cell chondrogenesis in hydrogels. Tissue Eng Part A. 2011;17:371–380. doi: 10.1089/ten.tea.2009.0839. [DOI] [PMC free article] [PubMed] [Google Scholar]
- 17.Chen J, Chen H, Li P, et al. Simultaneous regeneration of articular cartilage and subchondral bone in vivo using MSCs induced by a spatially controlled gene delivery system in bilayered integrated scaffolds. Biomaterials. 2011;32:4793–4805. doi: 10.1016/j.biomaterials.2011.03.041. [DOI] [PubMed] [Google Scholar]
- 18.Dormer NH, Singh M, Wang L, et al. Osteochondral interface tissue engineering using macroscopic gradients of bioactive signals. Ann Biomed Eng. 2010;38:2167–2182. doi: 10.1007/s10439-010-0028-0. [DOI] [PMC free article] [PubMed] [Google Scholar]
- 19.Haynesworth SE, Goshima J, Goldberg VM, et al. Characterization of cells with osteogenic potential from human marrow. Bone. 1992;13:81–88. doi: 10.1016/8756-3282(92)90364-3. [DOI] [PubMed] [Google Scholar]
- 20.Lennon DP, Haynesworth SE, Bruder SP, et al. Human and animal mesenchymal progenitor cells from bone marrow: Identification of serum for optimal selection and proliferation. In Vitro Cell Dev Biol Anim. 1996;32:602–611. [Google Scholar]
- 21.Farndale RW, Buttle DJ, Barrett AJ. Improved quantitation and discrimination of sulphated glycosaminoglycans by use of dimethylmethylene blue. Biochim Biophys Acta. 1986;883:173–177. doi: 10.1016/0304-4165(86)90306-5. [DOI] [PubMed] [Google Scholar]
- 22.Dexheimer V, Mueller S, Braatz F, et al. Reduced reactivation from dormancy but maintained lineage choice of human mesenchymal stem cells with donor age. PLoS One. 2011;6:e22980. doi: 10.1371/journal.pone.0022980. [DOI] [PMC free article] [PubMed] [Google Scholar]
- 23.Ponticiello MS, Schinagl RM, Kadiyala S, et al. Gelatin-based resorbable sponge as a carrier matrix for human mesenchymal stem cells in cartilage regeneration therapy. J Biomed Mater Res. 2000;52:246–255. doi: 10.1002/1097-4636(200011)52:2<246::aid-jbm2>3.0.co;2-w. [DOI] [PubMed] [Google Scholar]
- 24.McGowan KB, Kurtis MS, Lottman LM, et al. Biochemical quantification of DNA in human articular and septal cartilage using PicoGreen and Hoechst 33258. Osteoarthritis Cartilage. 2002;10:580–587. doi: 10.1053/joca.2002.0794. [DOI] [PubMed] [Google Scholar]
- 25.Estes BT, Diekman BO, Gimble JM, et al. Isolation of adipose-derived stem cells and their induction to a chondrogenic phenotype. Nat Protoc. 2010;5:1294–1311. doi: 10.1038/nprot.2010.81. [DOI] [PMC free article] [PubMed] [Google Scholar]
- 26.Touyama R, Inoue K, Takeda Y, et al. Studies on the blue pigments produced from genipin and methylamine 2. On the formation mechanisms of brownish-red intermediates leading to the blue pigment formation. Chem Pharm Bull (Tokyo) 1994;42:1571–1578. [Google Scholar]
- 27.Holland TA, Tessmar JK, Tabata Y, et al. Transforming growth factor-beta 1 release from oligo(poly(ethylene glycol) fumarate) hydrogels in conditions that model the cartilage wound healing environment. J Control Release. 2004;94:101–114. doi: 10.1016/j.jconrel.2003.09.007. [DOI] [PubMed] [Google Scholar]
- 28.Yamamoto M, Ikada Y, Tabata Y. Controlled release of growth factors based on biodegradation of gelatin hydrogel. J Biomater Sci Polym Ed. 2001;12:77–88. doi: 10.1163/156856201744461. [DOI] [PubMed] [Google Scholar]
- 29.Sung HW, Huang RN, Huang LL, et al. In vitro evaluation of cytotoxicity of a naturally occurring cross-linking reagent for biological tissue fixation. J Biomater Sci Polym Ed. 1999;10:63–78. doi: 10.1163/156856299x00289. [DOI] [PubMed] [Google Scholar]
- 30.Solchaga LA, Penick K, Goldberg VM, et al. Fibroblast growth factor-2 enhances proliferation and delays loss of chondrogenic potential in human adult bone-marrow-derived mesenchymal stem cells. Tissue Eng Part A. 2010;16:1009–1019. doi: 10.1089/ten.tea.2009.0100. [DOI] [PMC free article] [PubMed] [Google Scholar]
- 31.Kuwahara K, Yang Z, Slack GC, et al. Cell delivery using an injectable and adhesive transglutaminase-gelatin gel. Tissue Eng Part C Methods. 2010;16:609–618. doi: 10.1089/ten.TEC.2009.0406. [DOI] [PubMed] [Google Scholar]
- 32.Petrenko YA, Ivanov RV, Petrenko AY, et al. Coupling of gelatin to inner surfaces of pore walls in spongy alginate-based scaffolds facilitates the adhesion, growth and differentiation of human bone marrow mesenchymal stromal cells. J Mater Sci Mater Med. 2011;22:1529–1540. doi: 10.1007/s10856-011-4323-6. [DOI] [PubMed] [Google Scholar]
- 33.Welter JF, Solchaga LA, Penick KJ. Simplification of aggregate culture of human mesenchymal stem cells as a chondrogenic screening assay. Biotechniques. 2007;42:732, 734–737. doi: 10.2144/000112451. [DOI] [PMC free article] [PubMed] [Google Scholar]