

Abstract
The master regulator CtrA oscillates during the Caulobacter cell cycle due to temporally regulated proteolysis and transcription. It is proteolysed during the G1–S transition and reaccumulates in predivisional cells as a result of transcription from two sequentially activated promoters, P1 and P2. CtrA reinforces its own synthesis by directly mediating the activation of P2 concurrently with repression of P1. To explore the role of P1 in cell cycle control, we engineered a mutation into the native ctrA locus that prevents transcription from P1 but not P2. As expected, the ctrA P1 mutant exhibits striking growth, morphological and DNA replication defects. Unexpectedly, we found CtrA and its antagonist SciP, but not DnaA, GcrA or CcrM accumulation to be dramatically reduced in the ctrA P1 mutant. SciP levels closely paralleled CtrA accumulation, suggesting that CtrA acts as a rheostat to modulate SciP abundance. Furthermore, the reappearance of CtrA and CcrM in predivisional cells was delayed in the P1 mutant by 0.125 cell cycle unit in synchronized cultures. High levels of ccrM transcription despite low levels of CtrA and increased transcription of ctrA P2 in the ctrA P1 mutant are two examples of robustness in the cell cycle. Thus, Caulobacter can adjust regulatory pathways to partially compensate for reduced and delayed CtrA accumulation in the ctrA P1 mutant.
Introduction
Oscillating master regulators drive both the prokaryotic and the eukaryotic cell cycles. These transcription factors are themselves regulated at multiple levels to ensure that they perform critical functions only during the correct time of the cell cycle. In the cell cycle of the aquatic Gram-negative bacterium Caulobacter crescentus, three proteins (DnaA, GcrA and CtrA) control the expression of over 200 (Holtzendorff et al., 2004; Hottes et al., 2005; Laub et al., 2002) of Caulobacter’s 553 cell cycle-regulated genes (Laub et al., 2000). The CcrM adenine DNA methyltranferase has been suggested as a fourth cell cycle master regulator for its effect on transcription via methylation of promoters, creating a complete core circuit (Collier et al., 2007). The temporal oscillation of the accumulation of the four core master regulators during the cell cycle is depicted in Fig. 1.
Fig. 1.
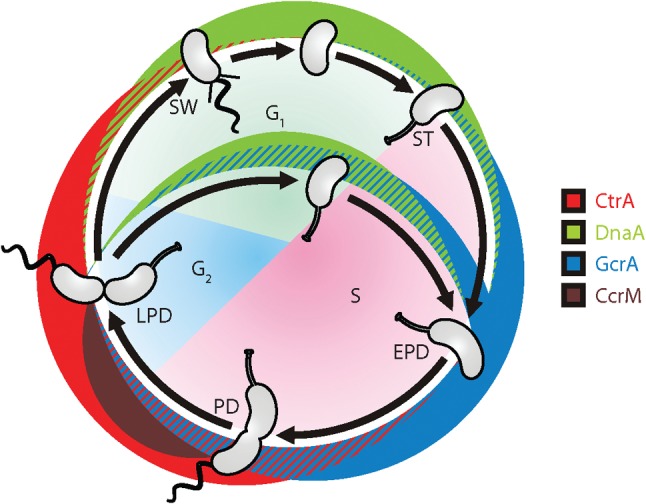
The four core oscillating master regulators of the Caulobacter cell cycle. The stages of the Caulobacter cell cycle are analogous to those of the eukaryotic cell cycle with G0, G1 and S phases. DnaA notably initiates DNA replication, GcrA activates the transcription of genes involved in DNA replication elongation and chromosome segregation, CtrA represses the initiation of DNA replication and controls genetic modules involved in cell polarity and cell division, and CcrM, a DNA N6-adenine methylase, regulates genes in an epigenetic manner based on their location in the chromosome. SW, swarmer cell; ST, stalked cell; PD, predivisional cell; EPD, early predivisional cell; LPD, late predivisional cell.
The Caulobacter cell cycle is programmed to yield cells of two shapes and fates: a motile swarmer cell and a stationary stalked cell. Swarmer cells swim in active search of nutrients and are incapable of division until they differentiate into stalked cells. During this process, they eject their flagellum, retract their pili, and grow a stalk at the same pole formerly occupied by the flagellum and pili. At the tip of the stalk is a holdfast, one of the strongest known biological adhesives (Tsang et al., 2006). Thus, stalked cells attach to a surface and will bud off new swarmer cells in the presence of nutrients. New-born swarmer cells are developmentally regulated to either immediately re-enter the cell cycle (forming a new stalked cell) or prolong the swarmer cell stage, and use chemotaxis to search for a more nutrient-rich environment (Ausmees & Jacobs-Wagner, 2003).
CtrA is abundant in swarmer cells, where it inhibits the initiation of DNA replication by directly binding to CtrA target sites within the origin of replication (Quon et al., 1998). Once a swarmer cell is exposed to sufficient nutrients, it differentiates into a stalked cell. As part of this transition, CtrA is degraded by the dynamically localizing protease ClpXP (Iniesta et al., 2006; Jenal & Fuchs, 1998; McGrath et al., 2006), while DnaA continues to accumulate (Collier et al., 2006, 2007). Without CtrA to block DnaA binding to the origin of replication, activated DnaA (Collier & Shapiro, 2009; Jonas et al., 2011) initiates DNA replication and activates the transcription of genes at the swarmer-to-stalked cell transition (Hottes et al., 2005). One of these genes encodes GcrA, which activates or represses different genetic modules in stalked cells (Collier et al., 2006; Hottes et al., 2005). GcrA in turn inhibits the production of DnaA (Holtzendorff et al., 2004). GcrA notably activates genes involved in DNA replication elongation and chromosome segregation and contributes to the expression of CtrA by activating the first promoter of ctrA, P1, which is regulated by N6-adenosine methylation (Reisenauer & Shapiro, 2002). When ctrA P1 becomes hemimethylated during DNA replication (Domian et al., 1999; Stephens et al., 1996), GcrA can activate its transcription (Holtzendorff et al., 2004). The newly synthesized strand is unmethylated because the CcrM methyltransferase is only active at the end of the cell cycle. After CtrA accumulates, it represses its own transcription from P1 and activates transcription from P2 (Domian et al., 1999). P1 is activated in early predivisional cells, whereas P2 is activated in late predivisional cells. As CtrA accumulates to high levels in late predivisional cells, it activates transcription of the gene encoding the CcrM DNA methyltransferase, which methylates adenines in GANTC target sequences in the newly replicated DNA strand, thus making the chromosome fully methylated (Stephens et al., 1996). This genetic circuit resets the cell cycle by promoting the expression of dnaA, which requires a fully methylated promoter for transcriptional activation (Collier et al., 2007).
A recent review (McAdams & Shapiro, 2011) describes a fifth (Christen et al., 2011; Tan et al., 2010) regulator, SciP, a CtrA antagonist that inhibits the transcription of at least 58 CtrA-activated genes (Gora et al., 2010; Tan et al., 2010) in swarmer cells, limiting their expression to the predivisional stage of the cell cycle. SciP integrates with the oscillating core cell cycle regulators via CtrA and CcrM (Gora et al., 2010; Tan et al., 2010). SciP is a small protein that is co-conserved with CtrA and physically interacts with CtrA. CtrA activates the transcription of sciP, whose gene product acts as a rheostat to prevent the overaccumulation of CtrA. As SciP accumulates, it represses ctrA transcription, as well as the transcription of a subset of CtrA-activated genes, including ccrM and those involved in flagellum and pili biogenesis (Gora et al., 2010; Tan et al., 2010), thus limiting their transcription to predivisional cells. Although it is clear that SciP represses ctrA transcription, the specific effect of SciP on the transcription of the ctrA P1 and P2 promoters has yet to be reported.
When ctrA was moved from its normal chromosomal location (near the origin) to a position near the terminus (to prolong the time that P1 spends in the fully methylated state), 42 % of swarmer cells were elongated and there was a 20 min delay in the reappearance of CtrA during the latter half of the cell cycle (Reisenauer & Shapiro, 2002). The physiological consequences arising from dysregulation of P1 were confounded by the discovery of a third promoter, P2FM (fully methylated), which is only active when ctrA is near the terminus (Reisenauer & Shapiro, 2002). Thus, the contribution of ctrA P1 to cell cycle progression was unclear.
Based on current models of the Caulobacter cell cycle (Laub et al., 2007; Shen et al., 2008), we hypothesized that the ctrA epigenetic P1 promoter would be critical to jump-start the synthesis of CtrA in early predivisional cells, which is important for retaining the temporal and spatial control of cell cycle events regulated by CtrA (Domian et al., 1997; Quon et al., 1996, 1998). To explore the role of P1 in cell cycle progression, we inactivated the P1 promoter at the native ctrA locus by inserting the same 5 bp spacer between the −35 and −10 sites of the P1 promoter that had previously been shown to prevent transcription from P1, but not P2, on a plasmid-based transcriptional reporter (Domian et al., 1999). Here, we characterize the effect of this mutation at the native ctrA locus. We show that the loss of ctrA P1 activity results in striking growth defects and a mis-coordination of cell cycle events that arise from the altered accumulation of CtrA during the cell cycle.
Methods
Bacterial strains, plasmids, media, and synchronization.
Strains and plasmids are described in Table 1. Caulobacter cultures were grown in either peptone yeast extract (PYE) or minimal (M2G) medium (Ely, 1991), supplemented with 0.3 % (w/v) xylose (called PYEX or M2GX), tetracycline (1 µg ml−1) or kanamycin (5 µg ml−1) in a 28 °C incubator on a shaking platform rotating at 125 r.p.m. Ludox AS-40 colloidal silica (Sigma-Aldrich) density gradients were used to isolate swarmer cells from exponentially growing cultures grown in M2G broth (Evinger & Agabian, 1977). Swarmer cells were then used to inoculate M2G broth cultures.
Table 1. Bacterial strains.
| Strain | Genotype and phenotype | Source or reference |
| C. crescentus strains | ||
| NA1000 (CB15N) | Wild-type | Gift from Lucy Shapiro |
| CMS33 | pBGS18T in CC3039/CC3040 intergenic region (kanR) | West et al. (2002) |
| JC130 | PdnaA-lacZ/pRKlacZ290 (transcriptional reporter) (tetR) | Collier et al. (2007) |
| LS178 | Δbla6 rsaA2 PccrM-lacZ/pGZ4 integrant (transcriptional reporter) (kanR) | Zweiger et al. (1994) |
| LS2222 | ctrA : : pXPC15 ( = PxylX : : ctrA) (gentR) | Quon et al. (1996) |
| LS4185 | rcdA : : Ωhyg | McGrath et al. (2006) |
| MHT68 | PxylX : : sciP/pMT464 (high copy vector) | Tan et al. (2010) |
| SM904 | PxylX : : ctrA ctrAP1 (gentR) | Sucrose selection of ctrA P1/pNPTS138 |
| SM921 | ctrA P1 | This study, see Methods |
| SM948 | PxylX : : ctrA ctrA P1 pBGS18T in CC3039/CC3040 intergenic region (gentR kanR) | PhiCr30(CMS33)→SM904 |
| SM1093 | PccrM-lacZ/pGZ4 integrant (transcriptional reporter) (kanR) | PhiCr30(LS178)→NA1000 |
| SM1095 | ctrA P1 PccrM-lacZ/pGZ4 integrant (transcriptional reporter) (kanR) | PhiCr30(LS178)→SM921 |
| SM1099 | PdnaA-lacZ/pRKlacZ290 (transcriptional reporter) (tetR) | This study, conjugation of PdnaA-lacZ/pRKlacZ290 into NA1000 |
| SM1101 | ctrA P1 PdnaA-lacZ/pRKlacZ290 (transcriptional reporter) (tetR) | This study, conjugation of PdnaA-lacZ/pRKlacZ290 into SM921 |
| SM1228 | PctrA P2-lacZ/pRKlacZ290 (transcriptional reporter) (tetR) | This study, conjugation of PctrA P2-lacZ/pRKlacZ290 into NA1000 |
| SM1230 | PgcrA (−78+92)-lacZ/pRKlacZ290 (transcriptional reporter) (tetR) | This study, conjugation of PgcrA-lacZ/pRKlacZ290 into NA1000 |
| SM1235 | ctrA P1 PctrA P2-lacZ/pRKlacZ290 (transcriptional reporter) (tetR) | This study, conjugation of PctrA P2-lacZ/pRKlacZ290 into SM921 |
| SM1237 | ctrA P1 PgcrA(−78..+92)-lacZ/pRKlacZ290 (tetR) | This study, conjugation of PgcrA-lacZ/pRKlacZ290 into SM921 |
| SM1268 | pMT464 (high copy vector) (kanR) | Gift from Martin Thanbichler* |
| SM1324 | PctrA290 ( = ctrA P1+P2-lacZ/pRKlacZ290 (tetR) | This study, conjugation of PctrA-lacZ/pRKlacZ290 into NA1000 |
| SM1345 | pMT464 PctrA P2-lacZ/pRKlacZ290 (transcriptional reporter) (kanR tetR) | This study, conjugation of PctrA P2-lacZ/pRKlacZ290 into SM1268 |
| SM1347 | Pxyl : : sciP/pMT464 PctrA P2-lacZ/pRKlacZ290 (transcriptional reporter) (kanR tetR) | This study, conjugation of PctrA P2-lacZ/pRKlacZ290 into MHT68 |
| SM1402 | PctrA P1wt P2wt-lacZ/pJC326C (translational reporter) (tetR) | This study, electroporation of PctrA P1wt P2wt-lacZ/pJC326C into NA1000 |
| SM1403 | PctrA P1mut P2wt-lacZ/pJC326C (translational reporter) (tetR) | This study, electroporation of PctrA P1mut P2wt-lacZ/pJC326C into NA1000 |
| SM1404 | PctrA P1wt P2mut-lacZ/pJC326C (translational reporter) (tetR) | This study, electroporation of PctrA P1wt P2mut-lacZ/pJC326C into NA1000 |
| SM1405 | PctrA P1-lacZ/pRKlacZ290 (transcriptional reporter) (tetR) | This study, conjugation of PctrA P1-lacZ/pRKlacZ290 into NA1000 |
| SM1407 | ctrA P1 PctrA P1mut P2wt-lacZ/pJC326C (translational reporter) (tetR) | This study, electroporation of PctrA P1mut P2wt-lacZ/pJC326C into SM921 |
| E. coli strains | ||
| TOP10 | F− mcrA Δ(mrr-hsdRMS-mcrBC) ϕ80lacZΔM15 ΔlacX74 nupG recA1 araD139 Δ(ara-leu)7697 galE15 galK16 rpsL(StrR) endA1 λ− | Invitrogen |
| DH10B | F− mcrA Δ(mrr-hsdRMS-mcrBC) ϕ80lacZΔM15 ΔlacX74 recA1 endA1 araD139 Δ(ara leu) 7697 galU galK rpsL nupG λ– | Invitrogen |
| S17-1 | F−, lambda(−), thi, pro, recA, restriction (−), modification (+), RP4 derivative integrated into the chromosome with Tet : : Mu, Km : : Tn7 | Simon et al. (1983) |
| LS1914 | DH10B pNPTS138 (kanR) | C. Mohr, R. Roberts and L. Shapiro |
| LS2882 | S17-1 PctrA P1wt P2mut(referred to as ctrA P1-lacZ/pRKlacZ290) (tetR) | Domian et al. (1999) |
| LS3146 | S17-1 PctrA P1wt P2mut (referred to as ctrA P1) lacZ/pRKlacZ290 (tetR) | Domian et al. (1999) |
| LS3147 | S17-1 PctrA P1mut P2wt (referred to as ctrA P2) lacZ/pRKlacZ290 (tetR) | Domian et al. (1999) |
| LS4322 | DH10B pJC326C (translational reporter vector) (tetR) | Chen et al. (2006) |
| LS4225 | S17-1 PgcrA (−78..+92)-lacZ/pRKlacZ290 (tetR) | Collier et al. (2006) |
| SM1087 | S17-1 PdnaA-lacZ/pRKlacz290 (tetR) | This study, electroporation of PdnaA-lacZ/pRKlacZ290 into S17-1 |
| SM1382 | ctrA P1 mutation/pNPTS138 (kanR) | This study |
| SM1399 | TOP10 PctrA P1wt P2wt-lacZ/pJC326C (translational reporter) (tetR) | This study |
| SM1400 | TOP10 PctrA P1mut P2wt-lacZ/pJC326C (translational reporter) (tetR) | This study |
| SM1401 | TOP10 PctrA P1wt P2mut-lacZ/pJC326C (translational reporter) (tetR) | This study |
MPI für terrestrische Mikrobiologie, Marburg, Germany.
Mutational inactivation of the ctrA P1 promoter using PCR cloning.
The following primers were used to create a loss-of-function mutation (5 bp insertion, underlined) in the ctrA P1 promoter by sequential PCR. The upstream (US) and downstream (DS) primer sets were used to respectively amplify the US and DS sequences. Then a third PCR using the US and DS PCR products as template and the CtrAΔp1USFwd and CtrAΔp1DSRev primers produced a PCR product which was digested and ligated into the sacB-containing suicide vector pNPTS138. The primer sequences were as follows: CtrAΔp1USFwd, 5′-AAAAAAGCTTAACACGGCTCGCGCCTGGAGATGGGGCCGTT-3′; CtrAΔp1USRev, 5′-CGTCGGAGGAATGGTTAATCTGATGAAGCTTGCGAATCGGGTGCAAGCCGCGT-3′; CtrAΔp1DSFwd, 5′-ACGCGGCTTGCACCCGATTCGCAAGCTTCATCAGATTAACCATTCCTCCGACG-3′; CtrAΔp1DSRev, 5′-AAAACTTAAGTTGATGACCGACTGGGCGTGACCCTTCGAA-3′. The resulting PCR fragment was cloned into pNPTS138, electroporated into NA1000, and resolved using sucrose selection (Lesley & Shapiro, 2008). DNA sequencing of PCR products using the following primers identified colonies carrying the P1 mutation: CtrA-FL-Fwd, 5′-TGGCGTCATCGGCAGTCAACTT-3′; CtrA-FL-Rev, 5′-CTTAACGCTGTAACGCCGTTCG-3′.
Construction of CtrA–LacZ protein fusion vectors.
The following primers were used to create wild-type ctrA, ctrA P1 only and ctrA P2 only translational reporters in pJC326C (Chen et al., 2006). The forward primer amplifies the same nucleotides that are found in the 5′ end of the ctrA transcriptional reporters created earlier (Domian et al., 1999). To amplify the wild-type and ctrA P1 mutant promoters, the following primers were used: ctrA-TNL-US-Fwd, 5′-AAAAAGATCTAGGCCTCGATTTTCTCGATTTCTT-3′; ctrA-TNL-DS-Rev, 5′-AAAACTGCAGATCCTCGATCAACAGTACGCGCAT-3′. The following primers were used to create a loss-of-function mutation (Domian et al., 1999) (specific mutated nucleotides underlined) in the ctrA P2 promoter by sequential PCR. The upstream (US) and downstream (DS) primer sets were used to respectively amplify the US and DS sequences (relative to the mutation). Then a third PCR using the US and DS PCR products as template and the ctrA-TNL-US-Fwd and ctrA-TNL-DS-Rev primers (described above) produced a PCR product, which was digested and ligated into pJC326C. The primer pairs were as follows: US PCR, ctrA-TNL-US-Fwd (see above) and ctrA-TNL-US-P2mut-Rev (5′- TCCGCCGGTGAAACCCTTCGGCCACCCGGCCGGAGAGTTAATTTAAGACT-3′); DS PCR, ctrA-TNL-DS-P2mut-Fwd (5′-AGTCTTAAATTAACTCTCCGGCCGGGTGGCCGAAGGGTTTCACCGGCGGA-3′) and ctrA-TNL-DS-Rev (see above).
Growth curves.
Single colonies from a streak plate were inoculated into 3 ml PYE or PYEX broth and were incubated overnight in a 28 °C incubator with 125 r.p.m. of rotational movement. OD660 was measured (path length = 1.5 cm) with an Amersham Novaspec III spectrophotometer. Cultures were diluted to OD660 0.300 and allowed to double before starting the growth curve at OD660 0.100. OD660 was measured and dilutions were plated on PYE agar to determine c.f.u. ml−1 at regular time intervals. For growth curves in M2G, colonies were first inoculated into 3 ml PYE or PYEX broth and then subcultured into M2G broth. The PxylX : : ctrA ctrA P1 (SM904) depletion strain was grown in PYEX, then M2GX, as described above, and washed three times in M2G broth before being split into M2GX and M2G media. Cultures were incubated as described above.
Microscopy.
Strains were grown as described above for growth curves. Cells were fixed for microscopy using a solution of 30 mM sodium phosphate buffer (pH 7.5) and 2.5 % formaldehyde, and viewed on 1 % agarose slides. Cell morphology was observed with a Zeiss AxioVision microscope with a Hamamatsu ORCA-ER digital camera using differential interference contrast settings. Fixed cells were incubated in the dark for 10 min with 2 µg DAPI ml−1 to detect DNA and were aliquoted onto a 1 % agarose pad.
Fluorescence activated cell sorting (FACS).
Samples for flow-cytometry were isolated from exponentially growing cells treated with rifampicin for 3 h as described by Winzeler & Shapiro (1995), except that DyeCycle Orange (Invitrogen) was used to stain the DNA as in a recent publication (Lesley & Shapiro, 2008). Data were collected using a FACStar Plus machine (Becton Dickinson) and analysed using FlowJo software (Tree Star). FACS results were obtained from triplicate or quadruplicate independent cultures.
5′ Rapid amplification of cDNA ends (RACE) mapping.
RNA was isolated (Argueta et al., 2006) from exponentially growing NA1000 and SM921 in M2G broth. 5′ RACE was performed as described by Argueta et al. (2006). The following ctrA-specific primers were used: 5′ RACE CtrA Rev, 5′-CCGCAGGGTGCGCAGAACATCGAT-3′; 5′ RACE CtrA Nested Rev, 5′-GCAGGATAAGATCGTAGTCGTAGAT-3′. The 5′ RACE CtrA nested Rev primer was used to sequence the 5′ RACE PCR products.
Measurement of transcription.
The β-galactosidase activities (Miller units) of promoter–lacZ fusions were measured in exponentially growing cultures in M2G supplemented with the appropriate antibiotic (Miller, 1972). OD660 was measured and LacZ activity was recorded at 420 nm (path length = 1 cm) using a Beckman Coulter DU 640 UV–visible spectrophotometer. dnaA, gcrA or ctrA transcription was measured from lacZ reporters on plasmid pRKlacZ290, whereas ccrM transcription was measured from a chromosomal lacZ reporter at the native locus (Table 1). Relative promoter activity was calculated by considering the mean Miller units for the wild-type for each transcriptional fusion as 100 % activity. Experiments were performed in triplicate or quadruplicate. Paired or unpaired Student’s t tests were used to determine whether changes in transcription were significant. P values <0.05 were considered to be significant.
Immunoblotting.
Immunoblot samples were taken from exponentially growing cells and were normalized based on optical density. To shut off PxylX expression of ctrA in SM904 (PxylX : : ctrA ctrA P1), exponentially growing cells in M2GX were washed three times in M2G and then grown for 31 h before immunoblot samples were taken from exponentially growing cells. DnaA protein was resolved on 8 % SDS-PAGE, CcrM was resolved with 12 % SDS-PAGE, and GcrA/CtrA/SciP were resolved using 15 % SDS-PAGE (Sambrook et al., 1989). Proteins were transferred to PVDF membranes (Millipore). Polyclonal antibodies (gifts from Lucy Shapiro, Stanford School of Medicine) reacting with DnaA, GcrA, CtrA, CcrM and SciP were detected with donkey anti-rabbit conjugated to horseradish peroxidase (Jackson ImmunoResearch). Serum for anti-DnaA was diluted 1 : 20 000; anti-GcrA was diluted 1 : 4000; anti-CtrA was diluted 1 : 20 000; anti-CcrM was diluted 1 : 5000; and anti-SciP was diluted 1 : 4000. A chemiluminescent reagent (PerkinElmer) and HyBlot CL autoradiography films (Denville Scientific) were used to view the blots. Films were scanned and image contrast and brightness were optimized with Photoshop (Adobe), and relative band intensities were determined using ImageJ (NIH, Bethesda, MD) (Barboriak et al., 2005).
Translation index.
Translational index experiments were performed as previously described (Anderson & Gober, 2000). Briefly, β-galactosidase activity from exponentially growing Caulobacter strains in M2G-tetracycline broth was measured as described above. The total Miller units from protein fusions were divided by the total Miller units produced from the promoter fusions to calculate the translation index. The protein fusions connect the first eight codons of CtrA to LacZ (and contain the native ctrA Shine–Dalgarno sequence), whereas the promoter fusions do not include the ctrA Shine–Dalgarno or any CtrA codons.
CtrA half-life.
CtrA stability was measured using pulse–chase experiments. Exponentially growing cells were labelled for 10 min with 10 µCi ml−1 (370 kBq) [35S]methionine (PerkinElmer) and then chased with 1 mM unlabelled methionine and 0.2 mg Casamino acids ml−1. One millilitre of culture was centrifuged for 2 min in a microfuge at 8000 r.p.m. every 10 min and frozen on dry ice. Labelled CtrA protein was immunoprecipitated as described by McGrath et al. (2006) and resolved on a 15 % SDS-PAGE gel. HyBlot CL autoradiography films (Denville Scientific) were used. Films were scanned and band intensities were measured using Image J (NIH, Bethesda, MD) (Barboriak et al., 2005).
Protein stability analysis by immunoblotting.
Protein stability was estimated using exponentially growing cells treated with 2 µg chloramphenicol ml−1. Whole cell samples were taken every 30 min for 210 min and analysed by immunoblotting. Immunoblots were scanned and analysed with ImageJ (NIH, Bethesda, MD) to detect changes in protein accumulation over time.
Real-time quantitative PCR (QPCR) analysis.
RNA was isolated from 1.5 ml of exponentially growing Caulobacter cultures using TRIzol (Life Technologies), following the manufacturer’s recommended protocols. We used Superscript II Reverse Transcriptase (Life Technologies) to generate cDNAs. QPCR was performed as previously described (Cuajungco et al., 2012) with minor modifications to suit our experiments. The amplification reactions were done in a Bio-Rad CFX96 machine using SensiMix SYBR Green Master Mix (Bioline) with the following thermocycling conditions: 5 min 95 °C followed by 40 cycles (30 s at 95 °C, 45 s at 55 °C, 30 s at 72 °C). The primer sets for ctrA and CC2677 (normalization control) genes were obtained from a recent publication (Tan et al., 2010): ctrA Fwd, 5′-CCGACGACTACATGACCAAG-3′; ctrA Rev, 5′-AGCATCTGGTACTCCTTGCC-3′; CC2677 Fwd, 5′-TCTACTATCGCGGCTATCCC-3′; CC2677 Rev, 5′-GTACATGCGCGAGGTGTC-3′. The QPCR efficiency (E) and correlation coefficient (R2) were: E = 94±2 %, R2 = 0.99 for ctrA (n = 2); and E = 99±7 %, R2 = 0.99 for CC2677 (n = 2).
Results
The ctrA P1 mutant has severe growth and morphological defects
Five basepairs were inserted between the −35 and −10 sites of the ctrA P1 promoter to prevent transcription from P1, but not P2 (Domian et al., 1999). This construct (in plasmid pNPTS138) was integrated into both wild-type and PxylX : : ctrA C. crescentus. Screening of recombinants from sacB selections revealed that 5 % (2/40) of wild-type colonies contained the mutation in P1 compared with 50 % (10/20) of the PxylX : : ctrA strain grown in the presence of xylose. The low percentage of mutants obtained in the wild-type was far from that expected for non-lethal mutations (50 %) because P1 mutants have a significantly slower doubling time (described below) than wild-type. We also linked a kanamycin marker to the P1 mutation (creating strain SM948) and were able to cotransduce the P1 mutation into wild-type NA1000.
The ctrA P1 mutant and wild-type strains were grown in both rich (PYE) and minimal (M2G) media to observe their growth characteristics. As shown in Fig. 2(a), growth of the ctrA P1 mutant in PYE was severely impaired in both biomass accumulation (measured by optical density) and doubling time (calculated from c.f.u. ml−1) compared with wild-type. In PYE, the wild-type strain had a doubling time of 97±19 min and the ctrA P1 mutant had a doubling time of 135±7 min (1.4× longer). In contrast (Fig. 2b), in M2G, although no significant difference in biomass accumulation was observed, the doubling time of the wild-type was 113±10 min and that of ctrA P1 was 141±15 min (1.2× longer).
Fig. 2.
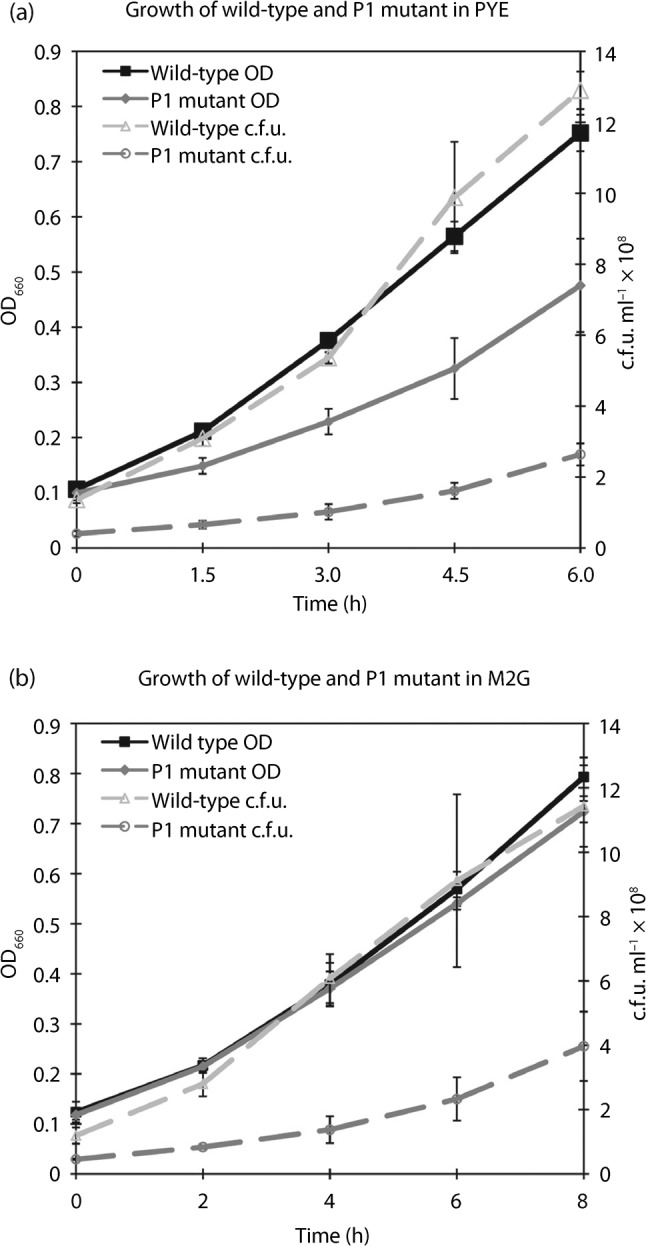
Growth curves of the wild-type and ctrA P1 mutant in rich and minimal media. Exponentially growing NA1000 (wild-type) and SM921 (ctrA P1) were grown in PYE or M2G broth. Optical density (OD) was used to measure biomass and dilutions were plated onto PYE agar to determine c.f.u. ml−1. NA1000 OD is shown with filled squares/solid lines; SM921 OD is shown with filled mid-grey diamonds/solid lines; NA1000 c.f.u. ml−1 is shown with open light-grey triangles/dashed lines; SM921 c.f.u. ml−1 is shown with open mid-grey circles/dashed lines. Means of triplicate experiments are shown with y-error bars. (a) The ctrA P1 mutant has significant biomass and c.f.u. growth defects in rich media broth. (b) The ctrA P1 mutant has significant c.f.u., but not biomass, growth defects in minimal media broth.
Microscopic observation revealed that the ctrA P1 mutant was elongated in PYE broth (Fig. 3a), with a mean length of 3.81±1.88 µm (n = 176; sd is high due to the presence of filamentous cells) and width of 0.76±0.09 µm (n = 126) compared with the mean length of 2.67±0.53 µm (n = 100) and width of 0.78±0.08 µm (n = 99) for wild-type. In contrast, in M2G, the ctrA P1 mutant cell length was 4.39±2.89 µm (n = 1567; sd is high due to the presence of filamentous cells) compared with 2.25±0.62 µm (n = 1949) in wild-type in M2G broth. Cell width remained unchanged at 0.66±0.11 µm (n = 200) for ctrA P1 and 0.67±0.06 µm (n = 200) for wild-type. Additionally 1.4 % (n = 2167) of ctrA P1 cells have ectopic poles compared with 0 % (n = 2083) in wild-type. Ectopic pole formation presumably arises from defects in polar morphogenesis (Lam et al., 2006) via CtrA-regulated proteins.
Fig. 3.
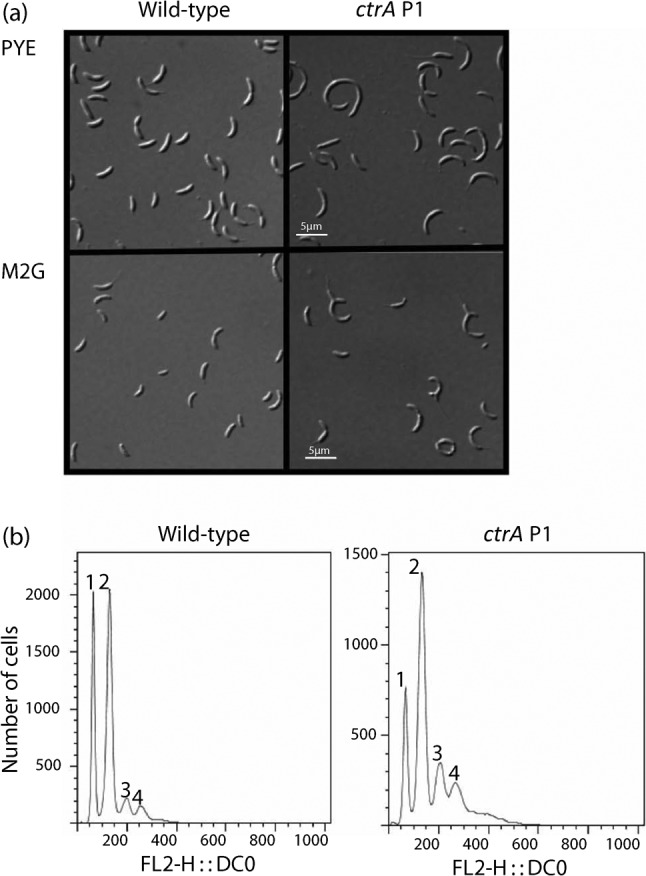
(a) The ctrA P1 mutant is elongated and a subpopulation contains ectopic poles in both PYE and M2G broth; bars, 5 µm. (b) The ctrA P1 mutant cannot effectively silence the initiation of DNA replication. The number of cells containing one, two, three or four chromosomes in rifampicin-treated unsynchronized cultures is shown for the wild-type (NA1000) and ctrA P1 (SM921) strains. FL2-H : : DCO indicates peak emission values for DyeCycle Orange. Graphs are representative of FACS analysis from triplicate or quadruplicate cultures.
Additionally, the growth and morphological defects described here were recapitulated in the PxylX : : ctrA ctrA P1 strain grown in the absence of xylose (which leads to the repression of PxylX) (Meisenzahl et al., 1997). In sum, these results show that transcription from the P1 promoter of ctrA is required for efficient progression through the cell division cycle in both rich and minimal media. To avoid selection for suppressor mutations, all subsequent experiments were performed in M2G media, where no significant difference was observed in biomass accumulation between the P1 mutant and wild-type (Fig. 2b).
The ctrA P1 mutant accumulates multiple chromosomes
Since the ctrA P1 mutant cells had growth defects and morphological abnormalities, we hypothesized that the mutant could have defective repression of DNA replication. To test this hypothesis, FACS analysis of rifampicin-treated mutant and wild-type cells in M2G was performed. The results confirmed our hypothesis, showing that a higher fraction of ctrA P1 mutant cells accumulated three to four chromosomes than the wild-type (Fig. 3b). We predicted that the overinitiation of DNA replication could result from reduced levels of CtrA in the P1 mutant.
5′ RACE confirms that only the P2 promoter is functional in the ctrA P1 mutant
To verify that the altered spacing between the −35 and −10 sites of the native ctrA P1 promoter prevents transcription from P1 but not P2 on the chromosome, we performed 5′ RACE. As shown in Fig. 4(a), wild-type 5′ RACE PCR products (confirmed with DNA sequencing) from exponentially growing cultures in M2G broth revealed bands representing P1 and P2 transcripts. In contrast to the wild-type, gels of ctrA P1 mutant 5′ RACE PCR products revealed only one strong band (representing P2 transcripts). Furthermore, 5′ RACE produced no evidence for transcription from the P2FM promoter, which was found to be transcribed only when the ctrA promoter was moved away from its native locus to a new location near the chromosomal terminus (Reisenauer & Shapiro, 2002). Thus, 5′ RACE confirmed that the 5 bp insertion prevents transcription from ctrA P1 but not P2. Interestingly, although the 5′ RACE PCRs were normalized for the quantity of mRNA and PCR reagents, we observed an increase (119 % of wild-type) in P2 PCR product abundance in the P1 mutant compared with wild-type, suggesting increased levels of P2 mRNA (as primers were added in excess, the amount of product may have been related to the quantity of cDNA template).
Fig. 4.

(a) 5′ RACE reveals that the ctrA P1 mutant produces P2 but not P1 transcripts. The ctrA P1 PCR product is 290 nt, whereas the ctrA P2 PCR product is 233 nt. (b) Transcription of cell cycle master regulators in the wild-type and ctrA P1 mutant. Results of lacZ transcriptional reporters for ctrA, dnaA, gcrA, ctrA P2 and ccrM in the wild-type (WT) and ctrA P1 mutant are shown. For each promoter, transcription levels in the ctrA P1 mutant relative to wild-type (normalized to 100 %) are shown. Means of triplicate or quadruplicate experiments are shown with y-error bars.
Net ctrA transcription decreases by 50 % in the P1 mutant despite increased ctrA P2 transcription
lacZ promoter reporters were used to measure net ctrA transcription in the P1 mutant and wild-type. All transcriptional reporter data were tested for significance with paired Student’s t tests (two-tailed). Fig. 4(b) shows that total ctrA transcription was reduced by 50 % (P = 0.001) in the P1 mutant. These results were confirmed by two independent QPCR experiments, indicating that net ctrA transcription was reduced to 52 % of wild-type levels. lacZ promoter reporters were subsequently used to test whether there were any transcriptional changes for the core cell cycle master regulators in M2G. As shown in Fig. 4(b), a significant increase in ctrA P2 transcription (121 % of wild-type; P = 0.018) confirmed the results suggested by 5′ RACE, and a significant decrease in ccrM transcription (78 % of wild-type; P = 0.020) was observed in the P1 mutant. Reduced ccrM transcription is expected to correlate with reduced CtrA accumulation because CtrA activates the transcription of ccrM. Although gcrA transcription increased to 115 % of wild-type in the P1 mutant, this difference was not found to be significant (P = 0.147). Additionally, no significant changes in dnaA transcription were observed (108 % of wild-type; P = 0.137). Significantly, the increase in ctrA P2 transcription only partially compensated for the loss of transcription from ctrA P1, since the P1 mutant had lower net ctrA transcription and growth defects.
The CtrA and SciP master regulators have reduced accumulation in the ctrA P1 mutant, but the CcrM, DnaA and GcrA master regulators accumulate to wild-type levels in minimal media
To test if the transcriptional changes noted in Fig. 4(b) affected protein accumulation, whole-cell protein lysates were normalized based on cell density and probed by immunoblotting for the DnaA, GcrA, CtrA, CcrM and SciP master regulators (Fig. 5a). The blots shown are from one representative culture from each strain. Relative accumulation was determined by averaging the results from six independent cultures for ctrA P1 (three of SM921 and three of SM904) and three independent cultures of the wild-type (NA1000). As expected, CtrA levels were significantly reduced, reaching only 22±7 % of wild-type levels in both the ctrA P1 and PxylX : : ctrA ctrA P1 mutants in M2G (the xylX promoter is not transcribed in M2G; Meisenzahl et al., 1997). Interestingly, SciP levels decreased to 19±9 % of wild-type in the ctrA P1 mutants, which is very similar to the reduction in CtrA accumulation. The accumulation of DnaA, GcrA and CcrM was similar in the wild-type and ctrA P1 mutants, despite the drastic reduction in CtrA and SciP in the P1 mutants.
Fig. 5.
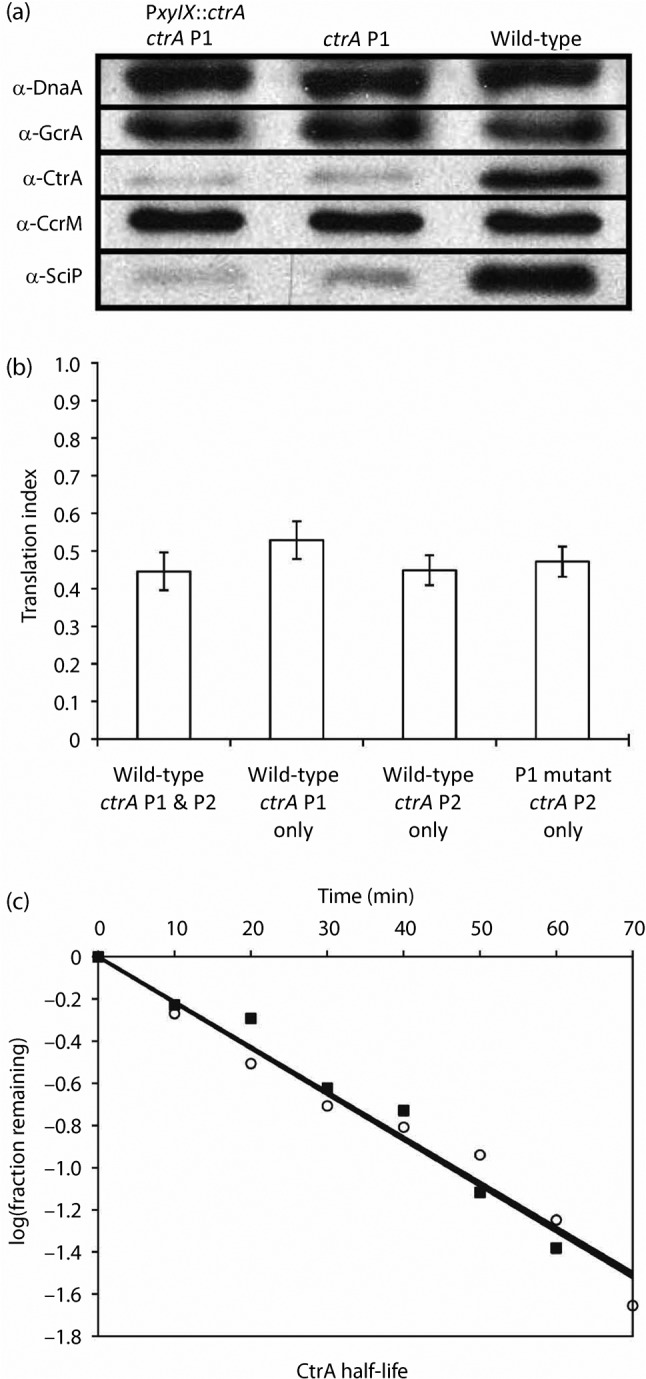
(a) Accumulation of the cell cycle master regulators reveals a similar and significant reduction in CtrA and SciP but not DnaA, GcrA or CcrM accumulation. Immunoblots of cell lysates from exponentially growing wild-type (NA1000), ctrA P1 (SM921) and PxylX : : ctrA ctrA P1 (SM904) mutants grown in M2G were normalized based on biomass (optical density) and probed with antibodies against DnaA, GcrA, CtrA, CcrM or SciP. Representative immunoblots (from one culture for each strain) of triplicate independent cultures are shown. (b) ctrA P1 mutants have no defect in ctrA translation initiation. The translation index reflects the average Miller units produced by translational reporters divided by the Miller units produced by transcriptional reporters in unsynchronized, exponentially growing cells. y-Error bars, sds from quadruplicate trials. (c) CtrA half-life is similar to wild-type in the ctrA P1 mutant. CtrA has a half-life of 47 min in the wild-type (▪; R2 = 0.97) and 46 min in the ctrA P1 mutant (○; R2 = 0.97). Means of results from triplicate experiments are shown.
ctrA translational initiation and CtrA half-life are unaffected in the ctrA P1 mutant
In an attempt to address the discrepancy between net ctrA transcription (50 % of wild-type) and CtrA abundance (22 % of wild-type) in the P1 mutant, we determined the translation index (Anderson & Gober, 2000) for ctrA. As shown in Fig. 5(b), no significant changes were noted between ctrA translation initiation in wild-type and ctrA P1 mutant cells. Both strains had a translation index of ~0.46. Finding no change in translation initiation, we measured CtrA half-life. As shown in Fig. 5(c), CtrA stability was unaltered in the ctrA P1 mutant, with a half-life of ~46.5 min in both strains. Thus, neither translation initiation nor protein stability explains the discrepancy between ctrA transcription and CtrA accumulation in the P1 mutant, suggesting that differences exist at another level of regulation.
DnaA, GcrA and CcrM stability appear to be unaltered in the ctrA P1 mutant
CcrM protein levels were similar in wild-type and ctrA P1 mutant cultures (Fig. 5a), despite a reduction in ccrM transcription (78 % of wild-type in Fig. 4b). We thus hypothesized that CcrM could be more stable in the P1 mutant compared with wild-type. To test this hypothesis and to see if there were any changes in the stability of DnaA or GcrA, we treated exponentially growing Caulobacter cells grown in M2G with 2 µg chloramphenicol ml−1, which prevents de novo protein synthesis, and followed the accumulation of the four core Caulobacter master regulators over time by immunoblot analyses. We compared CtrA stability in a rcdA : : Ω mutant (LS4185; CtrA lacks cell cycle-regulated degradation in this mutant) and wild-type, and found that CtrA was significantly stabilized in the RcdA mutant using this approach (results not shown). However, no significant differences were found in triplicate experiments comparing the stability of DnaA, GcrA, CtrA and CcrM by immunoblot analyses (results not shown).
Reduced SciP accumulation in the ctrA P1 mutant likely contributes to increased ctrA P2 transcription
Based on recent studies that show that SciP inhibits the transcription of ctrA (Gora et al., 2010; Tan et al., 2010) and the 81 % decrease in SciP accumulation in our ctrA P1 mutants, we hypothesized that the increase in ctrA P2 transcription could be due to decreased levels of SciP. To test this, we measured ctrA P2 transcription for 6 h in a strain that overexpressed SciP and found that transcription was significantly reduced to 65±7 % (P = 0.023) of the levels found in an isogenic strain carrying an empty vector (Fig. 6a). The significant reduction in SciP accumulation in the P1 mutant likely contributes to increased ctrA P2 transcription. We were unable to create a SciP depletion strain under the control of either the xylose or vanillate promoter at the sciP locus and therefore were unable to measure ctrA P2 transcription when SciP was depleted.
Fig. 6.
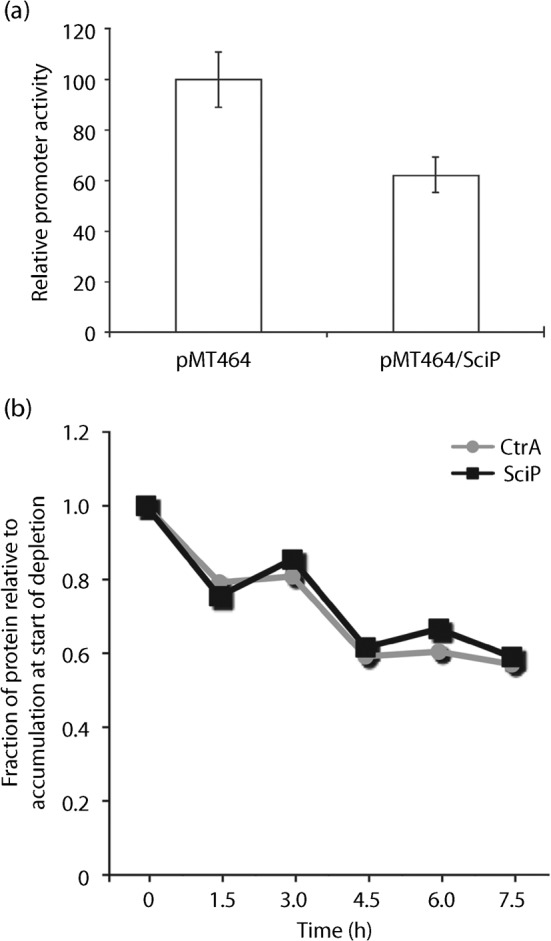
(a) SciP represses transcription of ctrA P2, suggesting that reduced accumulation of SciP in the ctrA P1 mutant may lead to increased ctrA P2 transcription. Xylose (0.3 %, w/v) was added to exponentially growing cultures of SM1345 (NA1000 pMT464 PctrAP2-lacZ/pRKlacZ290) and SM1347 (NA1000 PxylX : : sciP/pMT464 PctrAP2-lacZ/pRKlacZ290) in PYE broth supplemented with kanamycin and tetracycline. ctrA P2 transcription was measured with a β-galactosidase assay at 6 h after PxylX : : sciP overexpression with xylose. Means from quadruplicate independent cultures are shown with y-error bars. (b) SciP and CtrA accumulation decrease in synchrony as CtrA protein levels are reduced. SM904 (PxylX : : ctrA ctrA P1) was grown in M2G xylose, washed three times, and split into M2G and M2G xylose. Immunoblot samples normalized for optical density were taken from M2G broth every 1.5 h for 7.5 h. Relative levels of CtrA and SciP were quantified using ImageJ (NIH, Bethesda, MD). Relative CtrA abundance is represented by grey circles/lines and relative SciP abundance is indicated with black squares/lines. Data points represent the average of duplicate trials.
CtrA functions as a rheostat to control SciP levels
Since CtrA and SciP accumulation decreased by similar levels in the P1 mutant, we suspected that CtrA may act as a rheostat for SciP, just as SciP has been shown to be a rheostat for controlling CtrA accumulation (Tan et al., 2010). To test this hypothesis, we partially depleted CtrA in our PxylX : : ctrA ctrA P1 mutant (SM904) and monitored CtrA and SciP accumulation over time. We found that the relative abundance of CtrA and SciP decreased in synchrony (Fig. 6b). Thus, the levels of CtrA and SciP are tightly and coordinately regulated.
ctrA transcription peaks 0.125 cell unit later during the cell cycle in the ctrA P1 mutant
The experiments described above focused on the quantity of CtrA produced. To detect temporal changes in ctrA transcription during the cell cycle, ctrA mRNA levels were assessed relative to CC2677 mRNA, which is not cell cycle-regulated (Tan et al., 2010), using QPCR. Since the wild-type and P1 mutant have different doubling times that reflect their distinct rates for cell cycle progression, the cell cycles were normalized. Samples were taken every 20 min from wild-type but every 23 min from the ctrA P1 mutant in M2G broth (determined by synchronizing cultures and observing the optical density increase over time). This allows for the comparison of cell cycle units. As shown in Fig. 7(a), ctrA mRNA peaked at 0.500 cell cycle unit in wild-type (corresponding to 80 min). In contrast, ctrA mRNA peaked at 0.625 unit in the P1 mutant (corresponding to 115 min).
Fig. 7.
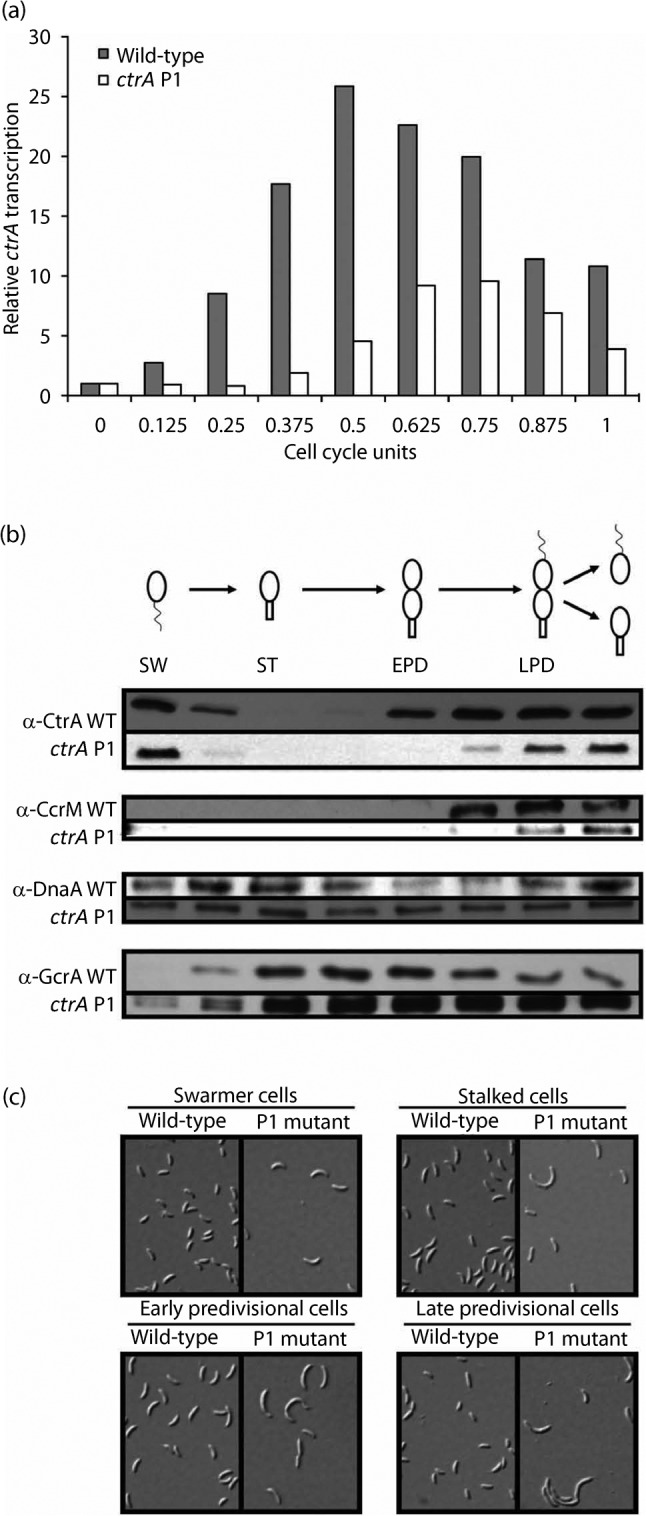
(a) Transcription of ctrA during the cell cycle: ctrA transcription peaks 0.125 cell unit later during the cell cycle in the ctrA P1 mutant. Wild-type (NA1000) and ctrA P1 (SM921) cultures were synchronized. RNA samples for QPCR were taken from the wild-type every 20 min and from the ctrA P1 mutant every 23 min. ctrA mRNA levels were normalized to the amount of ctrA mRNA present at 0 min (swarmer cells), representing one unit. Averages from independent duplicate experiments are shown. (b) CtrA and CcrM have a 0.125 cell cycle unit delay in their accumulation in predivisional cells. Immunoblot samples were probed with antisera for CtrA, CcrM, DnaA and GcrA as indicated. The blots shown are from one representative culture of each strain. WT, wild-type. (c) ctrA P1 mutant cells are ~1.3× elongated at all stages of the cell cycle. Synchronized cells were fixed at 0 (SW), 40 (ST), 80 (EPD) and 120 min (LPD) for wild-type (NA1000), and at 0 (SW), 46 (ST), 92 (EPD) and 138 min (LPD) for ctrA P1 (SM921). Differential interference contrast images are from one synchrony of wild-type and one of ctrA P1. They are representative of three independent experiments for each strain. Abbreviations used above: SW, swarmer, ST, stalked, EPD, early predivisional, LPD, late predivisional cells.
There is a 0.125 unit delay in the reappearance of both CtrA and CcrM in synchronized ctrA P1 cultures
To test whether the temporal accumulation of master regulators was altered, as expected for CtrA by the delay in ctrA transcription, ctrA P1 and wild-type cultures were synchronized in M2G broth. The blots shown are from one representative culture of each strain. Immunoblots for CtrA, CcrM, DnaA and GcrA are shown in Fig. 7(b) for synchronized cultures of wild-type and ctrA P1. All master regulators oscillate, but there is a 0.125 cell cycle unit delay in the reappearance of both CtrA and CcrM at the end of the cell cycle. A similar delay in the reappearance of CtrA was also observed when ctrA was moved from its normal location, near the origin, to a new location near the terminus that remains fully methylated during the cell cycle (Reisenauer & Shapiro, 2002). However, the only morphological change noted for the ctrA terminus mutant was elongated swarmer cells. In contrast, the defects in our P1 mutant at the native locus were more pronounced. Cells at all stages of the cell cycle, not just swarmer cells (as found when ctrA was moved near the terminus), were elongated ~1.3-fold (Fig. 7c). This suggests that CtrA accumulation and/or oscillation contribute to the coordination of molecular events that modulate cell size.
Discussion
This study illustrates the robustness of the Caulobacter cell cycle. Although CtrA levels decrease by 78 % and SciP levels decrease by 81 % in the ctrA P1 mutant, accumulation of CcrM, DnaA and GcrA is similar to wild-type. Decreased CtrA, but not DnaA, protein levels result in a population of P1 mutant cells accumulating three to four chromosomes per cell. When CtrA is depleted in a PxylX : : ctrA ctrA P1 mutant, SciP levels decrease in a synchronized manner with CtrA, suggesting that CtrA acts as a rheostat to control the accumulation of SciP. Two examples of robustness include high levels of ccrM transcription (78 % of wild-type) despite low CtrA accumulation (22 % of wild-type) and increased ctrA P2 transcription (121 % of wild-type) in the P1 mutant. Although Reisenauer et al. (1999) showed that CtrA has lower affinity for PccrM than PfliQ, our results suggest that CtrA may have a higher affinity for the ccrM promoter than for many other CtrA targets. The fact that low CtrA levels do not translate to low CcrM levels allows for Caulobacter to continue the cell cycle with high levels of most master regulators. If CcrM levels were reduced as much as CtrA, the other cell cycle regulators would likely follow suit, possibly resulting in more severe growth defects. Reisenauer et al. (1999) proposed that the lower affinity of CtrA for PccrM than PfliQ contributes to the 0.125 cell cycle unit delay in the transcription of ccrM after the reappearance of CtrA in early predivisional cells. In the ctrA P1 mutant, a similar delay in CcrM accumulation is observed, suggesting that delayed ccrM transcription results from temporally altered CtrA accumulation. In the second example of robustness, we showed that CtrA acts as a rheostat to control the levels of SciP. Presumably, increased transcription from ctrA P2 arises from reduced repression by SciP. Interestingly, SciP represses transcription from PccrM (Gora et al., 2010). Thus, reduced SciP-mediated repression of PccrM in the P1 mutant may contribute to the robustness of ccrM transcription.
There are five CtrA binding sites within the Caulobacter chromosomal origin of replication (Cori) (Bastedo & Marczynski, 2009; Spencer et al., 2009). It has been reported that CtrA binding to three of these sites represses DNA replication on plasmids but not on the chromosome (Bastedo & Marczynski, 2009). This suggests that there are additional, chromosome-specific factors that help CtrA to repress DNA replication because there is still a block in the initiation of replication at Cori even when CtrA cannot bind to Cori. Our FACS results (showing that decreased CtrA accumulation results in the overinitiation of chromosomal DNA replication) suggest that CtrA directly or indirectly controls these other factors that help CtrA to restrict DNA replication to once, and only once, per cell cycle.
The reduced levels of CtrA are not solely explained by a reduction in ctrA transcription. In an attempt to resolve the discrepancy between ctrA transcription (50 % of wild-type) and CtrA accumulation (22 % of wild-type), we tested for a defect in translation initiation and for increased proteolysis in the P1 mutant. However, no changes between translation initiation and proteolysis were observed. Therefore, we hypothesize that translation elongation may be affected; however, our translational constructs only contained the first eight codons of CtrA. It is possible that the missing ctrA codons in our constructs could provide a basis for regulation of translation/mRNA stability by factors such as small RNAs. If substantiated, this would provide yet another level of regulation for CtrA synthesis.
In sum, this study (a) identified two examples of regulation that contribute to the robustness of the cell cycle; (b) suggests that the proposed non-CtrA DNA replication repressors (Bastedo & Marczynski, 2009) may be CtrA regulated; and (c) hints at possible regulation of ctrA translation elongation or mRNA stability. The robustness of the cell cycle is quite impressive, and our data suggest an uncharacterized genetic circuitry that allows survival under stressful conditions. Caulobacter is clearly well prepared for the challenge, as its ability to adapt lies in the robustness and flexibility of its cell cycle genetic circuitry.
Acknowledgements
We thank Lucy Shapiro for generously providing anti-DnaA, anti-GcrA, anti-CtrA, anti-CcrM and anti-SciP antibodies, and for making arrangements for us to perform FACS analysis at Stanford University. We acknowledge California State University Northridge (CSUN) students Adorina and Arbella Moshava for technical assistance with synchronies and immunoblots, and Bao Nguyen for maintaining cultures and helping to create the ctrA translational fusion vectors. We thank Chris Murray for graphic design help, Anthony Daulo for creating Fig. 1, and David Bermudes, Justine Collier, Mike Summers and Patrick Viollier for critical reading of the manuscript. NIH grant GM084860 to S. R. M., NIH R15-NS070774 and NSF MCB 920127 grants to M. P. C., a California State University Program for Education and Research in Biotechnology (CSUPERB) grant to S. R. M., a CSUN Graduate Studies grant to S. R. M., and CSUN College of Science & Mathematics start-up funds to S. R. M. funded this study.
Abbreviations:
- QPCR
real-time quantitative PCR
- 5′ RACE
5′ rapid amplification of cDNA ends
References
- Anderson P. E., Gober J. W. (2000). FlbT, the post-transcriptional regulator of flagellin synthesis in Caulobacter crescentus, interacts with the 5′ untranslated region of flagellin mRNA. Mol Microbiol 38, 41–52. 10.1046/j.1365-2958.2000.02108.x [DOI] [PubMed] [Google Scholar]
- Argueta C., Yuksek K., Patel R., Summers M. L. (2006). Identification of Nostoc punctiforme akinete-expressed genes using differential display. Mol Microbiol 61, 748–757. 10.1111/j.1365-2958.2006.05263.x [DOI] [PubMed] [Google Scholar]
- Ausmees N., Jacobs-Wagner C. (2003). Spatial and temporal control of differentiation and cell cycle progression in Caulobacter crescentus. Annu Rev Microbiol 57, 225–247. 10.1146/annurev.micro.57.030502.091006 [DOI] [PubMed] [Google Scholar]
- Barboriak D. P., Padua A. O., York G. E., Macfall J. R. (2005). Creation of DICOM–aware applications using ImageJ. J Digit Imaging 18, 91–99. 10.1007/s10278-004-1879-4 [DOI] [PMC free article] [PubMed] [Google Scholar]
- Bastedo D. P., Marczynski G. T. (2009). CtrA response regulator binding to the Caulobacter chromosome replication origin is required during nutrient and antibiotic stress as well as during cell cycle progression. Mol Microbiol 72, 139–154. 10.1111/j.1365-2958.2009.06630.x [DOI] [PubMed] [Google Scholar]
- Chen J. C., Hottes A. K., McAdams H. H., McGrath P. T., Viollier P. H., Shapiro L. (2006). Cytokinesis signals truncation of the PodJ polarity factor by a cell cycle-regulated protease. EMBO J 25, 377–386. 10.1038/sj.emboj.7600935 [DOI] [PMC free article] [PubMed] [Google Scholar]
- Christen B., Abeliuk E., Collier J. M., Kalogeraki V. S., Passarelli B., Coller J. A., Fero M. J., McAdams H. H., Shapiro L. (2011). The essential genome of a bacterium. Mol Syst Biol 7, 528. 10.1038/msb.2011.58 [DOI] [PMC free article] [PubMed] [Google Scholar]
- Collier J., Shapiro L. (2009). Feedback control of DnaA-mediated replication initiation by replisome-associated HdaA protein in Caulobacter. J Bacteriol 191, 5706–5716. 10.1128/JB.00525-09 [DOI] [PMC free article] [PubMed] [Google Scholar]
- Collier J., Murray S. R., Shapiro L. (2006). DnaA couples DNA replication and the expression of two cell cycle master regulators. EMBO J 25, 346–356. 10.1038/sj.emboj.7600927 [DOI] [PMC free article] [PubMed] [Google Scholar]
- Collier J., McAdams H. H., Shapiro L. (2007). A DNA methylation ratchet governs progression through a bacterial cell cycle. Proc Natl Acad Sci U S A 104, 17111–17116. 10.1073/pnas.0708112104 [DOI] [PMC free article] [PubMed] [Google Scholar]
- Cuajungco M. P., Podevin W., Valluri V. K., Bui Q., Nguyen V. H., Taylor K. (2012). Abnormal accumulation of human transmembrane (TMEM)-176A and 176B proteins is associated with cancer pathology. Acta Histochem 114, 705–712. 10.1016/j.acthis.2011.12.006 [DOI] [PMC free article] [PubMed] [Google Scholar]
- Domian I. J., Quon K. C., Shapiro L. (1997). Cell type-specific phosphorylation and proteolysis of a transcriptional regulator controls the G1-to-S transition in a bacterial cell cycle. Cell 90, 415–424. 10.1016/S0092-8674(00)80502-4 [DOI] [PubMed] [Google Scholar]
- Domian I. J., Reisenauer A., Shapiro L. (1999). Feedback control of a master bacterial cell-cycle regulator. Proc Natl Acad Sci U S A 96, 6648–6653. 10.1073/pnas.96.12.6648 [DOI] [PMC free article] [PubMed] [Google Scholar]
- Ely B. (1991). Genetics of Caulobacter crescentus. Methods Enzymol 204, 372–384. 10.1016/0076-6879(91)04019-K [DOI] [PubMed] [Google Scholar]
- Evinger M., Agabian N. (1977). Envelope-associated nucleoid from Caulobacter crescentus stalked and swarmer cells. J Bacteriol 132, 294–301. [DOI] [PMC free article] [PubMed] [Google Scholar]
- Gora K. G., Tsokos C. G., Chen Y. E., Srinivasan B. S., Perchuk B. S., Laub M. T. (2010). A cell-type-specific protein-protein interaction modulates transcriptional activity of a master regulator in Caulobacter crescentus. Mol Cell 39, 455–467. 10.1016/j.molcel.2010.06.024 [DOI] [PMC free article] [PubMed] [Google Scholar]
- Holtzendorff J., Hung D., Brende P., Reisenauer A., Viollier P. H., McAdams H. H., Shapiro L. (2004). Oscillating global regulators control the genetic circuit driving a bacterial cell cycle. Science 304, 983–987. 10.1126/science.1095191 [DOI] [PubMed] [Google Scholar]
- Hottes A. K., Shapiro L., McAdams H. H. (2005). DnaA coordinates replication initiation and cell cycle transcription in Caulobacter crescentus. Mol Microbiol 58, 1340–1353. 10.1111/j.1365-2958.2005.04912.x [DOI] [PubMed] [Google Scholar]
- Iniesta A. A., McGrath P. T., Reisenauer A., McAdams H. H., Shapiro L. (2006). A phospho-signaling pathway controls the localization and activity of a protease complex critical for bacterial cell cycle progression. Proc Natl Acad Sci U S A 103, 10935–10940. 10.1073/pnas.0604554103 [DOI] [PMC free article] [PubMed] [Google Scholar]
- Jenal U., Fuchs T. (1998). An essential protease involved in bacterial cell-cycle control. EMBO J 17, 5658–5669. 10.1093/emboj/17.19.5658 [DOI] [PMC free article] [PubMed] [Google Scholar]
- Jonas K., Chen Y. E., Laub M. T. (2011). Modularity of the bacterial cell cycle enables independent spatial and temporal control of DNA replication. Curr Biol 21, 1092–1101. 10.1016/j.cub.2011.05.040 [DOI] [PMC free article] [PubMed] [Google Scholar]
- Lam H., Schofield W. B., Jacobs-Wagner C. (2006). A landmark protein essential for establishing and perpetuating the polarity of a bacterial cell. Cell 124, 1011–1023. 10.1016/j.cell.2005.12.040 [DOI] [PubMed] [Google Scholar]
- Laub M. T., McAdams H. H., Feldblyum T., Fraser C. M., Shapiro L. (2000). Global analysis of the genetic network controlling a bacterial cell cycle. Science 290, 2144–2148. 10.1126/science.290.5499.2144 [DOI] [PubMed] [Google Scholar]
- Laub M. T., Chen S. L., Shapiro L., McAdams H. H. (2002). Genes directly controlled by CtrA, a master regulator of the Caulobacter cell cycle. Proc Natl Acad Sci U S A 99, 4632–4637. 10.1073/pnas.062065699 [DOI] [PMC free article] [PubMed] [Google Scholar]
- Laub M. T., Shapiro L., McAdams H. H. (2007). Systems biology of Caulobacter. Annu Rev Genet 41, 429–441. 10.1146/annurev.genet.41.110306.130346 [DOI] [PubMed] [Google Scholar]
- Lesley J. A., Shapiro L. (2008). SpoT regulates DnaA stability and initiation of DNA replication in carbon-starved Caulobacter crescentus. J Bacteriol 190, 6867–6880. 10.1128/JB.00700-08 [DOI] [PMC free article] [PubMed] [Google Scholar]
- McAdams H. H., Shapiro L. (2011). The architecture and conservation pattern of whole-cell control circuitry. J Mol Biol 409, 28–35. 10.1016/j.jmb.2011.02.041 [DOI] [PMC free article] [PubMed] [Google Scholar]
- McGrath P. T., Iniesta A. A., Ryan K. R., Shapiro L., McAdams H. H. (2006). A dynamically localized protease complex and a polar specificity factor control a cell cycle master regulator. Cell 124, 535–547. 10.1016/j.cell.2005.12.033 [DOI] [PubMed] [Google Scholar]
- Meisenzahl A. C., Shapiro L., Jenal U. (1997). Isolation and characterization of a xylose-dependent promoter from Caulobacter crescentus. J Bacteriol 179, 592–600. [DOI] [PMC free article] [PubMed] [Google Scholar]
- Miller J. H. (1972). Experiments in Molecular Genetics. Cold Spring Harbor, NY: Cold Spring Harbor Laboratory. [Google Scholar]
- Quon K. C., Marczynski G. T., Shapiro L. (1996). Cell cycle control by an essential bacterial two-component signal transduction protein. Cell 84, 83–93. 10.1016/S0092-8674(00)80995-2 [DOI] [PubMed] [Google Scholar]
- Quon K. C., Yang B., Domian I. J., Shapiro L., Marczynski G. T. (1998). Negative control of bacterial DNA replication by a cell cycle regulatory protein that binds at the chromosome origin. Proc Natl Acad Sci U S A 95, 120–125. 10.1073/pnas.95.1.120 [DOI] [PMC free article] [PubMed] [Google Scholar]
- Reisenauer A., Shapiro L. (2002). DNA methylation affects the cell cycle transcription of the CtrA global regulator in Caulobacter. EMBO J 21, 4969–4977. 10.1093/emboj/cdf490 [DOI] [PMC free article] [PubMed] [Google Scholar]
- Reisenauer A., Quon K., Shapiro L. (1999). The CtrA response regulator mediates temporal control of gene expression during the Caulobacter cell cycle. J Bacteriol 181, 2430–2439. [DOI] [PMC free article] [PubMed] [Google Scholar]
- Sambrook J., Fritsch E. F., Maniatis T. (1989). Molecular Cloning: A Laboratory Manual. Cold Spring Harbor, NY: Cold Spring Harbor Laboratory. [Google Scholar]
- Shen X., Collier J., Dill D., Shapiro L., Horowitz M., McAdams H. H. (2008). Architecture and inherent robustness of a bacterial cell-cycle control system. Proc Natl Acad Sci U S A 105, 11340–11345. 10.1073/pnas.0805258105 [DOI] [PMC free article] [PubMed] [Google Scholar]
- Simon R., Priefer U., Puhler A. (1983). A broad host range mobilization system for in vivo genetic engineering: transposon mutagenesis in Gram-negative bacteria. Biotechnology 1, 784–791. 10.1038/nbt1183-784 [DOI] [Google Scholar]
- Spencer W., Siam R., Ouimet M. C., Bastedo D. P., Marczynski G. T. (2009). CtrA, a global response regulator, uses a distinct second category of weak DNA binding sites for cell cycle transcription control in Caulobacter crescentus. J Bacteriol 191, 5458–5470. 10.1128/JB.00355-09 [DOI] [PMC free article] [PubMed] [Google Scholar]
- Stephens C., Reisenauer A., Wright R., Shapiro L. (1996). A cell cycle-regulated bacterial DNA methyltransferase is essential for viability. Proc Natl Acad Sci U S A 93, 1210–1214. 10.1073/pnas.93.3.1210 [DOI] [PMC free article] [PubMed] [Google Scholar]
- Tan M. H., Kozdon J. B., Shen X., Shapiro L., McAdams H. H. (2010). An essential transcription factor, SciP, enhances robustness of Caulobacter cell cycle regulation. Proc Natl Acad Sci U S A 107, 18985–18990. 10.1073/pnas.1014395107 [DOI] [PMC free article] [PubMed] [Google Scholar]
- Tsang P. H., Li G., Brun Y. V., Freund L. B., Tang J. X. (2006). Adhesion of single bacterial cells in the micronewton range. Proc Natl Acad Sci U S A 103, 5764–5768. 10.1073/pnas.0601705103 [DOI] [PMC free article] [PubMed] [Google Scholar]
- West L., Yang D., Stephens C. (2002). Use of the Caulobacter crescentus genome sequence to develop a method for systematic genetic mapping. J Bacteriol 184, 2155–2166. 10.1128/JB.184.8.2155-2166.2002 [DOI] [PMC free article] [PubMed] [Google Scholar]
- Winzeler E., Shapiro L. (1995). Use of flow cytometry to identify a Caulobacter 4.5 S RNA temperature-sensitive mutant defective in the cell cycle. J Mol Biol 251, 346–365. 10.1006/jmbi.1995.0439 [DOI] [PubMed] [Google Scholar]
- Zweiger G., Marczynski G., Shapiro L. (1994). A Caulobacter DNA methyltransferase that functions only in the predivisional cell. J Mol Biol 235, 472–485. 10.1006/jmbi.1994.1007 [DOI] [PubMed] [Google Scholar]