Abstract
Signal transducers and activators of transcription (STAT) 1 plays a pivotal role in cell-cycle and cell-fate determination, and vascular endothelial growth factor (VEGF) also contributes tumor growth. Recently interferon (IFN) α has been reported to be effective for prevention of hepatocellular carcinomas (HCCs) recurrence, but the detailed mechanisms remain elusive. In vitro, cobalt chloride–treated VEGF induction and hypoxia responsive element (HRE) promoter activity were inhibited by IFNs and this abrogation was cancelled by introduction of small interfering RNA for STAT1. Immunoprecipitation /Chromatin Immunoprecipitation analyses showed STAT1 bound to hypoxia-inducible factor (HIF)-1α and dissociated HIF-complex from HRE promoter lesion. In a xenograft model using Balb/c nude mice, tumor growth was suppressed by IFNα through inhibition of VEGF expression and it was oppositely enhanced when STAT1-deleted cells were injected. This augmentation was due to upregulation of VEGF and hyaluronan synthase 2. In human samples, 29 HCCs were resected, divided into two groups based on STAT1 activation in tumor and the clinical features were investigated. Patients with suppressed STAT1 activity had a shorter recurrence-free survival. Histological and RT-PCR analyses showed portal vein microinvasion and increased VEGF levels in tumors from suppressed STAT1 group. These human samples also showed a reverse correlation between VEGF and STAT1-regulated genes expression. These results in vitro and in vivo suggested that IFNα are potential candidates for prevention of vessel invasion acting through inhibition of VEGF expression and need to be properly used when STAT1 expression is suppressed.
Keywords: STAT1, VEGF, HCC, HIF-1, IFNα
INTRODUCTION
Hepatocellular carcinoma (HCC) is a very common malignancy and causes more than six hundred thousand patients’ deaths annually worldwide. The prognosis of HCC is still poor because it often develops with vessel invasion. Several studies have revealed that neovascularization and angiogenic factors, such as vascular endothelial growth factor (VEGF), are significantly upregulated in human HCC samples and play a considerable role in its development and progression.1
VEGF contributes to completing vessel invasion and distant metastasis because angiogenesis is thought to be essential for tumor growth. In addition, it is thought that cancer tissues with abundant tumor vessels have many routes of access to distant organs. We are interested not only in the angiogenic potential of VEGF but its permeability potential. The permeability function of VEGF appears to strongly involve cancer invasion and metastasis, because high permeability leads to the fragility and opening of cell-to-cell adherence in the vascular endothelium, which might allow the cancer cells to migrate into the vascular lumen.2
Interferon (IFN) therapy is frequently used for eradication of HCV and recently for prevention of HCC recurrence. IFNs are a superfamily of proteins secreted by human cells that manifest multiple functions in the human body such as protection of cells from viral infection, regulation of cell growth, and modulation of the immune system. There are two types of IFN, type 1 IFN (IFNα/β) and type II IFN (IFNγ). The roles of these IFNs against tumor progression and invasion have been reported by several investigators. IFNα inhibits VEGF expression and tumor angiogenesis in neuroendocrine tumors.3 Qin H et al. showed that IFNγ downregulates matrix metalloproteinase (MMP) 2, and Singh RK et al. presented results showing that IFNα suppresses fibroblast growth factor 2 (FGF2).4, 5 As for signal transducers and activators of transcription (STAT) 1, which is activated by IFNs, genetic polymorphisms in STAT1 gene is reported to associate with increased risk of HCC.6 In a clinical setting, however, it remains unclear whether and how IFN-STAT signal transduction is associated with tumor progression and vessel invasion. In this study, we investigated the role of IFN-STAT signaling in the process of HCC tumor development by using a combination of clinical HCC samples, several HCC cell lines and tumor-transplanted nude mice.
MATERIALS and METHODS
Cell lines and tissues
Human hepatoma cell lines, PLC/PRF/5, Huh7 and HepG2, were purchased from American Type Culture Collection approximately 3 years ago, and have been tested every year to confirm that their sequences were conserved. They were cultured with Dulbecco’s modified Eagle medium supplemented with 10% heat-inactivated fetal bovine serum and treated with various concentrations of IFNα (R&D systems, Minneapolis, MN)/γ (Hayashibara Co. Ltd. Group, Japan) and/or 100 mM of CoCl2 (Sigma) and/or 100 ng/ml of IL-6 (R&D systems) or exposed to hypoxia (1% O2 condition), and then extracted 24 hours after stimulation. To block JAK-STAT signal transduction, 100 nM of JAK inhibitor 1, a broad inhibitor of JAKs (Calbiochem, Darmstadt, Germany) or S31-201, specific STAT3 inhibitor (Selleck, TX) was pretreated 1 hour before stimulation. For detection of hydroxylated-HIF-1α, cells were extracted with lysate buffer including 10 μM of MG132 (Sigma). HCCs and adjacent non-tumor counterparts were obtained at the time of surgical resection. Written informed consent was provided from each patient. We also obtained the approval of the Ethics committee in Osaka University Graduate School of Medicine.
Plasmid constructs
The pGL2TK plasmid was generated by replacing the SV40 promoter of pGL2 promoter (Promega) with the herpes simplex virus TK promoter fragment (from −105 to +51). The pGL2TkHRE plasmid was kindly provided by Uranchimeg B, National Cancer Institute. In brief, it was produced by subcloning three copies of the HRE (5′-GTGACTACGTGCTGCCTAG-3′) from the iNOS promoter into the pGL2TK promoter vector.7
Mice
Balb/c nude mice (CAnN.Cg-Foxn1nu/CrlCrlj) were purchased from Charles River Laboratories (Yokohama, Japan). They were maintained in a specific pathogen–free facility and treated with humane care with approval from the Animal Care and Use Committee of Osaka University Medical School.
Xenograft tumor
To produce a xenograft tumor, 5 × 10⁶ PLC/PRF/5 cells were subcutaneously injected to Balb/c nude mice. For anticancer therapy, 5 × 10⁴ IU/mouse of human IFNα was administrated intraperitoneally (IP) every day, and the same volume of 0.9% saline was injected as a control. Treatment with 10 μg/g BW of bevacizumab (Chugai Pharmaceutical Co., Japan) IP was started 3 days after injection of HCC cells and was continued 3 times a week.
Immunoblotting and Immunostaining
For immunoblotting, total cellular protein was electrophoretically separated by sodium dodecyl sulfate polyacrylamide gels and transferred onto PVDF membrane. The membrane was blocked in Tris-buffered saline-Tween containing 5% skim milk for 1 hour and then probed with primary Antibody (Ab) at 4°C overnight. Rabbit monoclonal anti-pSTAT1/STAT1/HIF-1α/hydroxylated HIF-1α Abs and mouse monoclonal anti-STAT3/pSTAT3 Abs were purchased from Cell SignalingTechnology (Beverly, MA). Mouse monoclonal anti-VEGF Ab was from Calbiochem, and anti-CD31 Ab was from R&D systems. Mouse polyclonal anti-β-actin was obtained from Sigma. Horseradish peroxidase-conjugated anti-rabbit or mouse Ab and SuperSignal West Pico System (Pierce, Rockford, IL) were used for the detection of blots.
For immunohistochemistry, tumors were excised and prepared for immunostaining. Tumors were consecutively incubated in PBST for 15 minutes, in blocking buffer (PBST, 5% normal goat serum, 0.2% bovine serum albumin) for 30 minutes, in anti-CD31 Ab in blocking buffer for 12 hours, in PBST for 15 minutes, in Alexa fluor 594 (Molecular Probes, NY) in blocking buffer for an hour, and in PBST for 30 minutes. Finally, a coverslip was mounted in the mounting medium (Vectashield, Vector Laboratories) with 4′,6-diamidino-2′-phenylindole-dihydrochrolide, and the cells were examined by microscopy.
Protein-protein interaction analysis
To examine the binding of STAT1 protein to HIF-1α protein, immunoprecipitation/western blot analyses were used. The detail procedure is described elsewhere.8 In brief, from CoCl2 and IFNγ-treated PLC/PRF/5 cells, the cellular protein was extracted and precleared by incubation with protein A-Sepharose beads at 4 °C for 1 hour. Next, the sample was incubated with beads coupled to STAT1, pSTAT1, HIF-1α, or hydroxylated-HIF-1α antibody, or rabbit nonspecific γ-globulin (Dako, Denmark) for 18 hours. The immune complex was eluted by being boiled for 5 minutes, and finally the supernatant was used for western blot to detect each protein.
Analyses of cell growth
To examine the cell growth curve, 5 × 10³ of PLC/PRF/5 cells were seeded on a 96-well culture plate. After 24, 48, 72, and 96 hours, the net number of viable cells was assessed colorimetrically using water-soluble tetrazolium (2-[2-methoxy-4-nitrophenyl]-3-[4-nitrophenyl]-5-[2,4-disulfophenyl]-2H-tetrazolium monosodium salt) (Roche Applied Science, IN). This assay is based on cleavage of the tetrazolium salt by mitochondrial dehydrogenase in viable cells. For the assay, 10 μl of the water-soluble tetrazolium reagent was added to the 100-μl culture medium, followed by the incubation at 37 °C for 1 hour. The optical density at 450 nm was measured. The assay was done in quadruplicate, and the values were expressed as the means ± S.D.
ChIP
ChIP analysis was basically performed according to the manufacturers’ instructions of MAGnify Chromatin Immunoprecipitation System (Invitrogen). In brief, cells (approx 5.0 × 10⁷) were grown to a confluencey of 85–90% in complete media and treated with 100 μM CoCl2 for 24 hours. These cells were treated with 1% formaldehyde for 10 minutes at room temperature, followed by the addition of 1.25 M glycine to a final concentration of 0.125 M. Cells were washed in 4°C PBS and pelleted in 1 ml of lysis buffer with protease inhibitors and incubated for 10 minutes at 4°C. Nuclear lysates were sonicated (Sonifier 250, Branson) for 15 cycles of 30 seconds ON and 30 seconds OFF to shear DNA to 200-500 bp fragments. Chromatin solutions were precleared and incubated with anti-HIF-1α, STAT1 or the nonspecific γ-globulin (negative control) and rotated overnight at 4°C. Chromatin/protein complex was purified and applied to PCR analysis. The region −1386 to −1036 of the VEGF promoter was PCR amplified from the immunoprecipitated chromatin using the following primers: sense 5′-CAGGTCAGAAACCAGCCAG, antisense; 5′-CGTGATGATTCAAACCTACC. The 350-bp PCR product was resolved on a 1.2% agarose gel and visualized by ethidium bromide staining and UV illumination.
RNA extraction, real-time PCR analysis and small RNA interference
Total RNA was isolated (miRNeasy Mini Kit, Qiagen, Valencia, CA), reverse-transcribed (High Capacity RNA-to-cDNA Master Mix, Applied Biosystems) and then applied to real-time PCR analysis (TaqMan Gene Expression Assays, Applied Biosystems) normalized to beta-actin expression levels. All measurements were performed in triplicate. The details of each probe for real-time PCR are described in Supplementary Table 1. Cells were transfected with Stealth select RNAi (RNA interference, set of three oligonucleotides, Invitrogen) directed against STAT1. A Stealth RNAi negative control kit (set of three oligonucleotides, Invitrogen) was used as a control for sequence-independent effects following Stealth RNAi delivery. The transfections were carried out using Lipofectamine RNAiMAX (Invitrogen) according to the reverse transfection protocol.
Quantitative analysis of hyaluronic acid
Hyaluronic acid ELISA kit was purchased from Biotech Trading Partners (NY). Each assay was performed according to the manufacturer’s instructions. In brief, the removed subcutaneous tumors were dried and treated with pronase E for 24 hours. The product was boiled for 10 minutes and centrifuged, and the supernatants were subjected to ELISA assay.
Statistical analysis
Data were presented as mean ± SE (for in vivo experiments) or as mean ± SD (for in vitro experiments). Comparisons between the two groups were performed by the unpaired t-test. Multiple comparisons were performed by ANOVA with the Scheffe post hoc test. Recurrence-free survival curves were estimated using the Kaplan-Meier method. P <.05 was considered statistically significant.
RESULTS
IFNα suppresses VEGF expression through inhibiting HRE-promoter activity
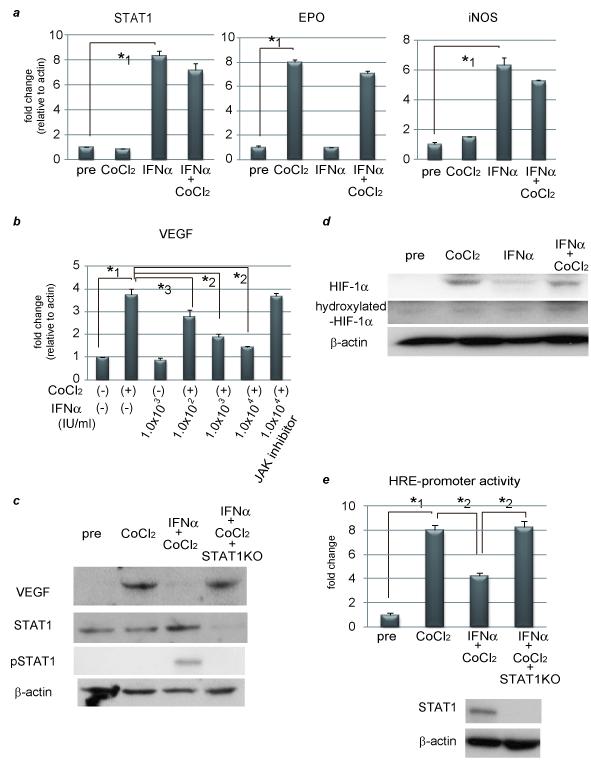
To clarify the relationship between STAT1 activity and VEGF expression in HCC, we used a hypoxia model to induce VEGF expression, and treated HCC cell lines with IFNα, which is known to activate STAT1.9 This hypoxia model mimics the clinical setting of HCC, which was done by administration of cobalt chloride (CoCl2). Our results shown in Fig. 1a were compatible with previous reports, suggesting that both CoCl2 and IFNα worked well in this experiment using PLC/PRF/5 cells. VEGF mRNA/protein expression was enhanced by CoCl2, but this induction was inhibited by IFNα administration in a dose-dependent manner. This inhibitory effect was cancelled by introduction of Janus kinase (JAK) inhibitor or STAT1 knockdown (Figs. 1b and 1c). HepG2 and Huh7 cells were both used and displayed the same tendencies as these results (Supplementary Fig.1). VEGF expression is regulated by the heterodimeric hypoxia-inducible factor (HIF)-1, which is made up of HIF-1α and HIF-1β to the hypoxia-responsive elements (HRE) on several target genes. HIF-1β is constitutively expressed irrespective of various conditions, but HIF-1α is proline-hydroxylated leading to a conformational change that promotes ubiquitination and proteasomal degradation under normoxic conditions.10 We next tried to find how CoCl2-induced VEGF induction was suppressed by IFNα stimulation by examining the expression levels of HIF-1α and hydroxylated HIF-1α. CoCl2 induced HIF-1α expression, and this induction level was not altered by IFNα treatment (Fig. 1d). Hydroxylated HIF-1α was expressed at low levels with or without CoCl2 and/or IFNα. This inhibitory effect of IFNα on VEGF expression was also seen in low O2 condition (Supplementary Fig. 2). Next, HRE promoter activity was assessed by transfection of the luciferase construct (pGL2TkHRE) which included HRE and the minimal promoter thymidine kinase (TK) gene upstream of the luciferase gene. 7, 11 As shown in Fig. 1e, HRE promoter activity was enhanced by treatment with CoCl2, and this upregulation was inhibited by IFNα stimulation. This inhibitory effect was abolished by introducing STAT1 siRNA as is the case with VEGF expression. IFNγ has also the same inhibitory effect on VEGF expression as IFNα (Supplementary Fig. 3). Our results, therefore, show that activation of JAK-STAT1 signal transduction causes inhibition of VEGF expression through suppression of HRE promoter activity.
Figure 1. IFNα suppresses VEGF expression through inhibiting HRE-promoter activity by interaction between STAT1 and HIF-1 complex.
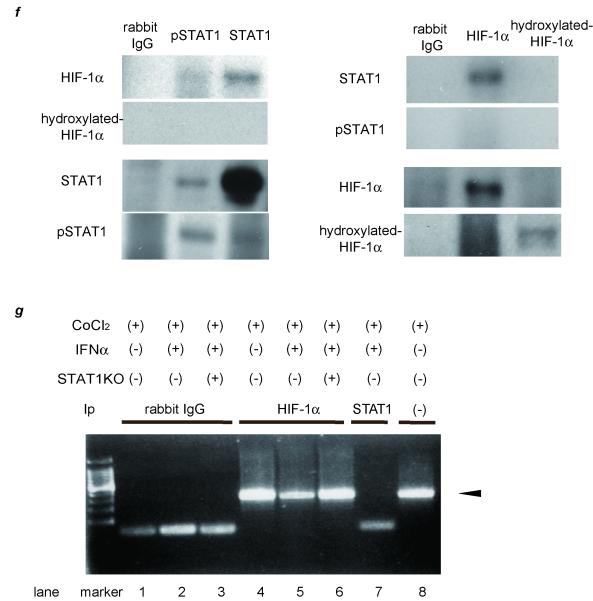
(a) (b) Expression levels as detected by real-time RT-PCR analysis. Cells were treated with 100 μM CoCl2 and/or 1.0 × 10³ IU/ml (a) or various concentrations of IFNα (b) for 24 hours. To block JAK-STAT signal transduction, 100 nM of JAK inhibitor 1 was pretreated 1 hour before stimulation. (c) Activation of STAT1 and expression of STAT1 and VEGF as detected by western blot analysis. PLC/PRF/5 cells were transfected with control siRNA or siRNA for STAT1 and subjected to each stimulation for 24 hours. (d) Expression levels of HIF-1α and hydroxylated-HIF-1α as detected by western blot analysis. (e) Cells were cotransfected of the pGL2TkHRE plasmid or the pGL2Tk plasmid (as a control vector) with the pRLtK plasmid (Promega). The cells were then stimulated with 100 mM of CoCl2 units/ml and/or 1.0 × 10³ IU/ml of IFNα, or left unstimulated, and subjected to dual luciferase assay. The relative light unit of the unstimulated sample was considered as 1 and the data were expressed as mean ± S.D. Lower panel shows expression levels of STAT1 as detected by western blot analysis. (f) Cellular lysates from CoCl2 and IFNγ-treated PLC/PRF/5 cells were immunoprecipitated with nonspecific γ-globulin (lane 1) and antibodies against pSTAT1 (left panel, lane 2), STAT1 (left panel, lane 3), HIF-1α (right panel, lane 2), and hydroxylated-HIF-1α (right panel, lane 3), and the immunoprecipitates were subjected to western blot analysis to detect each protein. (g) ChIP assay with HIF1α or STAT1 antibody. Cells were transfected with siRNA for STAT1 or control, and stimulated with CoCl2 for 24 hours and/or IFNα for 3 hours. The immunoprecipitated DNA was purified and the region from −1386 to −1036 base pairs of the human VEGF promoter was amplified by PCR (35 cycles). Cell lysates without Ip was used as a positive control (lane 8). Asterisks indicate significant differences (*1, P<.001, *2, P<.01, *3, P<.05).
STAT1 forms a complex with HIF-1α
We hypothesized that a direct interaction of STAT1 and HIF-1 could be responsible for the effect of pSTAT1 on formation of the HIF-1 complex or on its binding to HRE. To test this, we examined the binding of STAT1 to HIF-1 protein by means of immunoprecipitation (Ip)/western blot analysis (Fig. 1f). From CoCl2 and IFNγ-treated PLC/PRF/5 cells, the cellular protein was extracted and applied to Ip assay. The HIF-1α protein was not found in the negative control using nonspecific γ-globulin (lane 1) but detected in the immunoprecipitates using antibodies against pSTAT1 (lane 2) and STAT1 (lane 3). In similar fashion, STAT1 protein was seen in the immunoprecipitates using antibodies against HIF-1α. These findings indicate the possible binding of HIF-1α protein to STAT1 protein. To further determine if this interaction has an effect on binding of the HIF-1 complex to HRE, we performed in vitro chromatin immunoprecipitation (ChIP) assays. Cultured cells were treated with CoCl2 in the absence (Fig. 1g, lanes 1, 4) or presence of IFNγ (lanes 2, 5). Prior to these treatments, STAT1 expression was knocked down by siRNA (lanes 3, 6). The PCR product designed within HRE was not found in the negative control sample using nonspecific γ-globulin (lanes 1-3) but detected in the immunoprecipitates using antibodies against HIF-1α (lanes 4-6). The detection level was less in IFNα-treated cells, and this inhibitory effect was canceled in STAT1-deleted cells. No bands were seen in immunoprecipitates using STAT1 antibodies (lane 7) though STAT1 binds to HIF-1α complex and then might be associated with HRE. These results indicate that STAT1 bound to HIF-1α protein, and this binding caused the HIF-1α complex disassociate with HRE.
IFNα has an inhibitory effect on tumor development in the presence of STAT1 but an opposite effect in the absence of STAT1
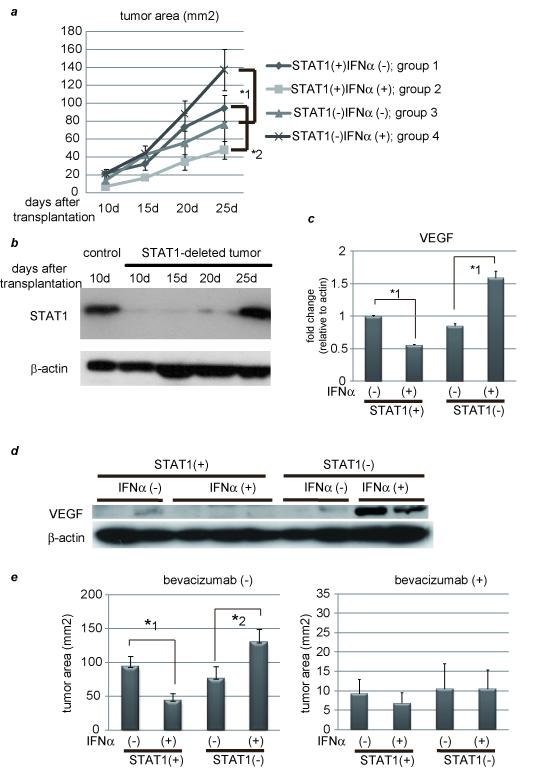
Several investigators have already reported that IFNα has anti-proliferative effects by inhibiting cell-cycle progression or by inducing apoptosis.12, 13 In vitro, the growth of cultured cells were inhibited by IFNα stimulation irrespective of STAT1, indicating that anti-proliferative effects involve both STAT1-dependent and -independent mechanisms (Supplementary Fig. 4). To clarify the relationship between IFNα-STAT1 and VEGF in vivo, we developed a xenograft model using nude mice. STAT1 gene knock down by siRNA was tested for reduction of STAT1 levels in several hepatoma cell lines. Western blot analysis showed STAT1 expression had been reduced by this method for more than 20 days, and that it was most efficient in PLC/PRF/5 cells (Supplementary Fig. 5). Several nude mice were then subcutaneously injected with control and STAT1-deleted cells to form xenograft tumors and were randomly assigned into two groups; one was treated with human IFNα, and the other with 0.9% saline as the control. In the presence of STAT1, IFNα had a strong inhibitory effect on the tumor development as expected, but in the absence of STAT1, surprisingly, IFNα had the opposite effect, that is, it enhanced tumor growth (Fig. 2a). Without IFNα treatment, there was no significant difference in tumor growth between control and STAT1-deleted cells. We also confirmed that STAT1 expression in tumor had been knocked down for at least 20 days after injection (Fig. 2b). Real-time RT-PCR and western blot analyses revealed that VEGF expression in tumors resected 20 days after transplantation was lower in the IFNα-treated group than in the control, which was consistent with the in vitro results, but surprisingly it was increased when the STAT1 gene was knocked down (Figs. 2c and 2d). To examine whether inhibition or progression of tumor growth was due to VEGF levels, we used bevacizumab, a VEGF monoclonal antibody, and measured tumor size at 25 days after injection of tumor cells. No differences were noted between the control and IFNα-treated groups irrespective of STAT1 expression when these mice were treated with bevacizumab (Fig. 2e). To examine the possibility that the human IFNα acts in vivo equally well on mouse cells and on human cell lines, we extracted mouse liver as well as transplanted tumor and examined STAT1 activity. It revealed that STAT1 was strongly activated in human cell lines but less activated in mouse liver (Supplementary Fig. 6). These data suggest that in this model, IFNα had an inhibitory effect on tumor growth through inhibition of VEGF expression, and that it also had a promotive effect through enhancement of VEGF expression when STAT1 expression was knocked down in tumor cells.
Figure 2. IFNα has an inhibitory effect on tumor development in the presence of STAT1 but an opposite effect in the absence of STAT1.
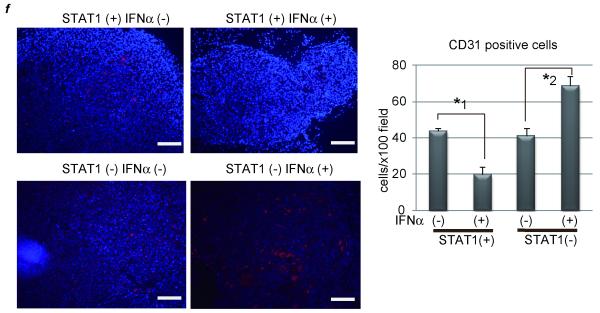
(a) PLC/PRF/5 cells were transfected with control siRNA (group 1 and 2) or siRNA for STAT1 (group 3 and 4). One day after treatment, 5 × 10⁶ of these cells were subcutaneously injected to Balb/c nude mice, and tumor area was measured every 5 days. In two groups (group 2 and 4), 5 × 10⁴ IU/mouse of IFNα were administered IP every day, and in the other groups (group 1 and 3) the same volume of 0.9% saline was injected as a control. The number of mice in each group was 5-7. (b) Expression levels of STAT1 as detected by western blot analysis. Each subcutaneous tumor in group 4 was removed at the different time points (10, 15, 20, 25 days after transplantation). One of tumors in group 2 was used as a positive control. (c) (d) Expression levels of VEGF as detected by real-time RT-PCR or western blot analysis. Each subcutaneous tumor was removed 20 days after transplantation. (e) Tumor area at 25 days after transplantation in each group in the absence (left panel) or presence (right panel) of bevacizumab, the monoclonal anti-VEGF antibody (N = 5-7 per group). Three days after injection of tumor cells, 10 mg/g body weight of bevacizumab were injected IP twice a week. (f) Immunofluorescent staining with anti-CD31 (red) antibody and Dapi (blue). Images are shown at low magnification (100×, left panel). Bars, 200 μm. The number of CD31-positive cells were presented (right panel). These data were acquired from three different fields in each tumor. Asterisks indicate significant differences (*1, P<.01, *2, P<.05).
As a typical hypervascular tumor, HCC produces and secretes VEGF, thereby forming new tumor vessels, which provide oxygen and nutrients to cancer cells causing them to grow. Microvessel density was assessed by CD31 immunostaining of hepatic tumors resected 25 days after injection of tumor cells. It revealed that the number of CD31 positive cells, as an indicator of microvessels, was less in IFNα-treated mice, but without STAT1 they were enhanced by IFNα administration (Fig. 2f). Taken together, IFNα plays contrary roles for forming tumor vessels by regulating VEGF expression.
IFNα regulates VEGF expression through STAT3 activation in STAT1-null cells
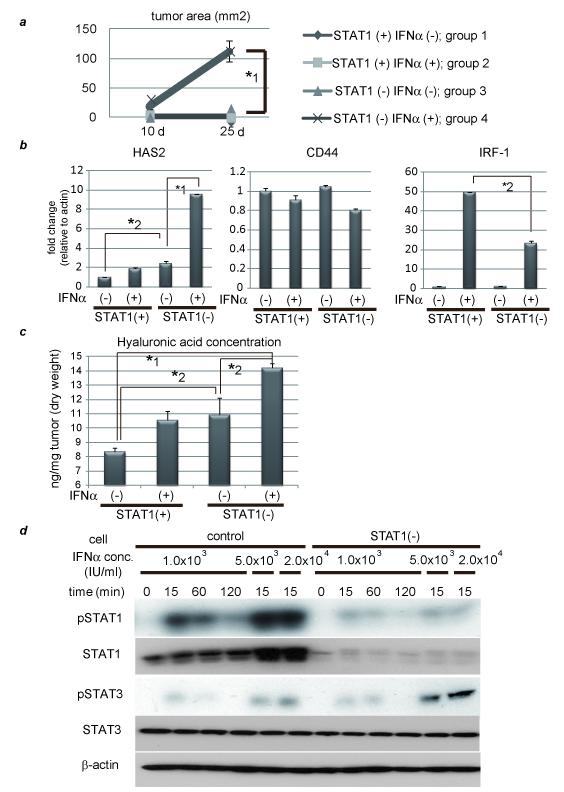
Tumor growth was seen only in the STAT1-deleted and IFNα-treated group even when 1 × 10⁵ cells were injected, although no tumors were observed in the other groups (Fig. 3a). Some adhesion molecules were examined and hyaluronan synthase (HAS) 2 was induced by IFNα stimulation in the STAT1-deleted cells and higher expression levels of hyaluronic acid were observed in the STAT1-deleted and IFNα-treated tumors (Figs. 3b, 3c and Supplementary Fig. 7). The presence of STAT1 has an effect on them because HAS2 expression and HA concentration were also different between STAT1 (+);IFN (−) group and STAT1(−);IFN (−) group. These results indicate that IFNα-STAT1 regulates HAS2 expression, promoting attachment of tumor cells, because HAS2 has been implicated in the developmental process involving adherence to the extracellular matrix and tissue expansion through high expression of hyaluronic acid.14
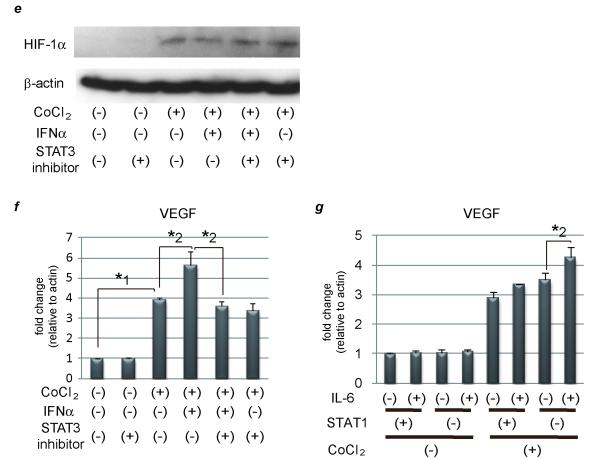
Figure 3. IFNα causes enhancement of HAS2 and VEGF through STAT3 activation in the absence of STAT1.
(a) 1 × 10⁵ of transfected cells were subcutaneously injected to Balb/c nude mice. Other procedures are the same as Fig. 3b. (b) Expression levels of hyaluronic acid synthase (HAS) 2, CD44, and IRF-1 as detected by real-time RT-PCR analysis. PLC/PRF/5 cells were transfected with control siRNA or siRNA for STAT1 and stimulated on the next day with 5.0 × 10³ IU/ml of IFNα for 3 hours or left untreated. (c) Hyaluronic acid levels of each tumor as detected by ELISA assay. (d) Activation/expression of STAT1 and STAT3 as detected by western blot analysis. PLC/PRF/5 cells were transfected with control siRNA or siRNA for STAT1 and stimulated on the next day with various concentration of IFNα for 15, 60, or 120minutes. (e) (f) STAT1-knockdown cells were pretreated with or without 100 μM of S31-201, a specific STAT3 inhibitor, before CoCl2 and/or 5.0 × 10³ IU/ml of IFNα. (e) Expression levels of HIF-1α as detected by western blot analysis. (f) (g) Expression levels of VEGF as detected by real-time RT-PCR analysis. (g) Control and STAT1-knockdown cells were treated with CoCl2 and/or 100 ng/ml of IL-6. Asterisks indicate significant differences (*1, P<.001, *2, P<.01).
The inhibitory effect of STAT1 on VEGF expression was due to its binding to HIF-1α, but the enhancement effect remains unclear. Jung JE et al. have reported that STAT3 is a potential modulator of HIF-1-mediated VEGF expression.15 To examine STAT3 activation under IFNα stimulation, western blot analysis was performed. As shown in Fig. 3d, 1.0 × 10³ IU/ml of IFNα induced almost the same level of phosphorylated STAT3 (pSTAT3), but prolonged STAT3 activity more in the STAT1-deleted cells than in the control. Administration of a higher concentration of IFNα, such as 5.0 × 10³ or 2.0 × 10⁴ IU/ml, also caused much more activation of STAT3 in the STAT1 knock-down cells than in the control. These data indicate that IFNα activated STAT3 without de novo protein synthesis, which might result in high expression of VEGF when STAT1 expression has been knocked down. The influence of enhanced STAT3 activity on HIF-1α expression in the STAT1 knock-down cells was examined by western blot analysis but IFNα had no effects on HIF-1α expression, irrespective of S31-201, specific STAT3 inhibitor (Selleck, TX)(Fig. 3e). Administration of CoCl2 induced VEGF expression and this induction was enhanced by IFNα stimulation in STAT1-null cells (Fig. 3f). This augmentation was canceled by pretreatment with S31-201, providing evidence that IFNα enhanced VEGF expression through STAT3 activation in the absence of STAT1. This synergistic effect was found not only with CoCl2 and IFNα stimulation, but also with CoCl2 and IL-6 stimulation (Fig. 3g). These results indicate that inflammation itself is a potent modulator of VEGF expression when STAT1 expression is silenced or downregulated.
Patients with suppressed STAT1 activity show a poor prognosis, which might be linked to upregulation of VEGF
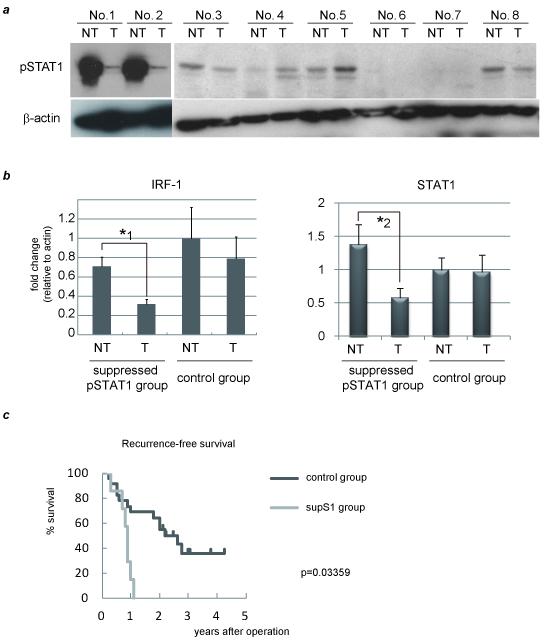
To examine the activity of STAT1 in human HCC samples, we used 29 pairs of surgically resected human HCC tumors (T) and adjacent non-tumor (NT) tissue samples. The backgrounds of the 29 cases are shown in Table 1. No one had received radiation or chemotherapy after surgery. In seven cases, STAT1 phosphrylation was suppressed in T compared to NT while in two cases, it was enhanced. All cases were then divided into two groups. In suppressed STAT1 group, STAT1 activity level was reduced more than by 2-fold in T to NT by western blot (abbreviated as supS1 group, representative data was shown in Fig. 4a, No. 1 and 2). In 22 patients, STAT1 activation was not so changed or enhanced when comparing T with NT (control group, Fig. 4a, No. 3-8). These two groups had no statistical differences in their clinical backgrounds (Table 1). With most the same levels of serum alanine aminotransferase, our results suggest that these two groups had similar levels of hepatic inflammation. Expression of STAT1 target genes, such as interferon regulatory factor (IRF)-1 and STAT1 itself, were measured by real-time RT-PCR, and statistically less expression of these molecules in the supS1 group were found in T than in NT (Fig. 4b). This is evidence for STAT1 activation in the supS1 group being suppressed in HCC tissues. Next, prognostic factors were examined, and surprisingly, all patients in the supS1 group displayed HCC recurrence within two years irrespective of having the same levels of liver function and staging of HCC compared to the control group (Table 1). We also observed suppression of STAT1 activity in tumor was associated with significantly worse recurrence-free survival by Kaplan-Meir analysis (Fig. 4c). As for the cause of the early recurrence in the supS1 group, the rate of microscopic portal venous invasion was significantly higher in the supS1 group. This finding indicates that the early recurrence may be associated with micro-portal invasion.
Table 1. Demographic characteristics of patients and tumors.
Liver function was categorized by Child-Pugh classification and the tumors were also staged by means of the pTNM system. At least every 3 months, diagnostic imaging and blood sampling was done to check for HCC recurrence. Asterisks indicate significant differences (*1, p=0.0033, *2, p=0.042, *3, p=0.008).
| Total HCC patients | Suppressed pSTAT1 group |
control group | |
|---|---|---|---|
| Total number | 29 | 7 | 22 |
| Male/Female | 21 / 8 | 6 / 1 | 15 / 7 |
| Age (year) | 61.6 ± 10.3 | 66.5 ± 8.0 | 60.2 ± 10.8 |
| Etiology (HBV/HCV) | 11 / 15 | 3 / 5 | 8 / 10 |
|
Non-tumor lesion
(normal/CH/LC) |
2 /18 /9 | 0 / 6 / 1 | 2 /12 / 8 |
| ALT | 44.0 ± 30.0 | 41.1 ± 21.0 | 46.2 ± 33.2 |
| Platelets | 15.7 ± 5.8 | 14.7 ± 1.9 | 16.0 ± 5.6 |
| Child (A/B/C) | 20 / 3 / 6 | 7 / 0 / 0 | 13 / 3 / 6 |
| Stage (l / ll / lll / IV) | 2 / 16 / 10 / 1 | 0 / 6 / 1 / 0 | 2 / 10 / 9 / 1 |
|
HCC recurrence
(within/over 2 years) |
15 / 14 | 7 / 0 *1 | 8 / 14 |
| Tumor size (cm) | 4.8 ± 2.6 | 5.5 ± 2.4 | 4.6 ± 2.3 |
|
Macroscopic classification
(simple/surr/multi/invasive) |
6 / 13 / 6 / 4 | 1 / 5 / 0 / 1 | 5 / 8 / 6 / 3 |
| Capsule formation (+/−) | 20 / 9 | 7 / 0 *2 | 13 / 9 |
| Histology(moderate/poor) | 10 / 19 | 3 / 4 | 7 / 15 |
| AFP | 1337 ± 4402 | 766 ± 579 | 1637 ± 5161 |
| Vessel invasion (Vv +/−) | 1 /28 | 0 / 7 | 1 / 21 |
| Vessel invasion (Vp +/−) | 9 / 20 | 5 / 2 *3 | 4 / 18 |
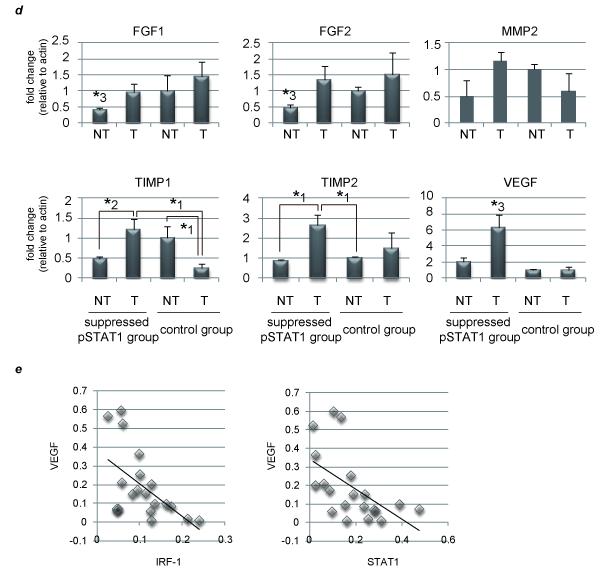
Figure 4. Suppressed STAT1 activity links to upregulation of VEGF, which might cause early HCC recurrence.
29 pairs of surgically resected human HCC tumors (T) and adjacent non-tumor (NT) tissues were used. They were divided into two groups based on STAT1 activity (supS1 versus control). (a) Activation levels of STAT1 in T and NT as detected by western blot analysis. Representative data are presented. (b) (d) Expression levels in each tissue of two divided groups as detected by real-time RT-PCR analysis. The relative expression level of the NT sample in the control group was set as 1, and the fold expression level of each tissue was calculated. (c)Predictors of recurrence-free survival were identified using the Kaplan-Meier method. (e) IRF-1, STAT1, and VEGF mRNA levels in the liver of 29 HCC samples were determined by real-time RT-PCR and plotted to analyze the correlation between IRF-1 and VEGF (Pearson correlation coefficient (R) = −0.5446, P < .01) (left) or between STAT1 and VEGF (R = −0.5514, P < .01) (right). The asterisks indicate significant differences (*1, P<.01, *2, P<.05, *3, P<.05 versus all other groups).
We next asked why suppression of hepatic STAT1 activity could be linked to vessel invasion by examining vessel invasion-related molecules, such as FGF, MMP, tissue inhibitor of metalloproteinase (TIMP) and VEGF, in these two subject groups. VEGF expression level was higher in the whole supS1 group than in the control, and its expression is much more enhanced in T than in NT (Fig. 4d and Supplementary Fig. 8). Other molecules were supposed not to contribute to the high HCC recurrence in supS1 group. Not only angiogenic potential but also permeability functions of VEGF appear to strongly mediate cancer invasion as described in the Introduction section.2, 16 These results and previous reports suggest that inhibited STAT1 activity might cause upregulation of VEGF expression, resulting in portal invasion and poor prognosis.
To investigate finally the direct regulation of VEGF by STAT1 activation, we used these HCC samples. They revealed a reverse correlation between VEGF and STAT1-regulated gene expression, such as IRF-1 and STAT1 itself (Fig. 4e). Since the number of patients in this study was quite small, we cannot come to the strong conclusion, but these results are consistent with the hypothesis that STAT1 activation negatively regulates VEGF expression.
Discussion
Recently, IFNα therapy has been reported to be effective for preventing HCC recurrence. 17 IFN is known to exert immunomodulatory effects by stimulating T cells, natural killer cells and monocytes. These immune cells play roles in prevention of HCC recurrence by IFNα therapy, however, it remains elusive whether IFNα therapy is effective on hepatocytes, and how IFNα mediates its effect on them.
We have shown in vitro that IFNα-treated activation of JAK-STAT pathway causes inhibition of VEGF expression through abrogation of HRE-promoter activity. Some molecules were reported to have effects on gene transcription of VEGF, 3, 18 but this is the first report to show that STAT1 directly binds to HIF-1 and regulates HRE-promoter activity. This is a newly discovered mechanism about IFNα-treated inhibition of VEGF expression, but more important is the fact that IFNα has adverse effects when STAT1 expression is silenced. That is, STAT3 is much more activated under stimulation with IFNα, followed by enhancement of expression of target genes, such as VEGF, as indicated in this study. This is the so-called “STAT-shift”, and the same event occurs in the case of the growth hormone-STAT5, interleukin-6-STAT3.19-21 STAT1 expression is regulated by IFNα, and thus the less activated the STAT1 is, the less it is expressed. This negative loop of STAT1 is more likely to occur in the clinical setting than other STATs. In some cases, IFNα therapy causes rapid progression of HCC with vessel invasion,22 in which case the molecular pathogenesis might be explained by a STAT-shift and negative loop of STAT1 action.
This study has yielded three novel findings. First, patients with suppressed STAT1 activity have poor prognosis because of high HCC recurrence. This might be caused by upregulation of VEGF. Second, IFNα-treated activation of JAK-STAT pathway causes inhibition of VEGF expression through interaction of the HIF-1 complex with STAT1. Third, treatment with IFNα contributes to the harmful consequences when STAT1 expression is silenced or downregulated. These findings should be helpful for deciding which therapy is suitable for HCC patients. In some cases conventional therapy should be replaced by other therapies, such as bevacizumab, one of the molecular target drugs for patients with suppressed STAT1 activity in tumor.
Supplementary Material
Supplementary Figure 1 Huh7 and HepG2 cells have the same tendencies as the case with PLC/PRF/5 cells. Expression levels as detected by real-time RT-PCR analysis. Huh7 and HepG2 cells were treated with 100 μM CoCl2 and/or 1.0 × 10³ IU/ml of IFNα for 24 hours. Asterisks indicate significant differences (*1, P<.001, *2, P<.01).
Supplementary Figure 2 The inhibitory effect of IFNα on VEGF expression was seen in low O2 condition. Activation of STAT1 and expression of HIF-1α, STAT1, and VEGF as detected by western blot analysis. PLC/PRF/5 cells were treated with 1.0 × 10⁴ IU/ml of IFNα and incubated in 1% O2 concentration for 24 hours.
Supplementary Figure 3 IFNγ suppressed VEGF expression through inhibiting HRE-promoter activity. (a) (b) Expression levels as detected by real-time RT-PCR analysis. Cells were treated with 100 μM CoCl2 and/or 100 ng/ml of IFNγ for 24 hours. (c) Activation of STAT1 and expression of VEGF as detected by western blot analysis. PLC/PRF/5 cells were transfected with control siRNA or siRNA for STAT1 and subjected to each stimulation for 24 hours. (d) Expression levels of HIF-1α and hydroxylated-HIF-1α as detected by western blot analysis. (e) Cells were cotransfected of the pGL2TkHRE plasmid or the pGL2Tk plasmid with the pRLtK plasmid. The cells were then stimulated with 100 mM of CoCl2 units/ml and/or 100 ng/ml of IFNγ, or left unstimulated, and subjected to dual luciferase assay. The relative light unit of the unstimulated sample was considered as 1 and the data were expressed as mean ± S.D. Lower panel shows expression levels of STAT1 as detected by western blot analysis. Asterisks indicate significant differences (*1, P<.001, *2, P<.01, *3, P<.05).
Supplementary Figure 4 Cellular proliferation in IFNα-treated cells. PLC/PRF/5 cells were transfected with siRNA for STAT1 or control, and seeded on a 96-well culture plate, and then viable cells were assessed by water-soluble tetrazolium colorimetric assay. These cells were stimulated with 1.0 × 10³ IU/ml of IFNα for 4 days (left panel) or for 2 days (right panel).
Supplementary Figure 5 Knockdown of STAT1 by siRNA method continued for more than 20 days. Three HCC cell lines were transfected with siRNA for STAT1 and extracted at the indicated times. These cellular lysates were subjected to western blot analysis.
Supplementary Figure 6 Human IFNα strongly activates STAT1 in human cell lines but less activates in mouse liver. Activation of STAT1 as detected by western blot analysis. 5 × 10⁶ of PLC/PRF/5 cells were subcutaneously injected to Balb/c nude mice, and subcutaneous tumor and mouse liver were removed 10 days after transplantation. These mice were treated with 5 × 10⁴ IU/mouse of human IFNα 1 hour before sacrifice.
Supplementary Figure 7 IFNα has almost no effects on E-cadherin, collagen 1α, integrin β1, and selectin E in the absence of STAT1. Expression levels of these molecules as detected by real-time RT-PCR analysis. PLC/PRF/5 cells were transfected with control siRNA or siRNA for STAT1 and stimulated on the next day with 5.0 × 10³ IU/ml of IFNα for 3 hours or left untreated. The relative expression level of the untreated cells [IFNα (−), STAT1 (+)] was set as 1, and the fold expression level of each type of cell was calculated.
Supplementary Figure 8 Protein levels of VEGF were enhanced in suppressed pSTAT1 group, especially in tumor lesions. Tumor size-matched patients between control and suppressed pSTAT1 group were selected and their NT and T samples were subjected to western blot analysis. Representative data are presented.
Supplementary Table 1
Novelty & Impact Statements.
In this manuscript, we want to show two novel findings. First, IFNα-treated activation of JAK-STAT pathway causes inhibition of VEGF expression through interaction of the HIF-1 complex with STAT1. This is a newly discovered mechanism of IFNα. Second, IFNα therapy contributes to the harmful consequences when STAT1 expression is silenced or downregulated. In some cases conventional therapy should be replaced by the other therapies, such as bevacizumab, for patients with suppressed STAT1 activity in tumor.
Acknowledgements
We are grateful to Badarch Uranchimeg (National Cancer Institute) for providing us with the pGL2TkHRE plasmid. We also thank Wei Li for technical assistance. This work was supported in part by a Grant-in-Aid for Scientific Research from the Ministry of Education, Culture, Sports, Science, and Technology, Japan.
Abbreviations used in this paper
- STAT
Signal transducers and activators of transcription
- VEGF
vascular endothelial growth factor
- IFN
interferon
- HCC
hepatocellular carcinoma
- HRE
hypoxia responsive element
- HIF
hypoxia-inducible factor
- MMP
matrix metalloproteinase
- FGF
fibroblast growth factor
- IP
intraperitoneally
- T
HCC tumors
- NT
adjacent non-tumor tissue
- IRF
interferon regulatory factor
- TIMP
tissue inhibitor of metalloproteinase
- CoCl2
cobalt chloride
- JAK
Janus kinase
- TK
thymidine kinase
- Ip
Immunoprecipitation
- ChIP
Chromatin Immunoprecipitation
- HAS
hyaluronan synthase
- pSTAT
phosphorylated STAT
- CH
chronic hepatitis
- LC
liver cirrhosis
- simple
simple nodular type
- surr
simple nodule with surrounded proliferation
- multi
multiple nodular type
Footnotes
Potential conflict of interest; nothing to report
REFERENCES
- 1.Mise M, Arii S, Higashituji H, Furutani M, Niwano M, Harada T, Ishigami S, Toda Y, Nakayama H, Fukumoto M, Fujita J, Imamura M. Clinical significance of vascular endothelial growth factor and basic fibroblast growth factor gene expression in liver tumor. Hepatology. 1996;23(3):455–64. doi: 10.1053/jhep.1996.v23.pm0008617424. [DOI] [PubMed] [Google Scholar]
- 2.Poon RT, Ng IO, Lau C, Zhu LX, Yu WC, Lo CM, Fan ST, Wong J. Serum vascular endothelial growth factor predicts venous invasion in hepatocellular carcinoma: a prospective study. Ann Surg. 2001;233(2):227–35. doi: 10.1097/00000658-200102000-00012. [DOI] [PMC free article] [PubMed] [Google Scholar]
- 3.von Marschall Z, Scholz A, Cramer T, Schafer G, Schirner M, Oberg K, Wiedenmann B, Hocker M, Rosewicz S. Effects of interferon alpha on vascular endothelial growth factor gene transcription and tumor angiogenesis. J Natl Cancer Inst. 2003;95(6):437–48. doi: 10.1093/jnci/95.6.437. [DOI] [PubMed] [Google Scholar]
- 4.Qin H, Moellinger JD, Wells A, Windsor LJ, Sun Y, Benveniste EN. Transcriptional suppression of matrix metalloproteinase-2 gene expression in human astroglioma cells by TNF-alpha and IFN-gamma. J Immunol. 1998;161(12):6664–73. [PubMed] [Google Scholar]
- 5.Singh RK, Gutman M, Bucana CD, Sanchez R, Llansa N, Fidler IJ. Interferons alpha and beta down-regulate the expression of basic fibroblast growth factor in human carcinomas. Proc Natl Acad Sci U S A. 1995;92(10):4562–6. doi: 10.1073/pnas.92.10.4562. [DOI] [PMC free article] [PubMed] [Google Scholar]
- 6.Zhu ZZ, Di JZ, Gu WY, Cong WM, Gawron A, Wang Y, Zhenq Q, Wang AZ, Zhu G, Zhanq P, Hou L. Association of genetic polymorphisms in STAT1 gene with increased risk of hepatocellular carcinoma. Oncology. 2011;78(5-6):382–8. doi: 10.1159/000320521. [DOI] [PubMed] [Google Scholar]
- 7.Rapisarda A, Uranchimeg B, Scudiero DA, Selby M, Sausville EA, Shoemaker RH, Melillo G. Identification of small molecule inhibitors of hypoxia-inducible factor 1 transcriptional activation pathway. Cancer Res. 2002;62(15):4316–24. [PubMed] [Google Scholar]
- 8.Hosui A, Ohkawa K, Ishida H, Sato A, Nakanishi F, Ueda K, Takehara T, Kasahara A, Sasaki Y, Hori M, Hayashi N. Hepatitis C virus core protein differently regulates the JAK-STAT signaling pathway under interleukin-6 and interferon-gamma stimuli. J Biol Chem. 2003;278(31):28562–71. doi: 10.1074/jbc.M210485200. [DOI] [PubMed] [Google Scholar]
- 9.Shuai K, Horvath CM, Huang LH, Qureshi SA, Cowburn D, Darnell JE., Jr Interferon activation of the transcription factor Stat91 involves dimerization through SH2-phosphotyrosyl peptide interactions. Cell. 1994;76(5):821–8. doi: 10.1016/0092-8674(94)90357-3. [DOI] [PubMed] [Google Scholar]
- 10.Maxwell PH, Wiesener MS, Chang GW, Clifford SC, Vaux EC, Cockman ME, Wykoff CC, Pugh CW, Maher ER, Ratcliffe PJ. The tumour suppressor protein VHL targets hypoxia-inducible factors for oxygen-dependent proteolysis. Nature. 1999;399(6733):271–5. doi: 10.1038/20459. [DOI] [PubMed] [Google Scholar]
- 11.Melillo G, Musso T, Sica A, Taylor LS, Cox GW, Varesio L. A hypoxia-responsive element mediates a novel pathway of activation of the inducible nitric oxide synthase promoter. J Exp Med. 1995;182(6):1683–93. doi: 10.1084/jem.182.6.1683. [DOI] [PMC free article] [PubMed] [Google Scholar]
- 12.Yano H, Iemura A, Haramaki M, Ogasawara S, Takayama A, Akiba J, Kojiro M. Interferon alfa receptor expression and growth inhibition by interferon alfa in human liver cancer cell lines. Hepatology. 1999;29(6):1708–17. doi: 10.1002/hep.510290624. [DOI] [PubMed] [Google Scholar]
- 13.Dunn C, Brunetto M, Reynolds G, Christophides T, Kennedy PT, Lampertico P, Das A, Lopes AR, Borrow P, Williams K, Humphreys E, Afford S, et al. Cytokines induced during chronic hepatitis B virus infection promote a pathway for NK cell-mediated liver damage. J Exp Med. 2007;204(3):667–80. doi: 10.1084/jem.20061287. [DOI] [PMC free article] [PubMed] [Google Scholar]
- 14.Udabage L, Brownlee GR, Nilsson SK, Brown TJ. The over-expression of HAS2, Hyal-2 and CD44 is implicated in the invasiveness of breast cancer. Exp Cell Res. 2005;310(1):205–17. doi: 10.1016/j.yexcr.2005.07.026. [DOI] [PubMed] [Google Scholar]
- 15.Jung JE, Lee HG, Cho IH, Chung DH, Yoon SH, Yang YM, Lee JW, Choi S, Park JW, Ye SK, Chung MH. STAT3 is a potential modulator of HIF-1-mediated VEGF expression in human renal carcinoma cells. Faseb J. 2005;19(10):1296–8. doi: 10.1096/fj.04-3099fje. [DOI] [PubMed] [Google Scholar]
- 16.Schmitt M, Horbach A, Kubitz R, Frilling A, Haussinger D. Disruption of hepatocellular tight junctions by vascular endothelial growth factor (VEGF): a novel mechanism for tumor invasion. J Hepatol. 2004;41(2):274–83. doi: 10.1016/j.jhep.2004.04.035. [DOI] [PubMed] [Google Scholar]
- 17.Nagano H. Treatment of advanced hepatocellular carcinoma: intraarterial infusion chemotherapy combined with interferon. Oncology. 2010;78(Suppl 1):142–7. doi: 10.1159/000315243. [DOI] [PubMed] [Google Scholar]
- 18.Diaz BV, Lenoir MC, Ladoux A, Frelin C, Demarchez M, Michel S. Regulation of vascular endothelial growth factor expression in human keratinocytes by retinoids. J Biol Chem. 2000;275(1):642–50. doi: 10.1074/jbc.275.1.642. [DOI] [PubMed] [Google Scholar]
- 19.Hosui A, Hennighausen L. Genomic dissection of the cytokine-controlled STAT5 signaling network in liver. Physiol Genomics. 2008;34(2):135–43. doi: 10.1152/physiolgenomics.00048.2008. [DOI] [PMC free article] [PubMed] [Google Scholar]
- 20.Hosui A, Kimura A, Yamaji D, Zhu BM, Na R, Hennighausen L. Loss of STAT5 causes liver fibrosis and cancer development through increased TGF-{beta} and STAT3 activation. J Exp Med. 2009;206(4):819–31. doi: 10.1084/jem.20080003. [DOI] [PMC free article] [PubMed] [Google Scholar]
- 21.Cui Y, Hosui A, Sun R, Shen K, Gavrilova O, Chen W, Cam MC, Gao B, Robinson GW, Hennighausen L. Loss of signal transducer and activator of transcription 5 leads to hepatosteatosis and impaired liver regeneration. Hepatology. 2007;46(2):504–13. doi: 10.1002/hep.21713. [DOI] [PubMed] [Google Scholar]
- 22.Onitsuka A, Yamada N, Yasuda H, Miyata T, Kachi T. Rapid growth of hepatocellular carcinoma after or during interferon treatment of chronic hepatitis C: report of three cases. Surg Today. 1996;26(2):126–30. doi: 10.1007/BF00311777. [DOI] [PubMed] [Google Scholar]
Associated Data
This section collects any data citations, data availability statements, or supplementary materials included in this article.
Supplementary Materials
Supplementary Figure 1 Huh7 and HepG2 cells have the same tendencies as the case with PLC/PRF/5 cells. Expression levels as detected by real-time RT-PCR analysis. Huh7 and HepG2 cells were treated with 100 μM CoCl2 and/or 1.0 × 10³ IU/ml of IFNα for 24 hours. Asterisks indicate significant differences (*1, P<.001, *2, P<.01).
Supplementary Figure 2 The inhibitory effect of IFNα on VEGF expression was seen in low O2 condition. Activation of STAT1 and expression of HIF-1α, STAT1, and VEGF as detected by western blot analysis. PLC/PRF/5 cells were treated with 1.0 × 10⁴ IU/ml of IFNα and incubated in 1% O2 concentration for 24 hours.
Supplementary Figure 3 IFNγ suppressed VEGF expression through inhibiting HRE-promoter activity. (a) (b) Expression levels as detected by real-time RT-PCR analysis. Cells were treated with 100 μM CoCl2 and/or 100 ng/ml of IFNγ for 24 hours. (c) Activation of STAT1 and expression of VEGF as detected by western blot analysis. PLC/PRF/5 cells were transfected with control siRNA or siRNA for STAT1 and subjected to each stimulation for 24 hours. (d) Expression levels of HIF-1α and hydroxylated-HIF-1α as detected by western blot analysis. (e) Cells were cotransfected of the pGL2TkHRE plasmid or the pGL2Tk plasmid with the pRLtK plasmid. The cells were then stimulated with 100 mM of CoCl2 units/ml and/or 100 ng/ml of IFNγ, or left unstimulated, and subjected to dual luciferase assay. The relative light unit of the unstimulated sample was considered as 1 and the data were expressed as mean ± S.D. Lower panel shows expression levels of STAT1 as detected by western blot analysis. Asterisks indicate significant differences (*1, P<.001, *2, P<.01, *3, P<.05).
Supplementary Figure 4 Cellular proliferation in IFNα-treated cells. PLC/PRF/5 cells were transfected with siRNA for STAT1 or control, and seeded on a 96-well culture plate, and then viable cells were assessed by water-soluble tetrazolium colorimetric assay. These cells were stimulated with 1.0 × 10³ IU/ml of IFNα for 4 days (left panel) or for 2 days (right panel).
Supplementary Figure 5 Knockdown of STAT1 by siRNA method continued for more than 20 days. Three HCC cell lines were transfected with siRNA for STAT1 and extracted at the indicated times. These cellular lysates were subjected to western blot analysis.
Supplementary Figure 6 Human IFNα strongly activates STAT1 in human cell lines but less activates in mouse liver. Activation of STAT1 as detected by western blot analysis. 5 × 10⁶ of PLC/PRF/5 cells were subcutaneously injected to Balb/c nude mice, and subcutaneous tumor and mouse liver were removed 10 days after transplantation. These mice were treated with 5 × 10⁴ IU/mouse of human IFNα 1 hour before sacrifice.
Supplementary Figure 7 IFNα has almost no effects on E-cadherin, collagen 1α, integrin β1, and selectin E in the absence of STAT1. Expression levels of these molecules as detected by real-time RT-PCR analysis. PLC/PRF/5 cells were transfected with control siRNA or siRNA for STAT1 and stimulated on the next day with 5.0 × 10³ IU/ml of IFNα for 3 hours or left untreated. The relative expression level of the untreated cells [IFNα (−), STAT1 (+)] was set as 1, and the fold expression level of each type of cell was calculated.
Supplementary Figure 8 Protein levels of VEGF were enhanced in suppressed pSTAT1 group, especially in tumor lesions. Tumor size-matched patients between control and suppressed pSTAT1 group were selected and their NT and T samples were subjected to western blot analysis. Representative data are presented.
Supplementary Table 1


