

Abstract
Purpose.
We describe infrared regional pupillometry as an objective comparative assessment of midperipheral to central retinal sensitivity and to correlate with midperipheral retinal ischemia in diabetic subjects.
Methods.
We tested 12 normal and 17 diabetic subjects using bilateral infrared pupillometry. The diabetic cohort included seven subjects without, five with mild, three with moderate, and two with severe non-proliferative diabetic retinopathy (NPDR). Central and annular stimuli of varying intensity were presented to one eye, and pupillary amplitude and constriction velocity were measured from both eyes. Light stimulus of increasing intensity was presented as 20 consecutive trials (stimulus duration of 300 ms with 3000 ms intervals). The ratio of central to peripheral responses (Q values) was calculated for each stimulus configuration. Average responses with respect to the stimulus strength were regressed with Gompertz sigmoid function.
Results.
Control and moderate/severe NPDR cases comparison showed statistically significant differences in amplitude (QA) and constriction velocity (QCV) (Wilcoxon rank sum test P = 0.002, respectively). Age difference for these groups was not statistically significant (Wilcoxon rank sum test P = 0.15). The comparison of control and diabetic subjects without NPDR/mild NPDR was statistically significant for QA and QCV (Wilcoxon rank sum test P = 0.0002 and P = 0.001, respectively). QA and QCV differences were statistically significant between moderate/severe NPDR cases and subjects without or mild NPDR cases (Wilcoxon rank sum test P = 0.013).
Conclusions.
QA and QCV values correlated highly with the severity of diabetic retinopathy, but not with the duration of diabetes. ( ClinicalTrials.gov number, NCT01546766.)
We describe a novel methodology based on the pupillary response to evaluate midperipheral and central retinal sensitivity. In diabetic subjects, the ratios of peripheral to central amplitude and constriction velocity of the pupillary response are reduced, correlating with severity of retinopathy.
Introduction
The current culture and dietary habits in developed nations are contributing to a surge in adult and pediatric obesity, and a significant rise in the prevalence of diabetes.1–3 Diabetes mellitus (DM) is the leading cause of blindness among working age Americans. The 2007 report from the American Diabetes Association disclosed the existence of an estimated 24 million individuals with diabetes in the United States, 28% of whom were undiagnosed.4 In January 2011, the Center for Disease Control and Prevention (CDC) released estimates that one in three US adults could have diabetes by the year 2050.
Diabetes mellitus can trigger non-proliferative (NPDR) and proliferative diabetic retinopathy, macular edema, vitreous hemorrhage, neovascular glaucoma, retinal detachment and blindness. Zhang et al. analyzed the National Health and Nutrition Examination Surveys (NHANES) data from 2005 to 2008, and reported that the estimated prevalence of diabetic retinopathy and vision-threatening diabetic retinopathy was 28.5% and 4.4%, respectively, among individuals with diabetes aged 40 years and older.5 It is estimated that the number of Americans aged 40 years or older with diabetic retinopathy could reach 16 million by 2050.6
A retrospective clinical study by Oliver and Schwartz described the angiographic findings of diabetic retinopathy in a cohort of 143 patients.7 Late peripheral vascular leakage and peripheral capillary nonperfusion were identified in 41% and 54% of the patients, respectively. In addition to angiographic and fundus changes,8,9 loss of midperipheral visual sensitivity using visual fields also has been reported.10
Early detection of diabetic retinopathy and timely treatment are the keys to the prevention of severe vision loss. We describe a novel methodology based on the pupillary response to evaluate midperipheral compared to central retinal sensitivity. We report that when comparing diabetic to control subjects, the pupillary response ratios of peripheral to central amplitude and constriction velocity are reduced, and correlated with the severity of retinopathy.
Materials and Methods
The study was conducted in accordance with the tenets of the Declaration of Helsinki and received approval from the Institutional Review Board at the University of California. Informed consent was obtained from all the research subjects.
We selected research subjects older than 18 years and capable of understanding informed consent, with no history of prior ocular trauma or surgery in the tested eye. Research subjects who did not have any ocular disease or diabetes and had a history of a normal eye examination within one year before participation in this study served as controls. Subjects with glaucoma and high myopia (more than 10 diopters) specifically were excluded. The selection of diabetic subjects was based on the severity definitions of diabetic retinopathy in the Early Treatment of Diabetic Retinopathy Study (ETDRS) report.11 Diabetic subjects also were included if they had laser (panretinal photocoagulation) in one eye or macular focal laser in both eyes. Visual acuities had to be 20/60 or better in at least one eye. Subjects had to be willing to tolerate the placement of a set of goggles on their face.
Pupillometer Device
An infrared (IR) pupillometer with a liquid crystal display (LCD) stimulus screen (developed by Neuro Kinetics Inc., Pittsburgh, PA) was used to present the central and peripheral light stimuli to one eye, while simultaneously recording and digitizing the responses from both eyes (Fig. 1, pupillometer device and functional diagram).
Figure 1. .

Pupillometer device and pupillometer functional diagram.
A dual monitor desktop computer system (Dell Corporation, Round Rock, TX; Acer America Corporation, San Jose, CA) controlled the pattern displayed on the LCD stimulus screen and also provided the user interface for the operator on a second monitor. The subjects were instructed to position both eyes in front of the goggle frame, where the dual-channel IR cameras (Firefly; Point Grey Research Inc., Richmond, BC, Canada) were installed to track pupillary changes. One eye viewed an LCD screen onto which visual stimuli were presented; the other eye was blocked by an occluder built in the frame. The goggle frame completely excluded ambient room illumination. Trial lenses were installed for astigmatism and near vision correction.
IR light was used to track the pupillary reflex in both eyes, while visible light was the stimulus to central and midperipheral retina. The IR cameras recorded pupillary diameters at a sampling rate of 60 frames per second with an accuracy of ±0.5%.
IR illumination was provided by two micro light-emitting diode (LEDs) (High Power Infrared Emitting Diode, 940 nm; Vishay Americas, Shelton, CT) operating at 940 nm for each camera. These LEDs were installed inside the goggle frame between the eye and lens holder. A dielectric mirror was installed inside the frame for each camera that reflected IR light above 800 nm while allowing visible light to pass through.
Stimulus
The stimulus module consisted of either a circular or annular region of white light designed to stimulate either the central or peripheral sections of the retina, respectively. A small fixation point was centered within the display. The central circular target subtended a visual angle of 10°. The annular pattern extended from 30° to 60° visual angle (see protocol summary: Supplementary File S1 [see Supplementary Material and Supplementary File S1, http://www.iovs.org/content/54/1/9/suppl/DC1]). In the current prototype system, stimulus strength was defined as the average luminance of the LCD screen within the stimulus area. A calibration curve was determined, relating units of stimulus brightness with measurements of luminance (in cd/m2). Measurements were made from 0% to 100% of the maximum output of the LCD screen. All light measures were obtained using a Gigahertz-Optik X1 optometer with an LDM-9901 sensor (Gigahertz-Optik GmbH, Türkenfeld, Germany). For 28 subjects, the testing range was 10% to 60% of screen brightness (1.5–50 cd/m2) in 6 steps, with 10% increments. One subject (D0012) required an increase in the stimulus brightness to 100% (195 cd/m2) because of a minimal pupillary response.
Our choice of brightness increments was determined empirically, and was designed to span the dynamic range of the pupillary response and avoid saturation (see comparison graphic of screen brightness versus luminance and calibration curve table in Supplementary File S2 [see Supplementary Material and Supplementary File S2, http://www.iovs.org/content/54/1/9/suppl/DC1]). The total testing time for any single session for both eyes was less than 45 minutes.
Parameters and Data Analysis
Pupillometry tracings used for analysis were obtained from the stimulated eye and the contralateral eye. Six parameters were determined automatically as functions of light stimuli brightness (Fig. 2, static and dynamic pupillary measurements): Initial pupillary diameter (peak), in pixels; latency, defined as the time from activation of the light stimulus to the initial constriction, in seconds; minimum pupillary diameter (valley), in pixels; amplitude of the pupillary response, defined as the difference between the peak and valley; the maximum constriction velocity in pixels/s (measured during pupil constriction phase); and maximum redilation velocity measured in pixels/s and represented as the initial recovery of the pupil.
Figure 2. .

Static and dynamic pupillary measurements.
Response parameters were determined for each eye of each subject using the central and annular stimuli. Average values for amplitude, constriction velocity, and latency were determined for each set of 20 repeated stimuli (extreme or indeterminate values were excluded). These average parameters then were regressed individually with a Gompertz sigmoid function to derive separate functions for the central stimulus and the peripheral stimulus for each eye. Regression formulas were used, rather than individual values, to minimize point-to-point variances and to provide a balanced weighting of responses over the dynamic range of testing. For each set of parameters we calculated a Q value that reflected the relative difference of the pupillary responses for a given eye over the range of stimuli between the peripheral (annular) and central stimuli:
 |
where Pp = parameter for peripheral stimulus and Pc = parameter for central stimulus.
The parameter for the central stimulus was considered the reference point based on our hypothesis that the central retinal sensitivity is preserved preferentially in a diabetic compared to the changes in midperipheral retinal sensitivity that would be reflective of retinal ischemia secondary to diabetic retinopathy.
After data acquisition was completed, the responses were inspected visually for quality. Aberrant responses due to blinking or other artifacts were removed using amplitude and iterational velocity threshold filters to select appropriate waveforms for analysis. The software automatically determined the key parameters (peak, valley, maximum constriction velocity, maximum redilation velocity, amplitude, and latency) for each stimulus–response pair and then fitted the stimulus–response data to a Gompertz sigmoid function. The stimulus range for comparisons of the central and peripheral stimuli was selected manually to be 10% to 60% of the maximal possible stimulus intensities and the Q value over that range was calculated. The parameters were estimated computationally as follows:
Q value for Amplitude (QA):
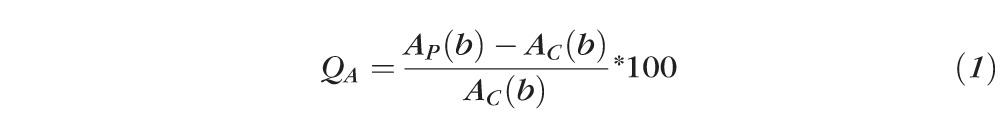 |
Q value for Maximum constriction velocity (QCV):
 |
Q value for Latency (QL):
 |
Where AP(b), CVP(b), LP(b), and AC(b), CVC(b), LC(b) are Gompertz regression functions for measured parameters of amplitude (A), constriction velocity (CV), and latency (L) respectively, as a function of peripheral (P) and central (C) stimuli brightness (b), respectively.
Results
We enrolled 12 control subjects and 17 subjects diagnosed with DM at two study sites (Jules Stein Eye Institute, David Geffen School of Medicine at the University of California in Los Angeles [UCLA], Los Angeles, CA, and Neuro Kinetics Inc., Pittsburgh, PA). The subjects underwent comparative regional pupillometry as described above. We chose arbitrarily to stimulate the right eye and analyze the pupillary responses of the left eye in 24 subjects; in 5 subjects we did stimulate and analyze pupillary responses for the same eye (2 subjects for right eye and 3 subjects for left eye). Three diabetic subjects had type I DM and 14 had type II DM. A total of 16 diabetic subjects enrolled at UCLA underwent a complete eye examination with fundus photography. Fluorescein angiography was performed on those subjects classified with moderate-to-severe diabetic retinopathy. One diabetic subject was enrolled at the Neurokinetics site, and we gathered eye records and fundus photography from the local retina specialist. Demographic data for the entire cohort of subjects are shown in Table 1.
Table 1. .
Demographic Data for the Entire Cohort
|
N
Subjects |
Group |
Years of DM* Mean ± SD |
Age† Mean, y ± SD |
Sex Female/Male |
Race‡ |
Ethnicity Hispanic or Latino |
| 12 | Control | No evidence of DM | 54 ± 18 | 6/6 | 0-3-0-0-9 | 0 |
| 7 | Diabetic subjects without NPDR | 12 ± 13 | 57 ± 8 | 5/2 | 0-2-0-0-5 | 2 |
| 5 | Diabetic subjects with mild NPDR | 13 ± 5 | 54 ± 21 | 1/4 | 0-0-0-0-5 | 3 |
| 3 | Diabetic subjects with moderate NPDR | 27 ± 22 | 69 ± 5 | 1/2 | 0-1-0-0-2 | 1 |
| 2 | Diabetic subjects with severe NPDR | 21 ± 2 | 63 ± 2 | 1/1 | 0-0-0-0-2 | 1 |
Self-reported duration of DM.
Age at the time of initial evaluation.
The series of values refer to the number of subjects who were American Indian or Alaskan native, Asian, Black or African American, native Hawaiian or Pacific Islander, and White, respectively.
Ophthalmologic information for the entire cohort is described in Supplementary File S3 (see Supplementary Material and Supplementary File S3, http://www.iovs.org/content/54/1/9/suppl/DC1).
Changes in Responses with Respect to Age in Control Subjects
Q-Constriction Velocity (QCV) and Q-Amplitude (QA) values are shown in Figures 3 and 4, respectively. Even with a limited number of control subjects, we observed an age-dependent decline in the relative sensitivity of the peripheral to central retinal responses as indexed by constriction velocity (Fig. 3) and amplitude (Fig. 4). Although both parameters were correlated significantly with age, the latter accounted for a greater proportion of the variability in amplitude than in constriction velocity (0.65 vs. 0.29, respectively). These changes are not a reflection of changes in the pupil size or iris contractility, since these parameters are derived from the relative comparisons that are being made within a particular eye. However, such changes are consistent with reports of age-dependent loss of retinal sensitivity that have been documented with static automated perimetry.12–14
Figure 3. .

Q-Constriction velocity values versus age in control subjects.
Figure 4. .

Q-Amplitude values versus age in control subjects.
Serial Testing and Response Consistency
We retested 7 diabetic and 4 control subjects with a 28- to 45-month time interval between testing sessions. The diabetic cohort included 5 subjects without NPDR and 2 subjects with mild NPDR (See Table in Supplementary File S4: QA and QCV values: Summary of data for subjects undergoing test and retest studies [see Supplementary Material and Supplementary File S4, http://www.iovs.org/content/54/1/9/suppl/DC1]).
The results for QA and QCV velocity are shown in Figures 5 and 6, respectively. In these figures, each data point represents a different subject and the number in parentheses is the time interval between testing. In general, there was remarkable consistency over periods of time except for 2 diabetic subjects (D0006 and D0008) with mild NPDR. D0006 and D0008 had responses in the subnormal range and showed a decline in their retest 29 months later (identified with triangle icons [Δ] in Figs. 5, 6). Both participants had a history of heart disease. For subject D0006, a fluorescein angiogram done at the time of the second testing showed significant diabetic retinopathy in the midperiphery that was more severe than suggested by the 7-field ETDRS photos (See Supplementary File S5: Panoramic Optos fundus photography of the left eye, subject D0006 [see Supplementary Material and Supplementary File S5, http://www.iovs.org/content/54/1/9/suppl/DC1]). We overlaid the corresponding midperipheral fluorescein angiography area to the color image to show that there was more diabetic retinopathy than what could be perceived with the color images. The “color” macular image showed minimal diabetic retinopathy, while the fluorescein angiogram (shown for the area that is nasal to the disc) showed moderate numbers of microaneurysms, small patches of vascular leakage, and incipient areas of midperipheral retinal ischemia. The degree of midperipheral ischemia observed with the Optos angiogram was consistent with the lower QA and QCV scores detected by the pupillometry.
Figure 5. .

Q-Amplitude values for test versus re-test.
Figure 6. .

Q-Constriction velocity values for test versus re-test.
Relative Pupillary Responses with Respect to Diabetic Retinopathy
Supplementary File S6 (see Supplementary Material and Supplementary File S6, http://www.iovs.org/content/54/1/9/suppl/DC1) shows the amplitude Q-value (QA), constriction velocity Q-value (QCV), age, duration of diabetes for DM subjects, and information about which eye was stimulated and analyzed for the entire cohort. None of our research subjects had unstable fixation.
Table 2 provides descriptive statistics of the control group (N = 12), the combination of subjects without (N = 7) and with mild (N = 5) NPDR, and the combination of subjects with moderate (N = 3) and severe (N = 2) NPDR. Comparisons between the control group (N = 12) and moderate/severe NPDR cases (N = 5) revealed statistically significant differences in QA (Wilcoxon rank sum test P = 0.002) and QCV (Wilcoxon rank sum test P = 0.002). Although moderate and severe NPDR cases were older than the control group, the difference was not statistically significant (Wilcoxon rank sum test P = 0.15). To control for an age effect, we examined further the differences among subjects who were older than 60 years, and the differences remained statistically significant despite the smaller sample size with an older age (74.0 ± 6.2 years) in the control group (N = 4): QA (Wilcoxon rank sum test P = 0.020) and QCV (Wilcoxon rank sum test P = 0.020). There were statistically significant differences in QA (Wilcoxon rank sum test P = 0.0002) and QCV (Wilcoxon rank sum test P = 0.001) between the control group (N = 12) and subjects without NPDR (N = 7)/mild NPDR (N = 5), although there was no statistically significant difference in age (Wilcoxon rank sum test P = 0.71). There also were statistically significant differences in QA (Wilcoxon rank sum test P = 0.013) and QCV (Wilcoxon rank sum test P = 0.013) between moderate and severe NPDR subjects (N = 5) and subjects without/mild NPDR (N = 12).
Table 2. .
Descriptive Statistics of QA and QCV for the Control Group and Combinations of Study Participants
|
Study Group/N |
Variable |
Mean |
SD |
Median |
Minimum |
Maximum |
| Control, Total: 12 | QA | 26.8 | 8.3 | 28.7 | 12.7 | 36.5 |
| QCV | 24.7 | 8.1 | 24.2 | 9.9 | 35.7 | |
| Age, y | 54.1 | 18.1 | 54.5 | 20 | 83 | |
| Y of DM* | 0 | |||||
| Diabetics without NPDR (N = 7) and with mild NPDR (N = 5), Total: 12 | QA | 2.1 | 15.7 | 1.1 | −18.8 | 33.6 |
| QCV | 5.9 | 14.6 | 6.8 | −13.6 | 40.5 | |
| Age | 56 | 13.9 | 57 | 19 | 71 | |
| Y of DM* | 12.4 | 10.1 | 9.5 | 1.5 | 31 | |
| Diabetics with moderate NPDR (N = 3) and severe NPDR (N = 2), Total: 5 | QA | −18.2 | 10.3 | −21.1 | −27.1 | −0.3 |
| QCV | −13.1 | 7.8 | −13.1 | −21.4 | −0.7 | |
| Age | 67 | 4.9 | 65 | 62 | 74 | |
| Y of DM* | 25 | 15.9 | 20 | 10 | 52 |
Self-reported duration of DM.
Table 3 shows the summary statistics of duration of diabetes (in years) by severity of NPDR. The Spearman correlation coefficient relating the two sets of observations was 0.47 (P = 0.057) despite the small sample size.
Table 3. .
Summary Statistics of Duration of Diabetes and Severity of NPDR
|
Group |
N
Subjects |
Mean, Years of DM |
SD |
Median |
Minimum |
Maximum |
| Diabetics without NPDR | 7 | 11.9 | 13 | 4 | 1.5 | 31 |
| Diabetics with mild NPDR | 5 | 13 | 5.5 | 10 | 8 | 19 |
| Diabetics with moderate NPDR | 3 | 27.3 | 21.9 | 20 | 10 | 52 |
| Diabetics with severe NPDR | 2 | 21.5 | 2.1 | 21.5 | 20 | 23 |
Table 4 shows the correlation (Spearman correlation coefficient) between QA/QCV and duration of diabetes/severity of NPDR among 17 diabetic cases. There were statistically significant correlations with severity of diabetic retinopathy for QA and QCV, but the correlations with the duration of diabetes were not statistically significant.
Table 4. .
Spearman Correlation Coefficient between QA/QCV and Duration of Diabetes/Severity of NPDR among 17 Diabetic Cases
|
Variable |
QA Values |
QCV |
| Duration of diabetes, y | r = 0.40123 | r = 0.32123 |
| P = 0.1104 | P = 0.2087 | |
| NPDR group | r = 0.79929 | r = 0.80574 |
| P = 0.0001 | P < 0.0001 |
Figure 7 also shows that QA and QCV measurements were highly correlated with the severity of diabetic retinopathy.
Figure 7. .

Q-Amplitude versus Q-Constriction velocity for all groups.
While some mild or minimal NPDR subjects had near normal average Q-values, all of our moderate and severe NPDR cases were beyond three SDs of the values for the normal subjects. The measurements of QA and QCV per condition also are shown in Figure 8 based on the clinical severity of NPDR. There were two diabetic subjects without NPDR with Q values that were significantly different from the rest of that group for QA and QCV (Fig. 8, group 2 and Supplementary File S6 for respective QA and QCV values [see Supplementary Material and Supplementary File S6, http://www.iovs.org/content/54/1/9/suppl/DC1]). Subject D0018 was a 56-year-old woman with a 3-year history of diabetes. Subject D0009 was a 47-year-old woman with a 1.5-year history of diabetes and nodular enlargement of the thyroid gland.
Figure 8. .

Q-Amplitude and Q-Constriction velocity versus diabetic condition (NPDR).
All the moderate and severe NPDR subjects had evidence or histories of prior retinal laser (a total of five participants). Four participants had focal macular laser treatment in both eyes. One participant (D0013) had superotemporal sectorial laser photocoagulation in the right eye due to a branch retinal vein occlusion (BRVO) that involved the central macula and extended into the midperiphery, while her left eye had not received any prior laser. Her central visual acuity in the right eye was counting fingers and she had normal visual acuity (20/25) in the left eye. We tested both eyes, but with the intention of only using the data from the left eye that had diabetic retinopathy in the absence of other vascular damage. As expected, when the right eye was stimulated, central and peripheral responses from that eye were low due to the extensive retinal damage from the BRVO. However, the pupillary responses from stimulation of the left eye were consistent for a person with moderate NPDR. Since almost all the moderate and severe cases had bilateral focal macular laser, we could not make any meaningful comparisons of the effects of macular laser photocoagulation on the central response with respect to an untreated eye with comparable diabetic retinopathy.
Discussion
Early detection of diabetic retinopathy and timely treatment are the keys to the prevention of severe vision loss. The clinical guidelines based on the Wisconsin Epidemiologic Study of Diabetic Retinopathy are an initial eye examination 3 to 5 years after diagnosis for type I DM patients, and at time of diagnosis for type II DM patients.15,16 Diabetic patients should be followed with yearly examinations.11,16 The basic objective for noninvasive imaging for diabetic retinopathy is to develop new technology for widespread screening of diabetics to identify those who may require immediate intervention.
In our study, we tested the hypothesis that the pupillary response can be used as a biosensor for intraocular comparative peripheral and central retinal sensitivity. Pupillary constriction velocity and amplitude values were highly correlated with the severity of NPDR with clear discrimination of these subjects from normal controls.
Though the number of subjects that underwent test and retest studies was small, our data indicated that we can obtain reliable and consistent pupillary responses over a range of light stimuli that are well within a safe and comfortable range for subjects. The preliminary results showed good repeatability, and the two cases in which diabetics, without clinically evident diabetic retinopathy, showed a decline in function during a 29-month interval (D0006 and D0008) suggested that we may be able to monitor diabetics longitudinally for changing retinal function during a presymptomatic state using this novel methodology. As expected from the static automated perimetry literature,12–14 we also observed an age-dependent decline in the relative responsiveness of the peripheral retina (with respect to the central 10° of retina).
Response parameters obtained for diabetic subjects with mild, moderate, and severe NPDR were significantly different from those obtained from control subjects.
Some subjects without clinical retinopathy had responses that did overlap those of the control subjects, as well as those of the individuals with mild NPDR (Figs. 7, 8). This is not surprising because diabetic retinopathy (as detected by the ETDRS 7 fields) does not always correlate necessarily with midperipheral retinal ischemia. One also must consider the possibility that the differences in peripheral retinal sensitivity seen in the asymptomatic and mild diabetics also may represent neuronal dysfunction from the diabetes.
We automated nearly all of the analytical steps of this method aiming toward the next generation of pupillometer instrumentation in which a patient could receive a result at the conclusion of the test. Such immediate feedback would aid in patient adherence to follow-up treatment.
Like all screening methods, there undoubtedly will be individuals for whom pupillometry will be problematic. Fortunately we can use responses from either eye to measure the relative sensitivities of a given eye, depending on which pupil is more responsive or better imaged. Thus, even a person with a significant afferent pupillary defect could have screening performed for both eyes. With our current technology, individuals with heavy pigmentation on their eyelids can confound the image detection algorithm of the system unless there is operator intervention and adjustment. However, improvements in alignment and settings should minimize this issue.
Patients with extensive panretinal photocoagulation are expected to have lower peripheral responses, but they also would have lower responses due to the underlying disease that was treated with laser. However, reduced sensitivity of the central macula would tend to reduce the relative differences between the peripheral and centrally driven pupillary responses.
A Phase II study with 200 participants currently is being conducted with a much shorter screening test (16–20 minutes). Because the method uses the complete integrity of the afferent and efferent pathways of the light-mediated pupillary response, we expect that most subjects who fail to yield interpretable responses with this device are likely to have some demonstrable eye or vision-related pathology that warrants further evaluation.
Supplementary Material
Footnotes
Supported by National Institutes of Health, Small Business Innovation Research 5R44EY018025-03, Research to Prevent Blindness, and Harold and Pauline Price Foundation.
Disclosure: M.C. Ortube, None; A. Kiderman, Neuro Kinetics, Inc. (F, I, E); Y. Eydelman, Neuro Kinetics, Inc. (E); F. Yu, None; N. Aguilar, None; S. Nusinowitz, None; M.B. Gorin, P
References
- 1. Lee JM, Davis MM, Menon RK, Freed GL. Geographic distribution of childhood diabetes and obesity relative to the supply of pediatric endocrinologists in the United States. J Pediatr. 2008; 152: 331–336 [DOI] [PubMed] [Google Scholar]
- 2. Tanne JH. Americans are living longer, but obesity and diabetes are rising. BMJ. 2011; 342:d1143 [DOI] [PubMed] [Google Scholar]
- 3. Dea TL. Pediatric obesity & type 2 diabetes. MCN Am J Matern Child Nurs. 2011; 36: 42–48 [DOI] [PubMed] [Google Scholar]
- 4. American Diabetes Association Economic costs of diabetes in the U.S. in 2007. Diabetes Care. 2008; 31: 596–615 [DOI] [PubMed] [Google Scholar]
- 5. Zhang X, Saaddine JB, Chou CF, et al. Prevalence of diabetic retinopathy in the United States, 2005–2008. JAMA. 2010; 304: 649–656 [DOI] [PMC free article] [PubMed] [Google Scholar]
- 6. Center for Disease Control and Prevention (CDC) Preserving vision in patients with diabetes. 2012. Available at http://www.cdc.gov/diabetes/news/docs/vision_video.htm [Google Scholar]
- 7. Oliver SC, Schwartz SD. Peripheral vessel leakage (PVL): a new angiographic finding in diabetic retinopathy identified with ultra wide-field fluorescein angiography. Semin Ophthalmol. 2010; 25: 27–33 [DOI] [PubMed] [Google Scholar]
- 8. Niki T, Muraoka K, Shimizu K. Distribution of capillary nonperfusion in early-stage diabetic retinopathy. Ophthalmology. 1984; 91: 1431–1439 [DOI] [PubMed] [Google Scholar]
- 9. Shimizu K, Kobayashi Y, Muraoka K. Midperipheral fundus involvement in diabetic retinopathy. Ophthalmology. 1981; 88: 601–612 [DOI] [PubMed] [Google Scholar]
- 10. Sampson GP, Shahidi AM, Vagenas D, et al. Visual sensitivity loss in the central 30° of visual field is associated with diabetic peripheral neuropathy. Diabetologia 2012; 55: 1179–1185 [DOI] [PubMed] [Google Scholar]
- 11. Fundus photographic risk factors for progression of diabetic retinopathy ETDRS report number 12. Early Treatment Diabetic Retinopathy Study Research Group. Ophthalmology. 1991; 98 (5 Suppl): 823–833 [PubMed] [Google Scholar]
- 12. Spry PG, Johnson CA. Senescent changes of the normal visual field: an age-old problem. Optom Vis Sci. 2001; 78: 436–441 [DOI] [PubMed] [Google Scholar]
- 13. Johnson CA, Adams AJ, Lewis RA. Evidence for a neural basis of age-related visual field loss in normal observers. Invest Ophthalmol Vis Sci. 1989; 30: 2056–2064 [PubMed] [Google Scholar]
- 14. Jaffe GJ, Alvarado JA, Juster RP. Age-related changes of the normal visual field. Arch Ophthalmol. 1986; 104: 1021–1025 [DOI] [PubMed] [Google Scholar]
- 15. Klein R, Klein BE, Moss SE, et al. The Wisconsin Epidemiologic Study of Diabetic Retinopathy. II. Prevalence and risk of diabetic retinopathy when age at diagnosis is less than 30 years. Arch Ophthalmol. 1984; 102: 520–526 [DOI] [PubMed] [Google Scholar]
- 16. Klein R, Klein BE, Moss SE, et al. The Wisconsin Epidemiologic Study of Diabetic Retinopathy. III. Prevalence and risk of diabetic retinopathy when age at diagnosis is 30 or more years. Arch Ophthalmol. 1984; 102: 527–532 [DOI] [PubMed] [Google Scholar]
Associated Data
This section collects any data citations, data availability statements, or supplementary materials included in this article.