

Abstract
Each year, influenza viruses cause epidemics by evading pre-existing humoral immunity through mutations in the major glycoproteins: the haemagglutinin (HA) and the neuraminidase (NA). In 2004, the antigenic evolution of HA of human influenza A (H3N2) viruses was mapped (Smith et al., Science 305, 371–376, 2004) from its introduction in humans in 1968 until 2003. The current study focused on the genetic evolution of NA and compared it with HA using the dataset of Smith and colleagues, updated to the epidemic of the 2009/2010 season. Phylogenetic trees and genetic maps were constructed to visualize the genetic evolution of NA and HA. The results revealed multiple reassortment events over the years. Overall rates of evolutionary change were lower for NA than for HA1 at the nucleotide level. Selection pressures were estimated, revealing an abundance of negatively selected sites and sparse positively selected sites. The differences found between the evolution of NA and HA1 warrant further analysis of the evolution of NA at the phenotypic level, as has been done previously for HA.
Introduction
Influenza epidemics affect approximately 5–15 % of the world population, resulting in an estimated 3–5 million hospitalizations and between 250 000 and 500 000 deaths annually (Stöhr, 2002; WHO, 2003). Influenza type A viruses can be divided into subtypes based on the antigenic properties of the major surface glycoproteins, haemagglutinin (HA) and neuraminidase (NA). To date, 17 HA (Fouchier et al., 2005; Tong et al., 2012) and nine NA (Schild et al., 1980) subtypes have been found in nature. Subtypes A (H1N1) and A (H3N2) are currently the causative agents of influenza A virus epidemics in humans, of which the influenza A (H3N2) viruses are the most recurring and virulent (Barr et al., 2010; Taubenberger & Morens, 2006) and show the strongest antigenic drift (Rambaut et al., 2008).
HA, a homotrimeric type I integral membrane protein, mediates viral entry into the cell by binding to sialic acids (Sauter et al., 1989). NA, a tetrameric type II integral membrane protein with sialidase activity, allows virus release from the cell (Liu et al., 1995; Palese & Compans, 1976; Palese et al., 1974). Both HA and NA are located on the surface of the viral membrane and are the main targets for antibodies. Antibodies against influenza viruses result in protective immunity, but mutations in HA and NA allow the virus to escape host immunity. This process, known as antigenic drift (Schild et al., 1974), is responsible for the recurrence of influenza epidemics almost every winter.
Vaccines have proven effective but need to be updated frequently due to antigenic drift. Since 1999, the influenza A (H3N2) virus component has been updated six times (Barr et al., 2010). Thorough surveillance by the National Influenza Centers and WHO Collaborating Centers within the World Health Organization’s Global Influenza Surveillance Network is required to identify the most suitable strains to use in vaccines for the next epidemic (Barr et al., 2010; Russell et al., 2008). Vaccine strain selection depends on three aspects: epidemiological information, HA and NA gene sequence phylogeny and serological analysis using an HA inhibition assay. The main focus of genetic and antigenic surveillance is on HA, and official influenza vaccine formulations prescribe the amount of HA (Fiore et al., 2010).
Although antibodies against NA do not prevent infection, numerous pre-clinical and clinical studies indicate a role of NA immunity in reducing the severity of influenza virus infection (Brett & Johansson, 2005; Couch et al., 1974; Johansson et al., 1993; Kilbourne, 1976; Murphy et al., 1972; Schulman et al., 1968). Early crystallographic studies of NA have shown that antigenic regions surround the enzyme’s highly conserved active site (Colman et al., 1983, 1987). Antigenic sites A, B and C (Air et al., 1985) have been shown to be highly variable, probably due to antigenic drift (Laver et al., 1982; Luther et al., 1984). Studies comparing the antigenic drift of HA and NA using limited numbers of viruses have revealed that their evolution differs and is often asynchronous (Kilbourne et al., 1990; Sandbulte et al., 2011; Schulman & Kilbourne, 1969). Given these factors, understanding the patterns of evolution in NA is important.
In 2004, Smith et al. (2004) mapped the antigenic evolution of HA of human influenza A (H3N2) virus from its introduction in humans in 1968 until 2003. The study was based on an extensive dataset, comprising influenza virus isolates obtained within each influenza season. Here, we focused on the genetic evolution of NA and compared it with HA1 (the immunogenic section of the HA) using the dataset of Smith et al. (2004), updated to the epidemic of the 2009/2010 season. Reassortment events, rates of evolutionary change and selection pressures were analysed over 40 years of influenza A (H3N2) virus evolution. The differences found between the evolution of NA and HA1 warrant further analysis of the antigenic properties of NA.
Results
Dataset background
Virus isolates obtained between 1968 and 2003 and used in the study of Smith et al. (2004) were combined with 19 influenza A (H3N2) viruses isolated between 2003 and 2009 into a single updated dataset consisting of 291 virus isolates. The new isolates included seven vaccine or reference strains and 12 isolates from epidemics in the Netherlands, of which the latter were chosen based on divergent placement in the updated influenza A (H3N2) antigenic map (de Jong et al., 2011). All NA gene segments of these 291 viruses were sequenced. For the study by Smith et al. (2004), only the HA1 coding regions were sequenced, as this is the immunogenic section of the HA protein (Wiley et al., 1981; Wilson & Cox, 1990). To obtain a similar dataset for HA and NA, the HA1 coding regions of the 19 recent influenza viruses were sequenced. Deduced amino acid sequence alignments showing only positions with at least one mutation are available in Figs S1 and S2 for NA and HA1, respectively (available in JGV Online). Both alignments were colour coded according to the antigenic clusters of HA (Smith et al., 2004).
Genetic evolution of NA and HA1
Maximum-likelihood (ML) phylogenetic trees were constructed to observe the genetic evolution of NA and HA1, updated from 2004, at the nucleotide level (Fig. 1). The general topology of the NA tree was similar to that of the HA1 tree, showing the typical ‘ladder-like’ gradual evolution with rapid replacement of old strains by newer ones. NA had fewer nucleotide substitutions over 40 years of evolution compared with HA1; overall, the genetic distance from the root of the tree to the most recent cluster of CA04 strains was roughly 1.5-fold greater for HA1 than for NA. Although we did see that variants on the trunk were the ancestors of all variants in future years (Fitch et al., 1997), the HA1 phylogeny did have some variants that clustered away from the trunk in an evolutionary terminal or dead-end clade, most notably for the VI75- and the BE89-like viruses. Compared with HA1, such dead-end clades were less obvious in the NA tree. For NA, the most obvious – yet relatively small – evolutionary dead-end clades included a number of the SY97- and BE92-like viruses. Whilst the HA genes of the VI75-like and BE92-like viruses clustered continuously in the ML tree, the NA genes appeared as two separate lineages for both groups of viruses. Notably, the NA genes of HK68-like viruses were more genetically divergent than HA1 (0.044403 vs 0.03556 nucleotide substitutions per site, respectively). Larger genetic distances were found between BK79- and SI87-like viruses and within the SY97-like viruses for NA compared with HA1. In contrast, the distances between EN72- and VI75-, between TX77- and BK79-, and between SY97- and FU02-like viruses were greater for HA1.
Fig. 1.
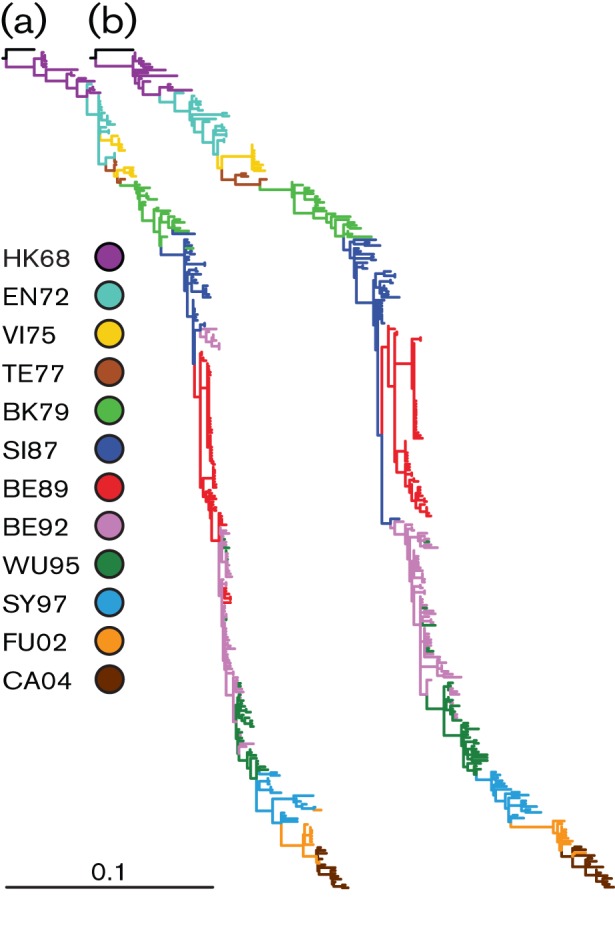
Phylogenetic ML trees of the major glycoproteins of human influenza A (H3N2) viruses. The phylogenetic ML trees of NA (a) and HA1 (b) were generated with 292 nt sequences. The bar represents ~10 % of nucleotide substitutions between close relatives. The colour coding of viruses is based on the antigenic clusters of HA (Smith et al., 2004) and is consistent between both trees.
Genetic maps were generated to visualize the genetic evolution of NA at the amino acid level (Fig. 2a). The HA1 genetic map was updated with the newly added isolates (Fig. 2b). In Fig. 2(c), the two maps are compared with arrows that point from the position of a virus in the HA1 map to the position of the corresponding virus in the NA map. Overall, the genetic map of the NA appeared less clustered and more gradual compared with the HA1 genetic map. Although the genetic clustering of strains based on HA1 amino acid sequences was in good agreement with the antigenic properties of the HA proteins as described previously (Smith et al., 2004), the NA amino acid sequences did not strictly follow the same pattern of clustering. Other features of the NA genetic map, including the less pronounced evolutionary dead ends (yellow and red clusters in Fig. 2b compared with Fig. 2a) and differences in genetic distance within and between clusters compared with HA1, were in agreement with the ML trees.
Fig. 2.

Genetic maps of the major glycoproteins of human influenza A (H3N2) viruses. Genetic maps were generated with 291 aa sequences and multidimensional scaling (MDS) algorithms for NA (a) and HA1 (b). The vertical and horizontal axes correspond to the number of amino acid substitutions; one square represents five amino acid substitutions. The orientation of the HA1 and NA maps was chosen to match the orientation of the antigenic map of human influenza A (H3N2) viruses (Smith et al., 2004). The colour coding of viruses is based on the antigenic clusters of HA and is consistent among all maps (see legend to Fig. 1). The map in panel (c) depicts the HA genetic map with superimposed arrows pointing towards the corresponding data points in the NA genetic map.
Reassortment events
In 2005, Holmes et al. (2005) demonstrated for a limited number of influenza seasons that multiple lineages of influenza A (H3N2) viruses co-circulate, persist and reassort in epidemiologically significant ways. By applying the antigenic cluster colours of HA (Smith et al., 2004) to both the HA1 and NA trees, it was noted that the clusters of NA sequences did not strictly coincide with those of HA (Fig. 1). The HA1 and NA trees shown in Fig. 1 were used in TreeMap to generate a tanglegram. A tanglegram enables visualization of the location of particular isolates within both ML trees. In the absence of reassortment, the twines should connect both trees, in theory, in a seamlessly horizontal way. This was not the case for the isolates used in this study, suggesting frequent reassortment between the NA and HA gene segments. However, this was based on only one phylogeny per gene segment, with clades and branches ordered by branch length in a fixed fashion. To improve on this, the computational software package Graph-incompatibility-based Reassortment Finder (GiRaF) was used to identify reassortments in multiple trees per gene segment (Nagarajan & Kingsford, 2011). This method compares large collections of Markov chain Monte Carlo (MCMC)-sampled trees for groups of incompatible splits to identify sets of taxa with differential phylogenetic placement, whilst accounting for uncertainties in the inferred phylogenies. We performed 100 independent GiRaF analyses on ten independent MrBayes HA runs compared with ten independent MrBayes NA runs. Each run consisted of two independent tree files each with 1000 MCMC-sampled trees. GiRaF removed the first 500 of these trees as burn-in, and the remaining 500 were used for the actual analysis. All reassortment events are reported in Table S1 and those with a support value of ≥50 % of the GiRaF runs are depicted on the tanglegram made from the ML trees as bold twines (Fig. 3). A 50 % cut-off was chosen arbitrarily.
Fig. 3.
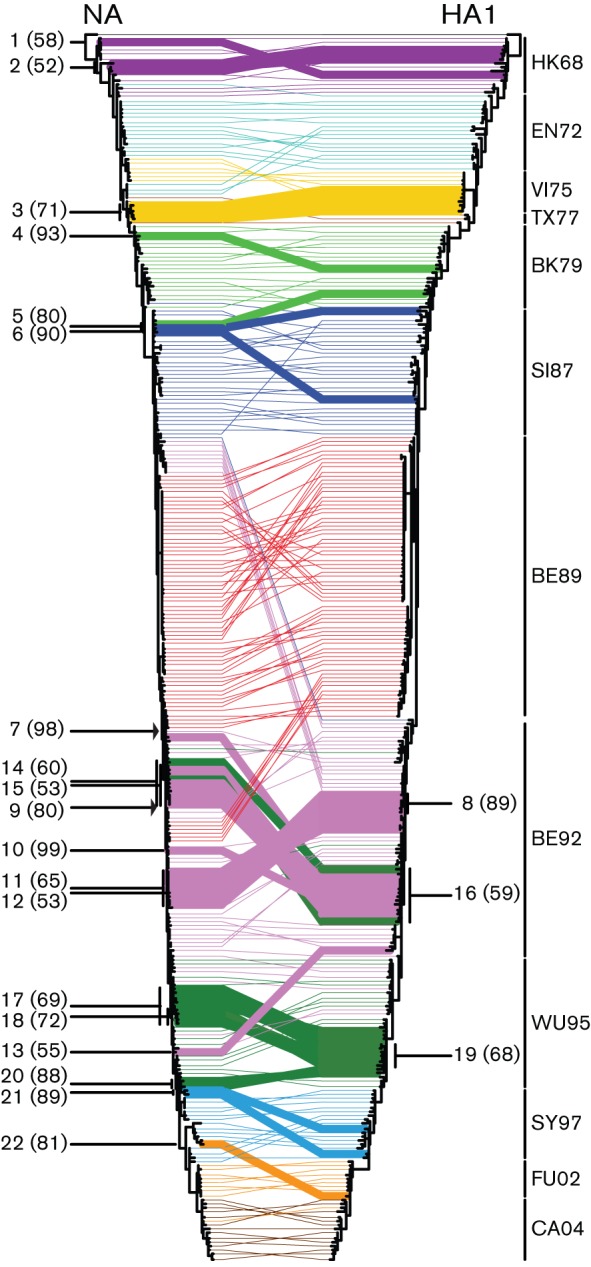
Reassortment events between NA and HA1 during 42 years of influenza A (H3N2) evolution. TreeMap version 1.0 was used to generate a tanglegram with the phylogenetic ML trees shown in Fig. 1. Twines between both trees were colour coded according to the antigenic clusters of HA (Smith et al., 2004; see legend to Fig. 1). GiRaF version 1.01 (Nagarajan & Kingsford, 2011) was used to detect reassortment events between HA and NA. Reassortment events (Table S1) reported in ≥50 % of the cases are indicated in bold, with percentages shown in parentheses. The arrows indicate the introduction of an NA that represents the common ancestor of all more recent NAs.
For the HK68-like viruses, two possible reassortment events were reported with 58 and 52 % support of the GiRaF runs (Fig. 3 and Table S1; events 1 and 2, respectively). There was no evidence for reassortment during the circulation of the EN72-like viruses with support from GiRaF of ≥50 %. The VI75-like viruses in the HA1 tree formed one clade, which descended from EN72-like viruses, and this clade formed the common ancestor to TX77-like viruses. In the NA tree, the VI75-like viruses were divided into two clades. The two different clades represented two different influenza seasons. The first clade, comprising viruses isolated in 1975 and early 1976, was directly descended from EN72-like viruses, similar to the HA tree. In contrast, the second clade, consisting of strains isolated in early 1977, originated, together with the TX77-like viruses, from late EN72-like viruses. The viruses containing the NA of the second clade were reassortants, with a reported support of 71 % of the GiRaF runs (event 3). GiRaF provided no support for reassortment between HA and NA during circulation of the TX77-like viruses. The BK79-like strain A/Philippines/2/1982 was a reported reassortment event with 93 % support (event 4). Two strains with very different HAs, one BK79- and the other SI78-like, both contained a closely related NA and were identified as reassortants in 80 % of the runs (event 5). A/Hong Kong/1/1989, with an intermediate SI87-like HA and an NA that clustered with early SI87-like viruses, was also reported as a reassortant (event 6, 90 %). Multiple reassortment events included BE92-like viruses, and five out of 14 were supported by ≥50 % of the GiRaF reports (events 8 and 10–13). The most notable observation was that the BE92-like viruses were divided into two clades in the NA tree, one descending from SI87-like viruses and the second one from BE89-like viruses. The upper clade included viruses circulating from late 1991 until mid-1993, whilst the second clade contained viruses circulating from late 1992 until early 1996.
The first isolate of the second BE92 clade and everything descending from it were all reported as a single reassortment event supported by 98 % of the GiRaF runs (event 7). A similar event was reported for a more recent BE92-like virus and all its descendants, although with weaker support (event 9, 80 %). Both reports suggest that, at some point during the influenza season of 1992/1993, an NA was introduced by reassortment that represents the common ancestor of the more recent NAs.
Multiple reassortment events were reported by GiRaF within and between the BE92 and WU95 clusters. Clustering of BE92- and WU95-like viruses appeared scattered in both trees, but when comparing these scattered clades between the NA and HA tree, a number of clades positioned differently. Three reassortment events that were supported by ≥50 % of the runs included a mixture of BE92- and WU95-like viruses (events 14–16). During circulation of the more recent WU95-like viruses, four reassortment events were supported by ≥50 % of the GiRaF runs (events 17–20). One reassortment event involving SY97-like viruses was supported by GiRaF ≥50 % (event 21, 89 %). For FU02-like viruses, only one reassortant was reported (event 22, 81 %). Reassortment of HA and NA of CA04-like viruses was not supported at ≥50 % by GiRaF.
Thus, visual inspection of a single NA tree and a single HA1 tree within the tanglegram suggested numerous reassortment events. Inference from multiple MCMC-sampled trees provided support for a portion of these events, using an arbitrary cut-off of 50 %. Overall, these data indicated that, although mostly singular, reassortment events have occurred throughout the evolution of human influenza A (H3N2) viruses, especially during the periods of circulation of BE92- and WU95-like viruses. Most reassortment events were within antigenic clusters, rather than between antigenic clusters. There were 13 reassortment events within the same HA antigenic group (events 1, 2, 4, 6, 8, 10–13 and 17–20). There were six reassortment events involving strains from different HA groups (events 5, 7, 9 and 14–16). Event 3 included only VI75-like strains, but the NAs originated from late EN72-like viruses instead of descending from VI75-like viruses. Event 21 contained an NA derived from WU95-like viruses and an HA descending from SY97-like viruses. Reassortment event 22 was a FU02-like strain, although the NA of this virus originated from SY97-like viruses. Whereas most reassortants were not detected during prolonged periods, possibly suggesting that the reassortment events were neutral or detrimental, two reassortment events (events 7 and 9) persisted in the population.
Evolutionary rates
Rates of nucleotide substitution and time of the most recent common ancestor (MRCA) for NA and HA1 were estimated using beast version 1.6.2 with the relaxed log-normal clock and the Bayesian skyride time-aware model (Table 1). The mean rates of nucleotide substitution for NA and HA1 were 3.15×10⁻³ (HPD 2.81×10⁻³–3.49×10⁻³) and 5.15×10⁻³ (HPD 4.62×10⁻³–5.70×10⁻³) nucleotide substitutions per site per year, respectively. The time of MRCA was 1965.10 (HPD, 1962.82–1967.10) for NA and 1967.00 (HPD, 1966.18–1967.73) for HA1.
Table 1. Mean rate of nucleotide substitutions and time of MRCA of NA and HA1.
HPD, Highest probability density.
| Segment | Mean rate of nucleotide substitution (×10−3 substitutions per site per year) | Time of MRCA | ||||
| Mean | 95 % HPD | Mean | 95 % HPD | |||
| Lower | Upper | Lower | Upper | |||
| NA | 3.15 | 2.81 | 3.49 | 1965.10 | 1962.82 | 1967.10 |
| HA1 | 5.15 | 4.62 | 5.70 | 1967.00 | 1966.18 | 1967.73 |
Selection pressures
The degree of natural selection acting on NA and HA1 was estimated by looking at the mean number of amino acid-changing (non-synonymous or dN) and silent (synonymous or dS) substitutions per site (dN/dS ratio) using Codeml. The overall dN/dS and the mean dN/dS ratios for the internal and external branches were estimated (Table 2). Both genes were under strong selection (NA dN/dS = 0.249 and HA1 dN/dS = 0.362); however, HA1 was less constrained. The dN/dS values for the internal and external branches were similar for NA (0.250 and 0.248) and HA1 (0.350 and 0.371), suggesting no difference between selection pressures on NA and HA1. In theory, a higher dN/dS value for the external relative to the internal branches indicates an excess of non-synonymous mutations that are eventually removed from the virus population by purifying selection, suggesting that these mutations are deleterious (Pybus et al., 2007). This was not the case for NA and HA1.
Table 2. Global, inner and outer dN/dS values for NA and HA1.
| Segment | Sequence length (codons) | dN/dS | ||
| Overall | Internal | External | ||
| NA | 470 | 0.249 | 0.250 | 0.248 |
| HA1 | 329 | 0.362 | 0.350 | 0.371 |
To determine the positively and negatively selected sites along internal branches only, where advantageous mutations are more likely to fall, the internal fixed effects likelihood (IFEL) method was used (Kosakovsky Pond et al., 2006). IFEL detected three positively selected sites in NA: codons 43, 267 and 370 (Table S2). In HA1, nine positively selected sites were reported, all located in antigenic sites (Table S3).
Sites subject to episodic diversifying selection were identified using mixed effects model of evolution (MEME) (Kosakovsky Pond et al., 2011). MEME detected five sites (codons 43, 148, 199, 338 and 465) in NA (Table S2) and 14 in HA1 (Table S3), of which all but two (codons 31 and 185) were found in antigenic sites.
Directional positive selection was detected with the directional evolution in protein sequences (DEPS) test implemented in the HyPhy package (Kosakovsky Pond et al., 2005). The DEPS test identifies directional evolution towards residues at sites within an amino acid alignment in combination with a nucleotide tree and is particularly useful for the detection of selective sweeps (Kosakovsky Pond et al., 2008). For NA, 11 sites (Tables S2 and S4) were identified to be involved in this directional evolution (see Table S4 for the inferred amino acid substitution patterns). For HA1, nine sites were involved (Tables S3 and S5). In contrast, this method detected more sites under directional selection in NA compared with HA1 (11 and nine sites, respectively).
The positively selected sites within HA1 (Table S3) were found mainly in the antigenic sites of HA1 (with two exceptions). One site, namely 145, was detected by all three methods. Residues 31, 133, 135, 137, 159, 186, 193, 226 and 262 were found by two of the methods. For the positively selected sites found by the IFEL, MEME and DEPS analyses, it was noted that only a few were within antigenic sites of NA (Table S2, residues 199, 328, 334, 338, 367 and 370). All positively selected sites are indicated in the NA monomeric and tetrameric protein diagrams shown in Fig. 4(a) and (b), respectively. Fig. S3 depicts ML trees coloured by each positively selected site found by at least two methods.
Fig. 4.

Sites identified as being positively selected, depicted on the NA globular head. Positively selected sites are shown on wire and filled-space models of the monomeric (a) and tetrameric (b) NA structure constructed using MacPyMOL on subtype N2 (PDB code 2BAT; Varghese et al., 1992). The viral receptor sialic acid, represented as red sticks, is docked into the active site, depicted as yellow sticks. All sites located in the globular head found to be positively selected are illustrated as spheres of which the residues visible on the tetrameric structure were given a colour: orange, 199; green, 328; blue, 334; magenta, 338; cyan, 367; brown, 370; lime, 372; purple, 437; olive, 465. Residues 127, 148, 267 and 308 (grey) were also found to be positively selected but were not surface exposed. Residues 43, 46 and 52 are not shown, as they are in the NA stalk domain. Numbers correlate to codon positions identified as under positive selection found within this study (Table S2).
The transition of codon 43 from an aspartic acid to a serine occurred around the time of the cluster transition from TX77 to BK79. The change of serine to an asparagine at position 43 corresponded with the emergence of the BE89 cluster and all descending viruses. The change of arginine to leucine at position 338 correlated roughly with the transition from BE92 to WU95. The changes at position 370 from leucine to serine and from serine back to leucine did not correspond with antigenic cluster transitions for HA, as they occurred during the continued circulation of the HK68-like and BK79-like strains, respectively. The late leucine-to-serine substitution correlated roughly with the FU02 to CA04 transition.
Discussion
In this study, we compared the genetic evolution of NA of 291 human influenza A (H3N2) viruses sampled between 1968 and 2009 with that of HA1. Although similarities were apparent, the main observation was that HA and NA exhibited clear differences in evolutionary genetics.
The general topology of the NA and HA1 trees were similar, showing the typical ‘ladder-like’ gradual evolution with rapid replacement of old strains by newer ones, as described previously for HA1 (Fitch et al., 1997). NA evolved more slowly at the nucleotide level and more gradually, with overall shorter branches and fewer and smaller evolutionary dead-end clades. The genetic distances between clades in the ML trees and in the genetic maps for NA and HA1 were often discordant, suggesting an asynchronous genetic evolution of the two genes. This observation is in agreement with the reported asynchronous evolution at the phenotypic level, with discordant patterns of antigenic drift of HA and NA, as measured by serological assays (Kilbourne et al., 1990; Sandbulte et al., 2011; Schulman & Kilbourne, 1969).
Reassortment is a common feature in influenza viruses (Webster et al., 1992). The Asian, Hong Kong and 2009 swine flu pandemics of 1957, 1968 and 2009, respectively, all emerged following reassortment of swine, avian and/or human influenza viruses (Scholtissek et al., 1978; Smith et al., 2009). In addition to the emergence of pandemic strains, it has been suggested that the emergence of new virus lineages during seasonal epidemics of the past decade may have been associated with reassortment events (Holmes et al., 2005), perhaps resulting from improved matching of the activity of HA and NA in relation to HA antigenic change (Kaverin et al., 2000; Mitnaul et al., 2000; Wagner et al., 2002). However, when amino acid substitutions in the active sites of HA and NA were analysed, no evidence for a ‘matched’ evolution of HA and NA was found, as there were only isolated cases of substitutions in the catalytic site of NA (specifically at position 151) that seemed to provide no increased fitness as their occurrences were transient.
For our influenza A virus dataset spanning >40 years of influenza A (H3N2) virus epidemics, differences in clustering of HA and NA gene segments within phylogenetic trees indeed suggested that reassortment events had occurred relatively frequently over time. The large genetic distances between NA sequences of the HK68-like viruses, shown in both the phylogenetic ML tree (Fig. 1a) and the genetic map (Fig. 2a), could be explained by a reassortment event involving an early influenza A (H3N2) virus, in which a heterologous N2 gene of H2N2 virus origin was reintroduced (Lindstrom et al., 2004). Indeed, in an ML tree generated with NA genes of all early influenza A (H3N2) viruses and additional H2N2 strains, the NA of the late H2N2 viruses clustered together with HK68-like viruses of 1969 and 1970 (data not shown). GiRaF analyses provided further support that several HK68-like strains (A/Bilthoven/17938/1969, A/Bilthoven/2668/1970 and A/Bilthoven/93/1970) were reassortants. Apart from these late HK68-like strains, GiRaF provided evidence for reassortment events between 1971 and 1977. Co-circulation of antigenically distinct viruses has been reported in this period (Kendal et al., 1978; Pereira & Chakraverty, 1977; Schild et al., 1973), providing opportunities for such reassortment events. In agreement with a previous study (Xu et al., 1996), there was also support for reassortment events between BE89- and BE92-like viruses. GiRaF analyses further suggested that reassortment events between HA and NA of influenza A (H3N2) viruses occurred particularly frequently during the circulation of BE92- and WU95-like viruses. It remains unclear whether the frequency of reassortment events over time is significant and whether these reassortment events have been of epidemiological significance. Analyses with all genomic sequences would provide us with a better insight into reassortment patterns.
Some concerns arise from the use of GiRaF in the intra-H3N2-evolution context. The evolutionary distances sampled in the present dataset are not the same as those GiRaF was originally benchmarked against, and the performance of GiRaF was shown to depend on the distance distribution. Moreover, GiRaF seemed to perform slightly better for single-taxa reassortments compared with larger events. It should further be noted that the low false-positive rate of GiRaF was only estimated on synthetic datasets assuming neutral evolution models (Nagarajan & Kingsford, 2011). Here, we used a tanglegram based on robust HA and NA ML trees to visually inspect the results reported by GiRaF as an independent test. The reassortment events reported by GiRaF with >50 % support could all be confirmed by visual inspection of the tanglegram. To test whether the small genetic distances between the sets of HA and NA sequences were problematic for GiRaF, we also ran GiRaF on HA trees only (comparing one set of HA trees with another set of HA trees) and on NA trees only, and using alignments in which the HA and NA sequences were split into half. One would not expect to detect any reassortment events in these runs. GiRaF analysis reported only three events for the 5′HA–3′HA analysis, and no reassortment events for the analysis of 5′NA–3′NA, HA–HA and NA–NA trees. Thus, we concluded from this that the 22 HA–NA reassortment events reported in the present work are supported by GiRaF and visual inspection.
The evolutionary rates of NA and HA1 were high (Hanada et al., 2004; Jenkins et al., 2002) and of the expected level for influenza viruses (Bhatt et al., 2011). The evolutionary rate of NA of 3.15×10⁻³ nucleotide substitutions per site per year was slightly higher than a previously reported rate (2.3×10⁻³; Xu et al., 1996). Although the rate of nucleotide substitution of NA was lower than that of HA (5.15×10⁻³ nucleotide substitutions per site per year), it is important to note that only HA1 was analysed here. As HA1 is the most variable part of the HA gene, this part would probably yield higher evolutionary rates than the full HA gene (Bhatt et al., 2011).
The coalescent analyses revealed that the time of circulation of the MRCA of both HA1 and NA of influenza A (H3N2) viruses was around 1965 and 1967, respectively (Table 1). As the 95 % HPDs for the MRCAs of both NA and HA1 overlapped, it is likely that there was a single seeding event for the 1968 pandemic, possibly prior to the first recognition in 1968.
The overall mean dN/dS values of 0.249 (NA) and 0.362 (HA1) estimated by the paml program (Table 2) were in agreement with previously reported values (Chen & Holmes, 2008). There was an abundance of negatively selected sites and a limited number of positively selected sites in both HA1 and NA (Tables 2, S2 and S3). Generally, the number of positively selected sites was lower in NA compared with HA1. In contrast, DEPS detected more sites under directional selection in NA compared with HA1, which suggests that positive selection in HA1 is more random, or it could reflect toggling of antigenic sites due to antibody pressure.
The positively selected codons 43, 46 and 52 are all located in the highly variable stalk region (Blok & Air, 1982). Residue 199, detected by MEME, was reported previously as an antigenic site (Gulati et al., 2002). Residue 267, detected by IFEL, is not an antigenic site but has been reported previously as being positively selected (Kosakovsky Pond et al., 2008). Two documented antigenic sites, 328 (Air et al., 1985) and 334 (Air et al., 1985; Laver et al., 1982), were detected by DEPS. Residue 370, a reported antigenic residue (Air et al., 1985; Laver et al., 1982; Lentz et al., 1984), was found by IFEL and DEPS as being positively selected. By IFEL, MEME and DEPS, the number of positively selected sites found to be within antigenic sites in NA was lower than in HA1.
In summary, we have analysed the evolutionary genetics of NA of influenza A (H3N2) viruses isolated from 1968 to 2009 and compared them with those of HA. High-level similarities were observed between the evolution of HA and NA, although notable differences were apparent. Future research on the evolution of NA should focus at the phenotypic level, using serological tests and antigenic cartography methods, as described recently (Kilbourne et al., 1990; Sandbulte et al., 2011; Schulman & Kilbourne, 1969), on extensive virus datasets. Such analysis would allow not only the side-by-side comparison of HA and NA evolution at the genetic level as carried out here but also its relationship with immune escape, the major driver of evolution of the surface glycoproteins of influenza A virus. Such analyses, along with full virus genome data, ultimately may lead to a better understanding and increased predictability of the evolution of influenza A (H3N2) virus.
Methods
Viruses.
Human influenza A (H3N2) viruses, isolated over 35 years of influenza virus surveillance between 1968 and 2003 that were used in the study of Smith et al. (2004), served as the basis for this study. Two viruses within this dataset were no longer available (A/Victoria/7/87 and A/Netherlands/440/93) and were thus excluded from the dataset. The dataset was updated with 19 influenza A (H3N2) viruses circulating between 2003 and 2009, including seven vaccine or reference strains and 12 isolates from epidemics in the Netherlands. The latter 12 isolates were chosen based on divergent placement in the updated A (H3N2) antigenic map (de Jong et al., 2011). This led to a total of 291 human influenza A (H3N2) viruses. Human influenza A (H3N2) viruses were propagated in Madin–Darby canine kidney (MDCK) cells or, if unsuccessful, in 11-day-old embryonated chicken eggs.
Sequence analysis.
MDCK supernatant or allantoic fluid was used for RNA extraction, using a High Pure RNA Isolation kit (Roche Applied Science) and cDNA was synthesized with SuperScript III reverse transcriptase (Invitrogen). The complete NA and HA1 gene segments were amplified by PCR using AmpliTaq Gold DNA polymerase (Applied Biosystems) and purified by gel extraction with a QIAquick Gel Extraction kit (Qiagen). Sequencing was performed with NA- or HA-specific primers using a BigDye Terminator Version 3.1 Cycle Sequencing kit (Applied Biosystems) and a 3130 XL Genetic Analyzer (Applied Biosystems), according to the instructions of the manufacturer.
Nucleotide sequences of the NA ORFs and HA1 coding regions were aligned using the clustal w program running within the BioEdit software package, version 7.0.9.0 (Hall, 1999). Seven HA1 and 14 NA sequences contained one or more degenerate nucleotide positions. In all HA1 and ten of the 14 NA sequences, the degenerate nucleotide led to degenerate amino acid positions. One NA sequence contained an insertion of 3 nt between codons 221 and 222, and one sequence had a 3 nt deletion at codon 154. Newly sequenced and previously published NA and HA1 domain accession numbers are provided in the Supplementary data.
Phylogeny.
Nucleotide sequence alignments with or without an additional outgroup (A/Duck/Hokkaido/33/80 for HA1 and A/Japan/305/1957 for NA) were generated. With these nucleotide sequence alignments, the best-fit models of nucleotide substitution were determined by jModelTest (Posada, 2008). In all cases, the preferred ML-optimized model of nucleotide substitution was TVM+I+Γ4 (transversion model with the proportion of invariant sites and the gamma distribution of among-site rate variation with four categories estimated from the empirical data) with GTR+I+Γ4 (general time-reversible model) as second best based on the Akaike information criterion (AIC).
As seven HA1 and ten NA nucleotide sequences contained degenerate amino acid positions, either a B (aspartate or asparagine) or an X (any amino acid) was applied at these positions. The best-fit models of protein evolution were determined with ProtTest (Darriba et al., 2011). The preferred ML-optimized model was HIVw+Γ4 (human immunodeficiency virus within) for HA1 and HIVw+I+Γ4+F (equilibrium amino acid frequencies estimated from the empirical data) for NA based on the AIC.
Phylogenetic analysis.
With the nucleotide sequence alignments, initial ML trees were inferred using the PhyML package version 3.0 (Guindon & Gascuel, 2003), by means of a full heuristic search and the subtree pruning and regrafting (SPR) method. As the TVM+I+Γ4 model of nucleotide substitution was not an option within the PhyML package, the GTR+I+Γ4 model was chosen for all datasets. garli version 0.951 (Zwickl, 2006) was run on the best nucleotide tree from PhyML for 2 million generations to optimize tree topology and branch lengths. Additionally, ML trees were estimated using the TVM+I+Γ4 model of base substitution in combination with tree-bisection-reconnection (TBR) searches using the paup* version 4.0b10 package (Swofford, 2003). For each of the trees, the reliability of all phylogenetic groupings was determined through a non-parametric bootstrap resampling analysis: either 500 replicates of ML trees using the GTR+I+Γ4 model and the SPR method using PhyML, or 1000 replicates of neighbour-joining trees estimated under the ML substitution model using paup*. All trees are available from the authors upon request. Trees were visualized with the FigTree program version 1.3.1 (http://tree.bio.ed.ac.uk/software/figtree/). Trees were rooted on the outgroup strains (A/Duck/Hokkaido/33/80 for HA1 and A/Japan/305/1957 for NA) or on the 1968 pandemic strain (A/Hong Kong/1/1968).
Amino acid alignments were used in combination with the HIVw+Γ4 (HA1) or HIVw+I+Γ4+F (NA) model of protein evolution to infer ML trees using the PhyML package version 3.0 (Guindon & Gascuel, 2003) by means of a full heuristic search and the SPR method.
Genetic maps.
Amino acid sequence alignments were used to calculate a distance matrix with the number of amino acid substitutions between pairs of strains to produce ‘genetic maps’, as described previously (Smith et al., 2004). Genetic mapping is a way to facilitate a quantitative analysis and visualization of genetic data. In a genetic map, the distance between isolates A and B corresponds to the number of amino acid substitutions between the amino acid sequences of a particular protein-coding region of isolates A and B. Thus, each difference in an amino acid alignment can be thought of as specifying a target distance for the points in a genetic map. Modified MDS methods are then used to arrange the points between two isolates in a genetic map to best satisfy the target distances specified by the amino acid alignment distance matrix. The result is a map in which the distance between points represents the number of amino acid substitutions in a particular protein-coding region between isolates. To avoid underestimating genetic distances due to sequential mutations at the same location, a threshold needs to be applied. For example, when a threshold of 30 is applied to the alignment, the software is free to use a distance of at least 30 aa between two points that have a 30 aa difference in order to retrieve the lowest error function. For HA1, the previously determined threshold of 30 was used (Smith et al., 2004). Threshold considerations for NA were based on adequate correlation between observed distances and genetic map distances and sufficient correlation between ML amino acid tree distances and genetic map distances. The threshold that approached both considerations best for NA was 20 (data not shown). The correlation between the number of amino acid substitutions and the corresponding distances between strains in the genetic map was 0.93 (data not shown), indicating that the two-dimensional genetic map is a reasonable representation of the target amino acid distance matrix. For software, see http://www.antigenic-cartography.org.
Detection of reassortment.
ML trees of NA and HA1 were used in TreeMap version 1.0 (http://taxonomy.zoology.gla.ac.uk/rod/treemap.html). TreeMap, originally designed for comparing host and parasite trees, was applied solely to display a tanglegram between the HA and NA phylogenies. The twines were colour coded according to the HA antigenic clusters (Smith et al., 2004).
Reassortment events were identified by the GiRaF program (Nagarajan & Kingsford, 2011). Nucleotide alignments of HA1 or NA were used as input for MrBayes (Huelsenbeck & Ronquist, 2001; Ronquist & Huelsenbeck, 2003) to sample 1000 unrooted candidate trees with the GTR+I+Γ4 substitution model, a burn-in of 100 000 and sampling every 200 iterations. These trees were subsequently used to model the phylogenetic uncertainty for each segment with the GiRaF program under default settings. This procedure was repeated 100 times with ten independent MrBayes runs for NA and ten independent MrBayes runs for HA1.
Estimation of nucleotide substitution rates and times of divergence.
To identify potential errors in sequence data annotation that might affect the clock estimation, the ML nucleotide HA1 and NA trees were exported to Path-O-Gen version 1.3 (http://tree.bio.ed.ac.uk/software/pathogen; Drummond et al., 2003) and a linear regression plot for the years of sampling versus root-to-tip distance was generated (Fig. S4). No anomalies were seen in the NA and HA1 datasets, which both behaved in a clock-like manner (R2 = 0.977 and R2 = 0.967, respectively).
Overall rates of evolutionary change (nucleotide substitutions per site per year), MRCA in years and relative genetic diversity were estimated using the beast program version 1.6.2 (http://beast.bio.ed.ac.uk/; Drummond & Rambaut, 2007). For all analyses, the uncorrelated log-normal relaxed molecular clock was used to accommodate variation in molecular evolutionary rate among lineages in combination with the SRD06 codon position model, with a different rate of nucleotide substitution for the first plus second versus the third codon position, and the HKY85 substitution model (Shapiro et al., 2006).
Isolation dates were added to calibrate the molecular clock. This analysis was conducted with a time-aware linear Bayesian skyride coalescent tree prior (Minin et al., 2008) over the unknown tree space, with relatively uninformative priors on all model parameters. Two independent Bayesian MCMC analyses, performed for HA1 and NA for 100 million states, sampling every 1000 states, were performed. Convergences and effective sample sizes of the estimates were checked using Tracer version 1.5 (http://tree.bio.ed.ac.uk/software/tracer/) and the first 10 % of each chain was discarded as burn-in. Uncertainty in parameter estimates is reported as values of the 95 % HPD.
Selection pressures.
To determine the degree of natural selection acting on HA1 and NA, the mean number of dN and dS substitutions per site (dN/dS ratio or ω) was estimated using the ‘one-ratio’ model of the Codeml program implemented in the paml package (Yang, 2007). Codeml uses the codon substitution model of Goldman & Yang (1994) for protein-coding DNA sequences and was used in combination with the ML tree rooted on A/Hong Kong/1/68. Selection pressures on the internal and external branches of the HA1 and NA ML tree were estimated with the ‘two-ratio’ model of the Codeml program.
To determine the positively and negatively selected sites along internal branches, the IFEL method was used (Kosakovsky Pond et al., 2006). Sites subject to episodic diversifying selection were identified using MEME (Kosakovsky Pond et al., 2011). Both methods were accessed through the Datamonkey interface (http://www.datamonkey.org) and the GTR (HA1) or TVM (NA) nucleotide substitution model was used. Sites with a P value <0.05 were reported as positively selected sites.
Directional positive selection was detected with the DEPS test implemented in the HyPhy package (Kosakovsky Pond et al., 2005). For this procedure, the ML trees with the A/Hong Kong/1/68 pandemic strain as outgroup were used in combination with the amino acid alignment and the HIVw model of protein evolution.
Positively selected sites were show on the monomeric and tetrameric NA structure constructed using MacPyMOL (PyMOL Molecular Graphics System, version 13) on subtype N2 (PDB code 2BAT; Varghese et al., 1992).
Acknowledgements
The authors would gratefully like to thank Dr Mathilde Richard for constructive discussions, Stefan van der Vliet and Oanh Vuong for excellent technical assistance and Ton Marzec for providing part of the influenza A (H3N2) virus isolates. We are grateful for the outstanding training received at the 15th and 16th International Bioinformatics Workshop on Virus Evolution and Molecular Epidemiology, September 2009, Rotterdam and 2010, Baltimore (http://regaweb.med.kuleuven.be/workshop/). This work was supported by an NWO-VICI grant and NIH contract no. HHSN266200700010C.
Footnotes
Four supplementary figures, five supplementary tables and supplementary data are available with the online version of this paper.
References
- Air G. M., Els M. C., Brown L. E., Laver W. G., Webster R. G. (1985). Location of antigenic sites on the three-dimensional structure of the influenza N2 virus neuraminidase. Virology 145, 237–248 10.1016/0042-6822(85)90157-6 [DOI] [PubMed] [Google Scholar]
- Barr I. G., McCauley J., Cox N., Daniels R., Engelhardt O. G., Fukuda K., Grohmann G., Hay A., Kelso A. & other authors (2010). Epidemiological, antigenic and genetic characteristics of seasonal influenza A(H1N1), A(H3N2) and B influenza viruses: basis for the WHO recommendation on the composition of influenza vaccines for use in the 2009–2010 Northern Hemisphere season. Vaccine 28, 1156–1167 10.1016/j.vaccine.2009.11.043 [DOI] [PubMed] [Google Scholar]
- Bhatt S., Holmes E. C., Pybus O. G. (2011). The genomic rate of molecular adaptation of the human influenza A virus. Mol Biol Evol 28, 2443–2451 10.1093/molbev/msr044 [DOI] [PMC free article] [PubMed] [Google Scholar]
- Blok J., Air G. M. (1982). Variation in the membrane-insertion and “stalk” sequences in eight subtypes of influenza type A virus neuraminidase. Biochemistry 21, 4001–4007 10.1021/bi00260a015 [DOI] [PubMed] [Google Scholar]
- Brett I. C., Johansson B. E. (2005). Immunization against influenza A virus: comparison of conventional inactivated, live-attenuated and recombinant baculovirus produced purified hemagglutinin and neuraminidase vaccines in a murine model system. Virology 339, 273–280 10.1016/j.virol.2005.06.006 [DOI] [PubMed] [Google Scholar]
- Chen R., Holmes E. C. (2008). The evolutionary dynamics of human influenza B virus. J Mol Evol 66, 655–663 10.1007/s00239-008-9119-z [DOI] [PMC free article] [PubMed] [Google Scholar]
- Colman P. M., Varghese J. N., Laver W. G. (1983). Structure of the catalytic and antigenic sites in influenza virus neuraminidase. Nature 303, 41–44 10.1038/303041a0 [DOI] [PubMed] [Google Scholar]
- Colman P. M., Laver W. G., Varghese J. N., Baker A. T., Tulloch P. A., Air G. M., Webster R. G. (1987). Three-dimensional structure of a complex of antibody with influenza virus neuraminidase. Nature 326, 358–363 10.1038/326358a0 [DOI] [PubMed] [Google Scholar]
- Couch R. B., Kasel J. A., Gerin J. L., Schulman J. L., Kilbourne E. D. (1974). Induction of partial immunity to influenza by a neuraminidase-specific vaccine. J Infect Dis 129, 411–420 10.1093/infdis/129.4.411 [DOI] [PubMed] [Google Scholar]
- Darriba D., Taboada G. L., Doallo R., Posada D. (2011). ProtTest 3: fast selection of best-fit models of protein evolution. Bioinformatics 27, 1164–1165 10.1093/bioinformatics/btr088 [DOI] [PMC free article] [PubMed] [Google Scholar]
- de Jong J. C., Donker G. A., Meijer A., van der Hoek W., Rimmelzwaan G. F., Osterhaus A. D. M. E. (2011). Het influenzaseizoen 2010/2011 in Nederland: het nieuwe A(H1N1)-virus van 2009 blijft actief. Ned Tijdschr Med Microbiol 19, 21–27 [Google Scholar]
- Drummond A. J., Rambaut A. (2007). beast: Bayesian evolutionary analysis by sampling trees. BMC Evol Biol 7, 214 10.1186/1471-2148-7-214 [DOI] [PMC free article] [PubMed] [Google Scholar]
- Drummond A., Pybus O. G., Rambaut A. (2003). Inference of viral evolutionary rates from molecular sequences. Adv Parasitol 54, 331–358 10.1016/S0065-308X(03)54008-8 [DOI] [PubMed] [Google Scholar]
- Fiore A. E., Uyeki T. M., Broder K., Finelli L., Euler G. L., Singleton J. A., Iskander J. K., Wortley P. M., Shay D. K. & other authors (2010). Prevention and control of influenza with vaccines: recommendations of the Advisory Committee on Immunization Practices (ACIP), 2010. MMWR Recomm Rep 59 (RR-8), 1–62 [PubMed] [Google Scholar]
- Fitch W. M., Bush R. M., Bender C. A., Cox N. J. (1997). Long term trends in the evolution of H(3) HA1 human influenza type A. Proc Natl Acad Sci U S A 94, 7712–7718 10.1073/pnas.94.15.7712 [DOI] [PMC free article] [PubMed] [Google Scholar]
- Fouchier R. A., Munster V., Wallensten A., Bestebroer T. M., Herfst S., Smith D., Rimmelzwaan G. F., Olsen B., Osterhaus A. D. (2005). Characterization of a novel influenza A virus hemagglutinin subtype (H16) obtained from black-headed gulls. J Virol 79, 2814–2822 10.1128/JVI.79.5.2814-2822.2005 [DOI] [PMC free article] [PubMed] [Google Scholar]
- Goldman N., Yang Z. (1994). A codon-based model of nucleotide substitution for protein-coding DNA sequences. Mol Biol Evol 11, 725–736 [DOI] [PubMed] [Google Scholar]
- Guindon S., Gascuel O. (2003). A simple, fast, and accurate algorithm to estimate large phylogenies by maximum likelihood. Syst Biol 52, 696–704 10.1080/10635150390235520 [DOI] [PubMed] [Google Scholar]
- Gulati U., Hwang C.-C., Venkatramani L., Gulati S., Stray S. J., Lee J. T., Laver W. G., Bochkarev A., Zlotnick A., Air G. M. (2002). Antibody epitopes on the neuraminidase of a recent H3N2 influenza virus (A/Memphis/31/98). J Virol 76, 12274–12280 10.1128/JVI.76.23.12274-12280.2002 [DOI] [PMC free article] [PubMed] [Google Scholar]
- Hall T. A. (1999). BioEdit: a user-friendly biological sequence alignment editor and analysis program for Windows 95/98/NT. Nucleic Acids Symp Ser 41, 95–98 [Google Scholar]
- Hanada K., Suzuki Y., Gojobori T. (2004). A large variation in the rates of synonymous substitution for RNA viruses and its relationship to a diversity of viral infection and transmission modes. Mol Biol Evol 21, 1074–1080 10.1093/molbev/msh109 [DOI] [PMC free article] [PubMed] [Google Scholar]
- Holmes E. C., Ghedin E., Miller N., Taylor J., Bao Y., St George K., Grenfell B. T., Salzberg S. L., Fraser C. M. & other authors (2005). Whole-genome analysis of human influenza A virus reveals multiple persistent lineages and reassortment among recent H3N2 viruses. PLoS Biol 3, e300 10.1371/journal.pbio.0030300 [DOI] [PMC free article] [PubMed] [Google Scholar]
- Huelsenbeck J. P., Ronquist F. (2001). MRBAYES: Bayesian inference of phylogenetic trees. Bioinformatics 17, 754–755 10.1093/bioinformatics/17.8.754 [DOI] [PubMed] [Google Scholar]
- Jenkins G. M., Rambaut A., Pybus O. G., Holmes E. C. (2002). Rates of molecular evolution in RNA viruses: a quantitative phylogenetic analysis. J Mol Evol 54, 156–165 10.1007/s00239-001-0064-3 [DOI] [PubMed] [Google Scholar]
- Johansson B. E., Grajower B., Kilbourne E. D. (1993). Infection-permissive immunization with influenza virus neuraminidase prevents weight loss in infected mice. Vaccine 11, 1037–1039 10.1016/0264-410X(93)90130-P [DOI] [PubMed] [Google Scholar]
- Kaverin N. V., Matrosovich M. N., Gambaryan A. S., Rudneva I. A., Shilov A. A., Varich N. L., Makarova N. V., Kropotkina E. A., Sinitsin B. V. (2000). Intergenic HA–NA interactions in influenza A virus: postreassortment substitutions of charged amino acid in the hemagglutinin of different subtypes. Virus Res 66, 123–129 10.1016/S0168-1702(99)00131-8 [DOI] [PubMed] [Google Scholar]
- Kendal A. P., Schieble J., Cooney M. K., Chin J., Foy H. M., Noble G. R. (1978). Co-circulation of two influenza A (H3N2) antigenic variants detected by virus surveillance in individual communities. Am J Epidemiol 108, 308–311 [DOI] [PubMed] [Google Scholar]
- Kilbourne E. D. (1976). Comparative efficacy of neuraminidase-specific and conventional influenza virus vaccines in induction of antibody to neuraminidase in humans. J Infect Dis 134, 384–394 10.1093/infdis/134.4.384 [DOI] [PubMed] [Google Scholar]
- Kilbourne E. D., Johansson B. E., Grajower B. (1990). Independent and disparate evolution in nature of influenza A virus hemagglutinin and neuraminidase glycoproteins. Proc Natl Acad Sci U S A 87, 786–790 10.1073/pnas.87.2.786 [DOI] [PMC free article] [PubMed] [Google Scholar]
- Kosakovsky Pond S. L., Frost S. D., Muse S. V. (2005). HyPhy: hypothesis testing using phylogenies. Bioinformatics 21, 676–679 10.1093/bioinformatics/bti079 [DOI] [PubMed] [Google Scholar]
- Kosakovsky Pond S. L., Frost S. D., Grossman Z., Gravenor M. B., Richman D. D., Brown A. J. (2006). Adaptation to different human populations by HIV-1 revealed by codon-based analyses. PLoS Comput Biol 2, e62 10.1371/journal.pcbi.0020062 [DOI] [PMC free article] [PubMed] [Google Scholar]
- Kosakovsky Pond S. L., Poon A. F., Leigh Brown A. J., Frost S. D. (2008). A maximum likelihood method for detecting directional evolution in protein sequences and its application to influenza A virus. Mol Biol Evol 25, 1809–1824 10.1093/molbev/msn123 [DOI] [PMC free article] [PubMed] [Google Scholar]
- Kosakovsky Pond S. L., Murrell B., Fourment M., Frost S. D., Delport W., Scheffler K. (2011). A random effects branch-site model for detecting episodic diversifying selection. Mol Biol Evol 28, 3033–3043 10.1093/molbev/msr125 [DOI] [PMC free article] [PubMed] [Google Scholar]
- Laver W. G., Air G. M., Webster R. G., Markoff L. J. (1982). Amino acid sequence changes in antigenic variants of type A influenza virus N2 neuraminidase. Virology 122, 450–460 10.1016/0042-6822(82)90244-6 [DOI] [PubMed] [Google Scholar]
- Lentz M. R., Air G. M., Laver W. G., Webster R. G. (1984). Sequence of the neuraminidase gene of influenza virus A/Tokyo/3/67 and previously uncharacterized monoclonal variants. Virology 135, 257–265 10.1016/0042-6822(84)90135-1 [DOI] [PubMed] [Google Scholar]
- Lindstrom S. E., Cox N. J., Klimov A. (2004). Genetic analysis of human H2N2 and early H3N2 influenza viruses, 1957–1972: evidence for genetic divergence and multiple reassortment events. Virology 328, 101–119 10.1016/j.virol.2004.06.009 [DOI] [PubMed] [Google Scholar]
- Liu C., Eichelberger M. C., Compans R. W., Air G. M. (1995). Influenza type A virus neuraminidase does not play a role in viral entry, replication, assembly, or budding. J Virol 69, 1099–1106 [DOI] [PMC free article] [PubMed] [Google Scholar]
- Luther P., Bergmann K. C., Oxford J. S. (1984). An investigation of antigenic drift of neuraminidases of influenza A (H1N1) viruses. J Hyg (Lond) 92, 223–229 10.1017/S002217240006424X [DOI] [PMC free article] [PubMed] [Google Scholar]
- Minin V. N., Bloomquist E. W., Suchard M. A. (2008). Smooth skyride through a rough skyline: Bayesian coalescent-based inference of population dynamics. Mol Biol Evol 25, 1459–1471 10.1093/molbev/msn090 [DOI] [PMC free article] [PubMed] [Google Scholar]
- Mitnaul L. J., Matrosovich M. N., Castrucci M. R., Tuzikov A. B., Bovin N. V., Kobasa D., Kawaoka Y. (2000). Balanced hemagglutinin and neuraminidase activities are critical for efficient replication of influenza A virus. J Virol 74, 6015–6020 10.1128/JVI.74.13.6015-6020.2000 [DOI] [PMC free article] [PubMed] [Google Scholar]
- Murphy B. R., Kasel J. A., Chanock R. M. (1972). Association of serum anti-neuraminidase antibody with resistance to influenza in man. N Engl J Med 286, 1329–1332 10.1056/NEJM197206222862502 [DOI] [PubMed] [Google Scholar]
- Nagarajan N., Kingsford C. (2011). GiRaF: robust, computational identification of influenza reassortments via graph mining. Nucleic Acids Res 39, e34 10.1093/nar/gkq1232 [DOI] [PMC free article] [PubMed] [Google Scholar]
- Palese P., Compans R. W. (1976). Inhibition of influenza virus replication in tissue culture by 2-deoxy-2,3-dehydro-N-trifluoroacetylneuraminic acid (FANA): mechanism of action. J Gen Virol 33, 159–163 10.1099/0022-1317-33-1-159 [DOI] [PubMed] [Google Scholar]
- Palese P., Tobita K., Ueda M., Compans R. W. (1974). Characterization of temperature sensitive influenza virus mutants defective in neuraminidase. Virology 61, 397–410 10.1016/0042-6822(74)90276-1 [DOI] [PubMed] [Google Scholar]
- Pereira M. S., Chakraverty P. (1977). The laboratory surveillance of influenza epidemics in the United Kingdom 1968–1976. J Hyg (Lond) 79, 77–87 10.1017/S0022172400052876 [DOI] [PMC free article] [PubMed] [Google Scholar]
- Posada D. (2008). jModelTest: phylogenetic model averaging. Mol Biol Evol 25, 1253–1256 10.1093/molbev/msn083 [DOI] [PubMed] [Google Scholar]
- Pybus O. G., Rambaut A., Belshaw R., Freckleton R. P., Drummond A. J., Holmes E. C. (2007). Phylogenetic evidence for deleterious mutation load in RNA viruses and its contribution to viral evolution. Mol Biol Evol 24, 845–852 10.1093/molbev/msm001 [DOI] [PubMed] [Google Scholar]
- Rambaut A., Pybus O. G., Nelson M. I., Viboud C., Taubenberger J. K., Holmes E. C. (2008). The genomic and epidemiological dynamics of human influenza A virus. Nature 453, 615–619 10.1038/nature06945 [DOI] [PMC free article] [PubMed] [Google Scholar]
- Ronquist F., Huelsenbeck J. P. (2003). MrBayes 3: Bayesian phylogenetic inference under mixed models. Bioinformatics 19, 1572–1574 10.1093/bioinformatics/btg180 [DOI] [PubMed] [Google Scholar]
- Russell C. A., Jones T. C., Barr I. G., Cox N. J., Garten R. J., Gregory V., Gust I. D., Hampson A. W., Hay A. J. & other authors (2008). Influenza vaccine strain selection and recent studies on the global migration of seasonal influenza viruses. Vaccine 26 (Suppl. 4), D31–D34 10.1016/j.vaccine.2008.07.078 [DOI] [PubMed] [Google Scholar]
- Sandbulte M. R., Westgeest K. B., Gao J., Xu X., Klimov A. I., Russell C. A., Burke D. F., Smith D. J., Fouchier R. A., Eichelberger M. C. (2011). Discordant antigenic drift of neuraminidase and hemagglutinin in H1N1 and H3N2 influenza viruses. Proc Natl Acad Sci U S A 108, 20748–20753 10.1073/pnas.1113801108 [DOI] [PMC free article] [PubMed] [Google Scholar]
- Sauter N. K., Bednarski M. D., Wurzburg B. A., Hanson J. E., Whitesides G. M., Skehel J. J., Wiley D. C. (1989). Hemagglutinins from two influenza virus variants bind to sialic acid derivatives with millimolar dissociation constants: a 500-MHz proton nuclear magnetic resonance study. Biochemistry 28, 8388–8396 10.1021/bi00447a018 [DOI] [PubMed] [Google Scholar]
- Schild G. C., Henry-Aymard M., Pereira M. S., Chakraverty P., Dowdle W., Coleman M., Chang W. K. (1973). Antigenic variation in current human type A influenza viruses: antigenic characteristics of the variants and their geographic distribution. Bull World Health Organ 48, 269–278 [PMC free article] [PubMed] [Google Scholar]
- Schild G. C., Oxford J. S., Dowdle W. R., Coleman M., Pereira M. S., Chakraverty P. (1974). Antigenic variation in current influenza A viruses: evidence for a high frequency of antigenic ‘drift’ for the Hong Kong virus. Bull World Health Organ 51, 1–11 [PMC free article] [PubMed] [Google Scholar]
- Schild G. C., Newman R. W., Webster R. G., Major D., Hinshaw V. S. (1980). Antigenic analysis of influenza A virus surface antigens: considerations for the nomenclature of influenza virus. Comp Immunol Microbiol Infect Dis 3, 5–18 10.1016/0147-9571(80)90034-X [DOI] [PubMed] [Google Scholar]
- Scholtissek C., Rohde W., Von Hoyningen V., Rott R. (1978). On the origin of the human influenza virus subtypes H2N2 and H3N2. Virology 87, 13–20 10.1016/0042-6822(78)90153-8 [DOI] [PubMed] [Google Scholar]
- Schulman J. L., Kilbourne E. D. (1969). Independent variation in nature of hemagglutinin and neuraminidase antigens of influenza virus: distinctiveness of hemagglutinin antigen of Hong Kong-68 virus. Proc Natl Acad Sci U S A 63, 326–333 10.1073/pnas.63.2.326 [DOI] [PMC free article] [PubMed] [Google Scholar]
- Schulman J. L., Khakpour M., Kilbourne E. D. (1968). Protective effects of specific immunity to viral neuraminidase on influenza virus infection of mice. J Virol 2, 778–786 [DOI] [PMC free article] [PubMed] [Google Scholar]
- Shapiro B., Rambaut A., Drummond A. J. (2006). Choosing appropriate substitution models for the phylogenetic analysis of protein-coding sequences. Mol Biol Evol 23, 7–9 10.1093/molbev/msj021 [DOI] [PubMed] [Google Scholar]
- Smith D. J., Lapedes A. S., de Jong J. C., Bestebroer T. M., Rimmelzwaan G. F., Osterhaus A. D., Fouchier R. A. (2004). Mapping the antigenic and genetic evolution of influenza virus. Science 305, 371–376 10.1126/science.1097211 [DOI] [PubMed] [Google Scholar]
- Smith G. J., Vijaykrishna D., Bahl J., Lycett S. J., Worobey M., Pybus O. G., Ma S. K., Cheung C. L., Raghwani J. & other authors (2009). Origins and evolutionary genomics of the 2009 swine-origin H1N1 influenza A epidemic. Nature 459, 1122–1125 10.1038/nature08182 [DOI] [PubMed] [Google Scholar]
- Stöhr K. (2002). Influenza – WHO cares. Lancet Infect Dis 2, 517 10.1016/S1473-3099(02)00366-3 [DOI] [PubMed] [Google Scholar]
- Swofford D. L. (2003). paup*: Phylogenetic analysis using parsimony (and other methods), version 4. Sunderland, MA: Sinauer Associates. [Google Scholar]
- Taubenberger J. K., Morens D. M. (2006). 1918 Influenza: the mother of all pandemics. Emerg Infect Dis 12, 15–22 [DOI] [PMC free article] [PubMed] [Google Scholar]
- Tong S., Li Y., Rivailler P., Conrardy C., Castillo D. A., Chen L. M., Recuenco S., Ellison J. A., Davis C. T. & other authors (2012). A distinct lineage of influenza A virus from bats. Proc Natl Acad Sci U S A 109, 4269–4274 [DOI] [PMC free article] [PubMed] [Google Scholar]
- Varghese J. N., McKimm-Breschkin J. L., Caldwell J. B., Kortt A. A., Colman P. M. (1992). The structure of the complex between influenza virus neuraminidase and sialic acid, the viral receptor. Proteins 14, 327–332 10.1002/prot.340140302 [DOI] [PubMed] [Google Scholar]
- Wagner R., Matrosovich M., Klenk H. D. (2002). Functional balance between haemagglutinin and neuraminidase in influenza virus infections. Rev Med Virol 12, 159–166 10.1002/rmv.352 [DOI] [PubMed] [Google Scholar]
- Webster R. G., Bean W. J., Gorman O. T., Chambers T. M., Kawaoka Y. (1992). Evolution and ecology of influenza A viruses. Microbiol Rev 56, 152–179 [DOI] [PMC free article] [PubMed] [Google Scholar]
- WHO (2003). Fact sheet Number 211. Influenza http://www.who.int/mediacentre/factsheets/fs211 [Google Scholar]
- Wiley D. C., Wilson I. A., Skehel J. J. (1981). Structural identification of the antibody-binding sites of Hong Kong influenza haemagglutinin and their involvement in antigenic variation. Nature 289, 373–378 10.1038/289373a0 [DOI] [PubMed] [Google Scholar]
- Wilson I. A., Cox N. J. (1990). Structural basis of immune recognition of influenza virus hemagglutinin. Annu Rev Immunol 8, 737–771 10.1146/annurev.iy.08.040190.003513 [DOI] [PubMed] [Google Scholar]
- Xu X., Cox N. J., Bender C. A., Regnery H. L., Shaw M. W. (1996). Genetic variation in neuraminidase genes of influenza A (H3N2) viruses. Virology 224, 175–183 10.1006/viro.1996.0519 [DOI] [PubMed] [Google Scholar]
- Yang Z. (2007). paml4: phylogenetic analysis by maximum likelihood. Mol Biol Evol 24, 1586–1591 10.1093/molbev/msm088 [DOI] [PubMed] [Google Scholar]
- Zwickl D. J. (2007). Genetic algorithm approaches for the phylogenetic analysis of large biological sequence datasets under the maximum likelihood criterion PhD thesis, The University of Texas at Austin, TX, USA. [Google Scholar]