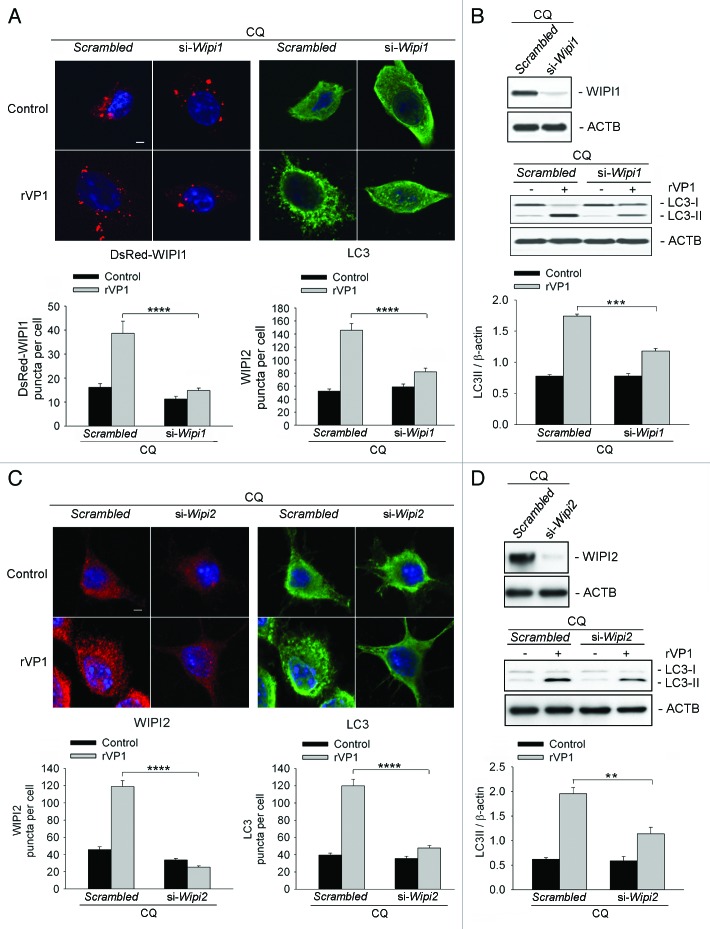
Figure 4. Both WIPI1 and WIPI2 were required for autophagy mediated by rVP1. RAW264.7 cells transfected with DsRed-Wipi1 gene and scrambled or Wipi1 siRNA were pretreated with 2 μM CQ for 30 min and then incubated with or without 4 μM rVP1 for 4 h. (A) Knockdown of WIPI1 decreased LC3 puncta formation induced by rVP1. Cells were fixed, stained with DAPI (blue) and immunolabeled with anti-LC3 followed by Alexa Fluor 488-conjugated goat anti-rabbit IgG (green). Fluorescent images were acquired by confocal microscopy. Scale bar: 2 μm. Data represent means ± SEM of quantitative analyses of DsRed-WIPI1 and LC3 puncta per cell in at least 50 cells/experiment in three independent experiments; ****p < 0.0001. (B) Knockdown of WIPI1 decreased LC3 lipidation induced by rVP1. After treatment, cell lysates were collected and the expression levels of WIPI1 and LC3-II were determined by western blot analysis. ACTB was used as a loading control. Data represent the means ± SEM of densitometric measurement of LC3-II/ACTB from three independent experiments; ***p < 0.001. (C) Knockdown of WIPI2 decreased LC3 puncta formation in rVP1-treated cells. RAW264.7 cells transfected with scrambled or Wipi2 siRNA were pretreated with 2 μM CQ for 30 min and then incubated with or without 4 μM rVP1 for 4 h and then fixed, stained with DAPI (blue) and immunolabeled with anti-WIPI2 and anti-LC3 followed by rhodamine-conjugated goat anti-mouse IgG (red) and Alexa Fluor 488-conjugated goat anti-rabbit IgG (green). Fluorescent images were acquired by confocal microscopy. Scale bar: 2 μm. Data represent means ± SEM of WIPI2 and LC3 puncta per cell in at least 50 cells/experiment in three independent experiments; ****p < 0.0001. (D) Knockdown of WIPI2 decreased LC3 lipidation in rVP1-treated cells. After treatment, cell lysates were collected and expression levels of WIPI2 and LC3-II were determined by western blot analysis. ACTB was used as a loading control. Data represent means ± SEM of the ratio of LC3-II/ACTB from three independent experiments; **p < 0.01.

An official website of the United States government
Here's how you know
Official websites use .gov
A
.gov website belongs to an official
government organization in the United States.
Secure .gov websites use HTTPS
A lock (
) or https:// means you've safely
connected to the .gov website. Share sensitive
information only on official, secure websites.
