Abstract
Objective
The objective of this retrospective study was to develop and validate a simple diagnostic prediction model by using ultrasound (US) features of thyroid nodules obtained from multicenter retrospective data.
Materials and Methods
Patient data were collected from 20 different institutions and the data included 2000 thyroid nodules from 1796 patients. For developing a diagnostic prediction model to estimate the malignant risk of thyroid nodules using suspicious malignant US features, we developed a training model in a subset of 1402 nodules from 1260 patients. Several suspicious malignant US features were evaluated to create the prediction model using a scoring tool. The scores for such US features were estimated by calculating odds ratios, and the risk score of malignancy for each thyroid nodule was defined as the sum of these individual scores. Later, we verified the usefulness of developed scoring system by applying into the remaining 598 nodules from 536 patients.
Results
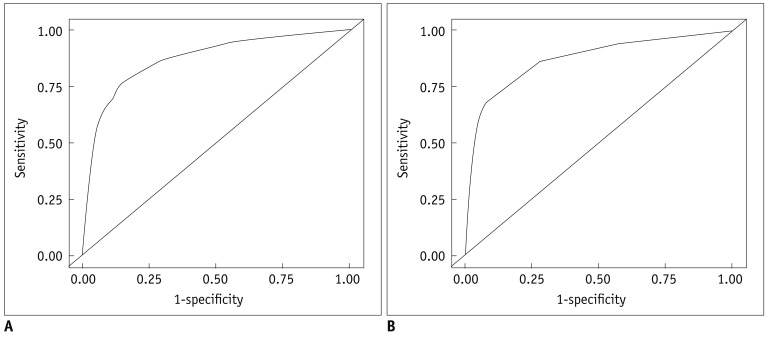
Among 2000 tumors, 1268 were benign and 732 were malignant. In our multiple regression analysis models, the following US features were statistically significant for malignant nodules when using the training data set: hypoechogenicity, marked hypoechogenicity, non-parallel orientation, microlobulated or spiculated margin, ill-defined margins, and microcalcifications. The malignancy rate was 7.3% in thyroid nodules that did not have suspicious-malignant features on US. Area under the receiver operating characteristic (ROC) curve was 0.867, which shows that the US risk score help predict thyroid malignancy well. In the test data set, the malignancy rates were 6.2% in thyroid nodules without malignant features on US. Area under the ROC curve of the test set was 0.872 when using the prediction model.
Conclusion
The predictor model using suspicious malignant US features may be helpful in risk stratification of thyroid nodules.
Keywords: Thyroid, Ultrasound, Thyroid cancer
INTRODUCTION
Ultrasound (US) is the best diagnostic choice in the initial evaluation of thyroid nodules. Although US is an operator-dependent diagnostic tool, several reports show relatively good interobserver agreement in reaching a final assessment for thyroid nodules (1-4). Recently, the thyroid imaging reporting and data system (TIRADS) was developed in several studies to be used in risk stratification of thyroid nodules using various US features (5-8). Similar to TIRADS, there are several reporting systems in other medical fields, such as Breast Imaging Reporting and Data System (BI-RADS) for evaluating breast lesions and the Bethesda system for examining the cytology of a thyroid nodule (9, 10). The goal of these reporting systems is standardization and simplification of the reports, allowing effective communication between the reporting doctors, such as radiologists, cytologists, and clinicians (9, 10).
Although the TIRADS system has been demonstrated in several studies, the system used in each study lacked reproducibility, because each was developed based on the individual institution (5-8). Several factors, such as the use of different US equipment, different US criteria in assessing thyroid nodules, as well as the inevitable interobserver variability among radiologists, can have an effect on the final assessment of thyroid nodules. However, the various TIRADS systems that have been reported are not capable of considering these factors. The purpose of this study was to develop and to validate a simple diagnostic prediction model using features of thyroid nodules found on US and based on multicenter retrospective data.
MATERIALS AND METHODS
The institutional review board approval was obtained from all participating institutions for this retrospective study; due to the nature of the study, the informed consent requirement was waived.
Study Preparations
On 23 January 2011 and 11 March 2011, radiologists of the Korean Society of Thyroid Radiology (KSThR) held meetings to develop a consensus on the study design and population. While many US features were considered by the participating radiologists, these conferences were convened to develop a TIRADS to categorize thyroid nodules in order to stratify the risk of malignancy in Nodulesthyroid nodules. Participants of the meetings were selected among the members of the KSThR, which had more than 5-years of experience in thyroid imaging. All participants acknowledged the importance of developing the TIRADS.
During the meetings, discussion was focused on 2 topics: first, the inclusion criteria, and second, the US features to be analyzed in this study. The participants came to a consensus through majority voting.
Study Population
Patient data were collected from 20 radiologists based at 12 hospitals (9 university-affiliated hospitals and 3 hospitals). Several aspects were considered in calculating an adequate sample size in forming a predicted model using US features of thyroid nodules. First, 18 US features were considered in constructing a prediction model during logistic regression based on the study by Moon et al. (11). Second, we assumed that the prevalence of malignancy on fine-needle aspiration (FNA) to be 16% (11). Third, since prediction models need validation, our data was split into 2 sets; a training set for model building (70% of the total data included), and a test set for validation (30%). Based on these factors, we calculated more than 1600 nodules were required to power for statistical appropriateness of this study. According to these calculations, which were discussed during the each conference, each participating radiologist agreed to contribute at least 100 consecutive thyroid nodules for this multicenter study; the requirements for a contributing nodule which were: 1) equal or more than 5 mm in the longest diameter on US, and 2) had undergone US-FNA in their institution during the study period during which the data was to have been gathered, which was between January 2007 and December 2008. Finally, this study included 2000 thyroid nodules in 1796 patients. Of the 2000 nodules, 1268 (63.4%) were benign and 732 (36.6%) were malignant. If any of the participants were affiliated with the same institution, subsequent data were collected to avoid data overlap. Patients included in this study had to meet one or more of the following criteria: 1) patients who underwent thyroid surgery regardless of cytologic results, 2) patients who had benign results on cytology at least twice, and 3) patients who had benign results on cytology and showed no change or decreased size at follow-up US for at least a year. The increase in size was defined as more than a 50% increase in volume or more than a 20% increase in at least 2 dimensions that show at least a 2 mm increase in solid nodules or the solid portion in mixed nodules (12, 13).
Imaging and Imaging Analyses
Ultrasound images were taken using various US machines with high frequency linear array transducer for the evaluation of thyroid nodules. The scanning protocol in all cases included both transverse and longitudinal real-time imaging of the thyroid nodules, with the use of representative Digital Imaging and Communications in Medicine images.
For analysis of the US images, participants were asked to assess the thyroid nodules according to the criteria from published literature (11, 12, 14-21). The criteria used in analysis included size (equal or larger than 5 mm), composition, echogenicity of solid portion, orientation, shape, margin, and calcifications. Composition of a nodule was categorized according to the ratio of the cystic portion to the solid portion in the nodule: solid (≤ 10% cystic), predominantly solid (> 10% cystic and ≤ 50% cystic), predominantly cystic (> 50% cystic) and spongiform appearance. A spongiform appearance was defined as the aggregation of multiple microcystic components consisting more than 50% of total volume of the nodule (11). Echogenicity of the solid portion was classified as hyper- or isoechogenicity, hypoechogenicity, or marked hypoechogenicity. When the echogenicity of the nodule was similar to the surrounding thyroid parenchyma, it was classified as isoechogenicity. Marked hypoechogenicity was defined as decreased echogenicity compared to the strap muscles (16). Orientation was categorized as non-parallel (greater in its anteroposterior dimension than transverse dimension) or parallel. Shape of the nodule was categorized as ovoid to round (when the anteroposterior diameter of the nodule was equal to or less than its transverse diameter on a transverse or longitudinal plane) and irregular (when a nodule was not ovoid to round). Margins were classified as well-defined smooth, microlobulated or spiculated, or ill-defined (11). Calcifications were categorized as microcalcifications, macrocalcifications, or none. Microcalcifications were defined as calcifications that were equal to or less than 1 mm in diameter, which was visualized as tiny, punctate hyperechoic foci, either with or without acoustic shadows. If tiny bright reflectors with a clear-cut comet-tail artifact were present on conventional US, we considered these as colloid. Macrocalcifications were defined as hyperechoic foci larger than 1 mm, including rim or eggshell calcifications. When the nodules had both types of calcifications (macrocalcifications including rim calcifications intermingled with microcalcifications), the nodule was considered to have microcalcifications.
Data and Statistical Analysis
The statistical analyses of this study consisted of 3 steps. First, the association between gender and malignancy using the chi-square test, and the association between patient age or nodule size and malignancy using an independent two-sample t test was evaluated in all the included patients. Following this, a statistician (J. I.) randomly selected a subset of 1402 nodules from 1260 patients to constitute a training model among the 2000 nodules. The remaining 598 nodules in 536 patients were used as a test set for validation of the training model. The second step was to evaluate the malignancy risk of the independent US features using multiple logistic regression analysis after controlling for all US features, and to get a predicted probability from the analysis. Odds ratios (ORs) and 95% confidence intervals (CIs) of each US feature were calculated. For risk score analyses, ORs for each US feature from the final logistic regression model was used. All ORs were standardized to make the scores approach an integer - 1 and to make it easier to use. The lowest value was 0, which indicated that US features were not to predictive of malignancy. The risk score for each nodule was obtained by summing the scores of each of suspicious US feature. At the next step, we established a diagnostic prediction model to estimate the malignant risk of thyroid nodules, using suspicious malignant US features in the training set for model building. The final step was to validate the prediction model from the training set using the test set. Here, we evaluated the diagnostic performances, as well as the predicted probability of the test set. We calculated the area under the receiver operating characteristic (ROC) curve (Az) with 95 % confidence interval (CI) using the US risk score for both the training and test sets.
Analysis was performed using the SAS software (version 9.2; SAS Institute, Cary, NC, USA). Statistical significance was assumed when the p value was less than 0.05. All reported p values are 2-sided.
RESULTS
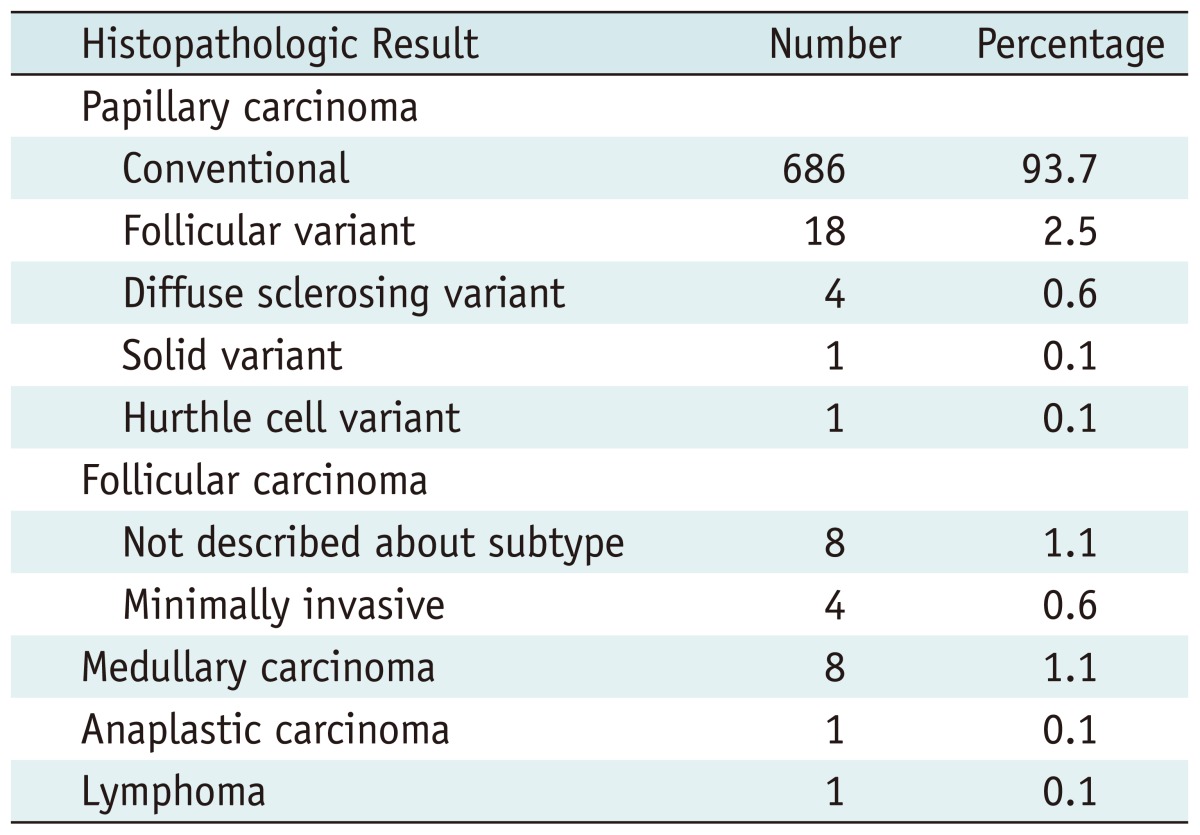
The pathologic diagnoses of 732 thyroid cancers are listed in Table 1. The mean size of the benign nodules were 17.3 ± 11.7 mm, which was significantly larger than that of malignant nodules, 10.9 ± 8 mm (p < 0.001). Patients with malignant nodules (49 ± 12.3 years) were significantly younger than those with benign nodules (50.5 ± 11.9 years, p = 0.01). There was no statistically significant relationship between the gender and malignancy.
Table 1.
Histopathologic Results of 732 Malign
Model Building Using Training Data Set
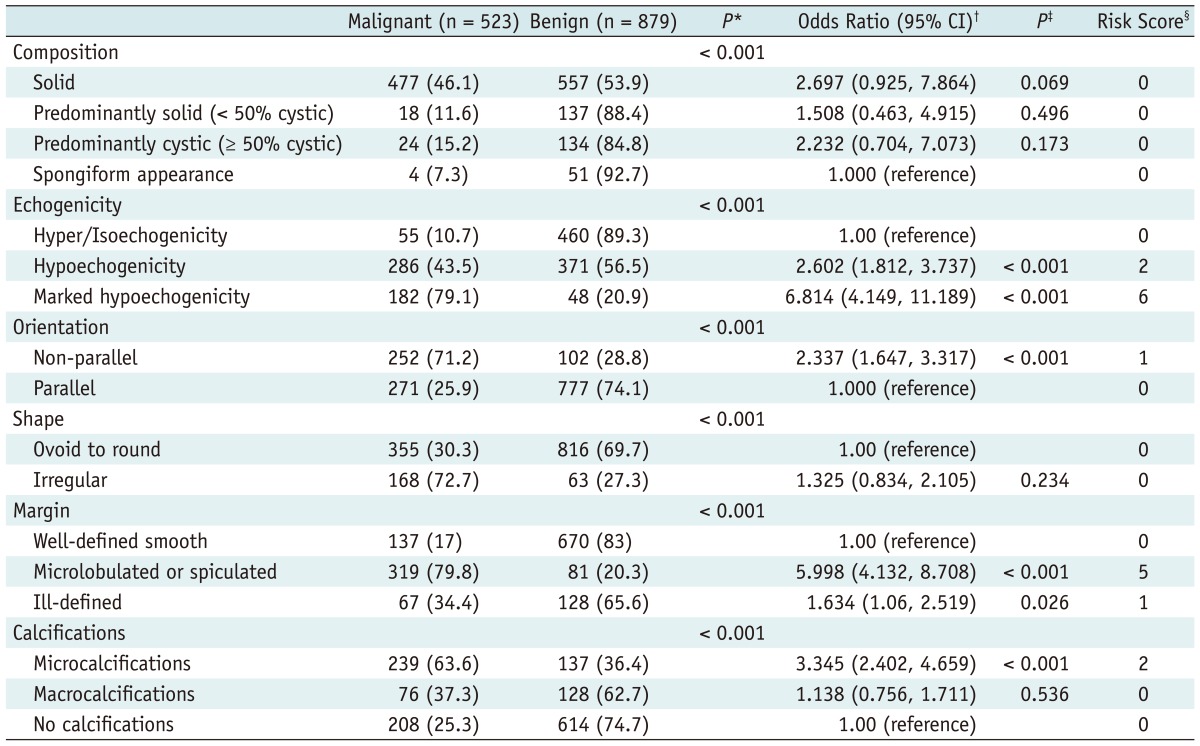
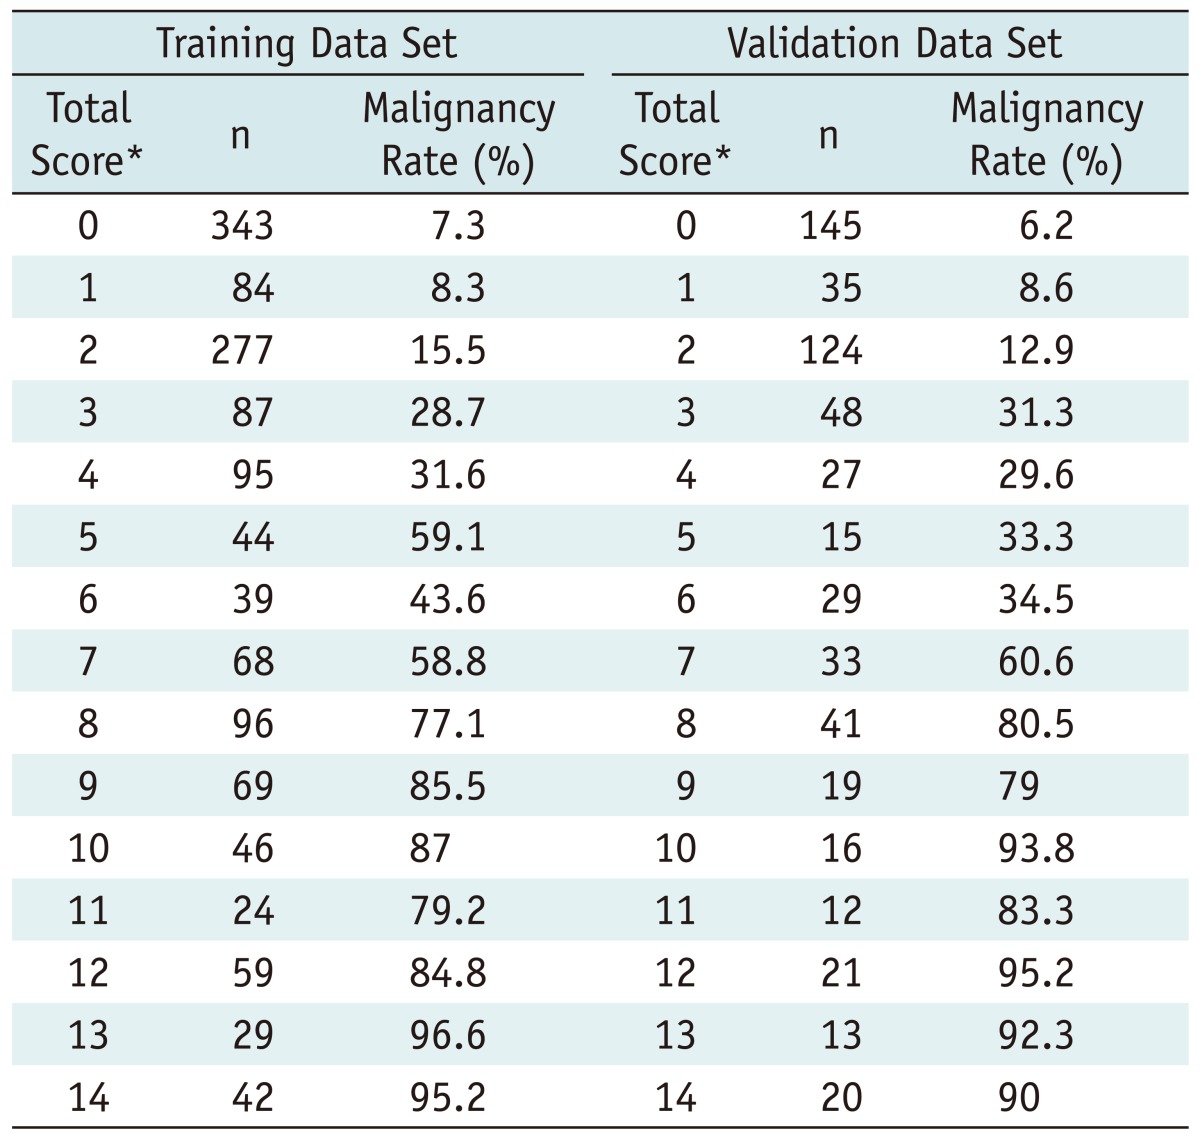
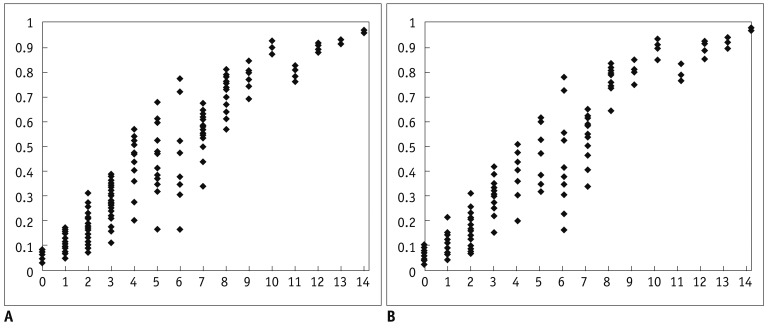
The association between US features and malignancy is summarized in Table 2. On multiple regression analysis, hypoechogenicity, marked hypoechogenicity, non-parallel orientation, microlobulated or spiculated margin, ill-defined margin, microcalcifications were US features showing statistical significance. Microlobulated or spiculated margin and marked hypoechogenicity showed high OR of greater than 5, respectively. Table 3 shows the malignancy rate according to the US risk score. Malignancy rates were 7.3 in thyroid nodules with no suspicious US feature. Among each suspicious US feature, malignancy rates were 8.3 in thyroid nodules with either non-parallel orientation or ill-defined margin, 59.1 in thyroid nodules with microlobulated or spiculated margin, and 43.6 in thyroid nodules with marked hypoechogenicity. The malignancy rate was higher in the thyroid nodule showing suspicious malignant US features with a high OR, such as marked hypoechogenicity, microlobulated or spiculated margin than one with two or more suspicious malignant US features with low OR such as hypoechogenicity, non-parallel orientation, ill-defined margin, and microcalcifications. The malignancy rate was highest, 95.2, in a thyroid nodule showing marked hypoechogenicity, non-parallel orientation, microlobulated or spiculated margin, and microcalcifications. The predicted probability of malignancy tended to rise along with the risk score (Fig. 1A). Area under the ROC curve was 0.867 (95% CI, 0.846-0.887; Fig. 2A), which shows that the US risk score predicts thyroid malignancy well.
Table 2.
Association Between Thyroid Malignancy and Various Sonographic Features at Thyroid Nodules of Training Data Set on Multiple Logistic Regression and Risk Score Analysis
Note.- *By chi-square test, †,‡By multiple logistic regression analysis, §To create a risk score, reference categories for each ultrasound feature are those that had lowest rate of benignity. Each category is compared to assigned reference group to calculate odds ratio of thyroid malignancy. Risk score was calculated as nearest integer - 1. CI = confidence interval, number in parenthesis is percent.
Table 3.
Malignancy Rate of Malignancy by Total Score on Multiple Logistic Regression Model in Training and Validation Data Set
Note.- *Sum of all scores of individual items
Fig. 1.
Scatter plots of predicted probability by total score. Predicted probability of malignancy tended to increase as risk score increased in both data sets. A. Training data set. B. Validation data set.
Fig. 2.
Receiver operating characteristic (ROC) curves for training and validation data set based on risk scores from logistic regression model.
A. Area under curve is 0.867 at training data set. B. Area under curve is 0.872 at validation data set.
Model Validation
Among the 598 nodules in 536 patients used as a test set, the malignancy rate was 6.2 in thyroid nodules with no suspicious US feature. The malignancy rate was 8.6 in thyroid nodules with either non-parallel orientation or ill-defined margin, 33.3 in thyroid nodules with microlobulated or spiculated margin, and 34.5 in thyroid nodules with marked hypoechogenicity (Table 3). The predicted probability of malignancy also tended to rise along with the US risk scores (Fig. 1B). The Az value of the test set was 0.872 (95% CI, 0.841-0.903; Fig. 2B) using the prediction model.
DISCUSSION
Until now, 3 TIRADS systems (5-7) and one 5-point malignancy rating scale system (8) have been developed in reporting thyroid nodules using US. The first one was constructed using standardized 10 US patterns and correlated the malignancy risk of the US patterns (5). Horvath et al's study seems simple, but it has limitations in that too many US features should be converted into these stereotypic 10 US patterns to assume their malignancy risk, which sometimes is difficult to do. Park et al. (6) presented with the TIRADS system, which was established using multiple logistic regression analysis. The resulting equation may be accurate, but is a very complex process if applied during daily practice. To make it easier and more applicable, the number of suspicious malignant US features was calculated in Kwak et al. (7). The main limitation of Kwak et al's study was that each suspicious US feature was summed as the same weight, even though each US feature has a different probability of malignancy. Therefore, the risk of malignancy was higher in a thyroid nodule with one suspicious US feature, such as a microcalcification or microlobulated margin than for a thyroid module with 2 suspicious malignant US features (solid composition and hypoechogenicity). Hambly et al. (8) was based on the observer's experience alone, not on the analysis of specific US features, therefore, failing to function as a concrete guideline for thyroid nodules.
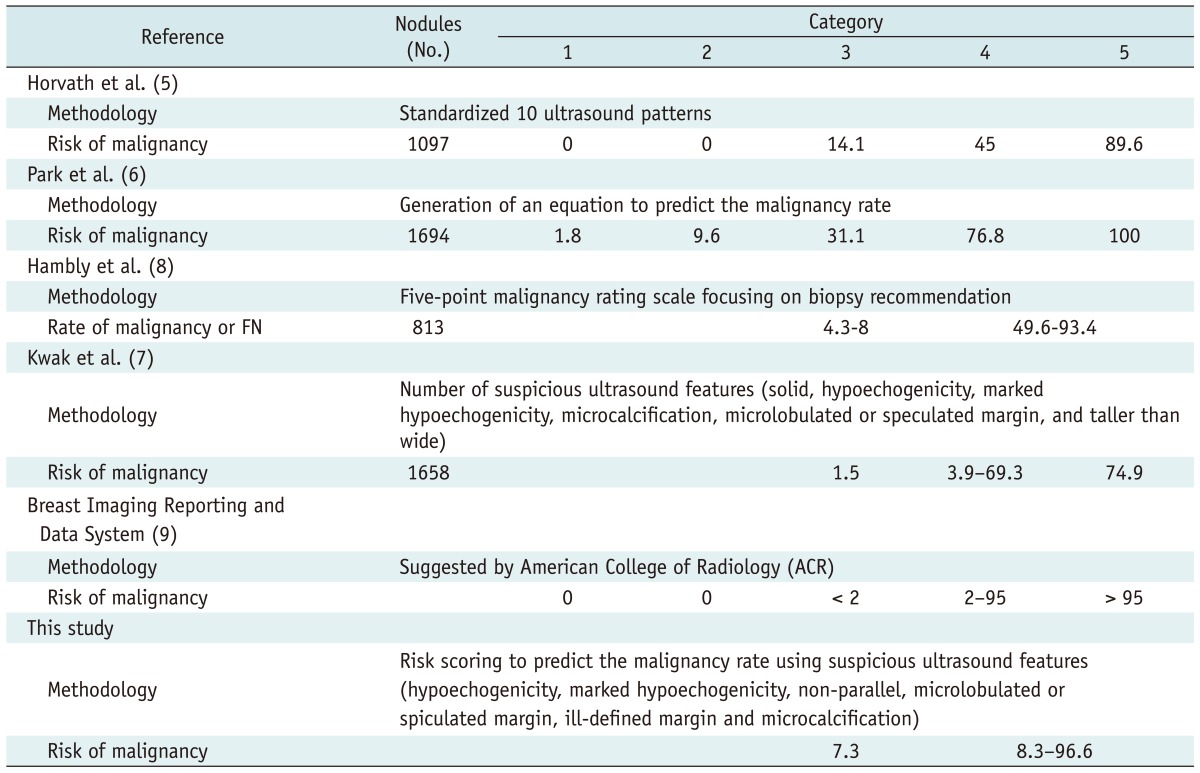
To overcome the shortcomings of the previous studies, we have established a simple diagnostic prediction model using US features of thyroid nodules based on a multicenter data collected retrospectively. In this study, each suspicious US feature had a different risk score according to their ORs in thyroid malignancy. Using the prediction model proposed in this study, we can obtain the risk of malignancy in thyroid nodules by the calculated total score, which is comparable to previous studies (Table 4). Similar to BI-RADS used in breast nodules, TIRADS should provide a proper guideline in deciding whether to perform FNA or not in a thyroid nodule. All TIRADS recommend performing FNA in a thyroid nodule categorized as 4 or 5. The risk of malignancy was 6.2% among category 3 nodules in this study, which was lower than those of Horvath et al. and Park et al. (14.1% and 31.1%, respectively) (5, 6), however, similar to Hambly et al. (4.3-8%) (8), and higher than Kwak et al. (1.5%) (7). Like the previous studies in which risk of malignancy increased proportionally to the number of suspicious malignant US features, this study shows the tendency of increased predicted probability of malignancy along with the increase of risk scores. In this study, we calculated the area under the curve of a validation data set to assess the accuracy of predicting thyroid malignancy, using the prediction model derived from a total risk score. The value was 0.872, which was similar to those of Hambly et al. (8) (0.794-0.904) where results were calculated among 7 radiologists with different levels of experience.
Table 4.
Malignancy Rate According to Category in Several Reporting Systems
Note.- FN = follicular neoplasm
Although the American College of Radiology (ACR) recommends a specific malignancy risk range in breast lesions according to each assessment category of BI-RADS, we still do not have an established guideline proposing a specific malignant risk that can be used to safely avoid FNA in a thyroid nodule. TIRADS is similar to BI-RADS, but the malignant risk cannot be used as an identical concept, since the clinical aggressiveness is unquestionably different between breast and thyroid cancer. Considering the previously established TIRADS (5-8), the results of this multicenter study suggests a new approach in malignant risk stratification in a thyroid nodule within the proper range of malignancy risk, as well as complementing the limitations of the complexity of TIRADS.
This study has several limitations. First, selection bias may have existed when choosing patients to enroll in this study. Some patients who had not undergone follow-up after being confirmed as benign on cytology or when they had not undergone surgery after malignant cytology results were not included in this study. Second, we regarded the nodules, which were benign on initial cytology and stable for at least a year as benign. False-negative results may have existed among the cytology results (22-25), which may have had effect on our results. Third, interobserver variability in interpretations of US images among the 20 radiologists were not evaluated. Furthermore, radiologists involved in this study had more than 5 years of experiences in thyroid imaging; therefore, the results of other institutions may not be reproducible as in our study. Fourth, the malignancy rate of thyroid nodules included in this study was relatively high, 36.6%, comparing to those of other studies (9.2-13%) (14, 26). The high prevalence of malignancy in this study may affect the malignancy rate of each risk score in this study. Fifth, we did not evaluate the US features that are suggestive of benign nodules. A spongiform appearance in a thyroid nodule was represented as a benign features in previous studies, with a nearly 100% positive predictive value (11, 27). However, the malignancy rate of thyroid nodules with spongiform appearance was 7.3% in our study, which was in contrast with previous reports. Interobserver variability during interpretation of US features may have lead to this discrepant result (3).
In conclusion, the predictor model from this multicenter data using suspicious malignant US features may be helpful in risk stratification in a thyroid nodule.
References
- 1.Park SH, Kim SJ, Kim EK, Kim MJ, Son EJ, Kwak JY. Interobserver agreement in assessing the sonographic and elastographic features of malignant thyroid nodules. AJR Am J Roentgenol. 2009;193:W416–W423. doi: 10.2214/AJR.09.2541. [DOI] [PubMed] [Google Scholar]
- 2.Wienke JR, Chong WK, Fielding JR, Zou KH, Mittelstaedt CA. Sonographic features of benign thyroid nodules: interobserver reliability and overlap with malignancy. J Ultrasound Med. 2003;22:1027–1031. doi: 10.7863/jum.2003.22.10.1027. [DOI] [PubMed] [Google Scholar]
- 3.Choi SH, Kim EK, Kwak JY, Kim MJ, Son EJ. Interobserver and intraobserver variations in ultrasound assessment of thyroid nodules. Thyroid. 2010;20:167–172. doi: 10.1089/thy.2008.0354. [DOI] [PubMed] [Google Scholar]
- 4.Lee MJ, Hong SW, Chung WY, Kwak JY, Kim MJ, Kim EK. Cytological results of ultrasound-guided fine-needle aspiration cytology for thyroid nodules: emphasis on correlation with sonographic findings. Yonsei Med J. 2011;52:838–844. doi: 10.3349/ymj.2011.52.5.838. [DOI] [PMC free article] [PubMed] [Google Scholar]
- 5.Horvath E, Majlis S, Rossi R, Franco C, Niedmann JP, Castro A, et al. An ultrasonogram reporting system for thyroid nodules stratifying cancer risk for clinical management. J Clin Endocrinol Metab. 2009;94:1748–1751. doi: 10.1210/jc.2008-1724. [DOI] [PubMed] [Google Scholar]
- 6.Park JY, Lee HJ, Jang HW, Kim HK, Yi JH, Lee W, et al. A proposal for a thyroid imaging reporting and data system for ultrasound features of thyroid carcinoma. Thyroid. 2009;19:1257–1264. doi: 10.1089/thy.2008.0021. [DOI] [PubMed] [Google Scholar]
- 7.Kwak JY, Han KH, Yoon JH, Moon HJ, Son EJ, Park SH, et al. Thyroid imaging reporting and data system for US features of nodules: a step in establishing better stratification of cancer risk. Radiology. 2011;260:892–899. doi: 10.1148/radiol.11110206. [DOI] [PubMed] [Google Scholar]
- 8.Hambly NM, Gonen M, Gerst SR, Li D, Jia X, Mironov S, et al. Implementation of evidence-based guidelines for thyroid nodule biopsy: a model for establishment of practice standards. AJR Am J Roentgenol. 2011;196:655–660. doi: 10.2214/AJR.10.4577. [DOI] [PubMed] [Google Scholar]
- 9.American College of Radiology. Breast imaging reporting and data system, breast imaging atlas. 4th ed. Reston: American College of Radiology; 2003. [Google Scholar]
- 10.Cibas ES, Ali SZ. The Bethesda System for Reporting Thyroid Cytopathology. Thyroid. 2009;19:1159–1165. doi: 10.1089/thy.2009.0274. [DOI] [PubMed] [Google Scholar]
- 11.Moon WJ, Jung SL, Lee JH, Na DG, Baek JH, Lee YH, et al. Benign and malignant thyroid nodules: US differentiation--multicenter retrospective study. Radiology. 2008;247:762–770. doi: 10.1148/radiol.2473070944. [DOI] [PubMed] [Google Scholar]
- 12.American Thyroid Association (ATA) Guidelines Taskforce on Thyroid Nodules and Differentiated Thyroid Cancer. Cooper DS, Doherty GM, Haugen BR, Kloos RT, Lee SL, et al. Revised American Thyroid Association management guidelines for patients with thyroid nodules and differentiated thyroid cancer. Thyroid. 2009;19:1167–1214. doi: 10.1089/thy.2009.0110. [DOI] [PubMed] [Google Scholar]
- 13.Brauer VF, Eder P, Miehle K, Wiesner TD, Hasenclever H, Paschke R. Interobserver variation for ultrasound determination of thyroid nodule volumes. Thyroid. 2005;15:1169–1175. doi: 10.1089/thy.2005.15.1169. [DOI] [PubMed] [Google Scholar]
- 14.Frates MC, Benson CB, Charboneau JW, Cibas ES, Clark OH, Coleman BG, et al. Management of thyroid nodules detected at US: Society of Radiologists in Ultrasound consensus conference statement. Radiology. 2005;237:794–800. doi: 10.1148/radiol.2373050220. [DOI] [PubMed] [Google Scholar]
- 15.Gharib H, Papini E, Paschke R, Duick DS, Valcavi R, Hegedüs L, et al. American Association of Clinical Endocrinologists, Associazione Medici Endocrinologi, and EuropeanThyroid Association Medical Guidelines for Clinical Practice for the Diagnosis and Management of Thyroid Nodules. Endocr Pract. 2010;16(Suppl 1):1–43. doi: 10.4158/10024.GL. [DOI] [PubMed] [Google Scholar]
- 16.Kim EK, Park CS, Chung WY, Oh KK, Kim DI, Lee JT, et al. New sonographic criteria for recommending fine-needle aspiration biopsy of nonpalpable solid nodules of the thyroid. AJR Am J Roentgenol. 2002;178:687–691. doi: 10.2214/ajr.178.3.1780687. [DOI] [PubMed] [Google Scholar]
- 17.Papini E, Guglielmi R, Bianchini A, Crescenzi A, Taccogna S, Nardi F, et al. Risk of malignancy in nonpalpable thyroid nodules: predictive value of ultrasound and color-Doppler features. J Clin Endocrinol Metab. 2002;87:1941–1946. doi: 10.1210/jcem.87.5.8504. [DOI] [PubMed] [Google Scholar]
- 18.Moon WJ, Baek JH, Jung SL, Kim DW, Kim EK, Kim JY, et al. Ultrasonography and the ultrasound-based management of thyroid nodules: consensus statement and recommendations. Korean J Radiol. 2011;12:1–14. doi: 10.3348/kjr.2011.12.1.1. [DOI] [PMC free article] [PubMed] [Google Scholar]
- 19.Cappelli C, Castellano M, Pirola I, Cumetti D, Agosti B, Gandossi E, et al. The predictive value of ultrasound findings in the management of thyroid nodules. QJM. 2007;100:29–35. doi: 10.1093/qjmed/hcl121. [DOI] [PubMed] [Google Scholar]
- 20.Cappelli C, Castellano M, Pirola I, Gandossi E, De Martino E, Cumetti D, et al. Thyroid nodule shape suggests malignancy. Eur J Endocrinol. 2006;155:27–31. doi: 10.1530/eje.1.02177. [DOI] [PubMed] [Google Scholar]
- 21.Chan BK, Desser TS, McDougall IR, Weigel RJ, Jeffrey RB., Jr Common and uncommon sonographic features of papillary thyroid carcinoma. J Ultrasound Med. 2003;22:1083–1090. doi: 10.7863/jum.2003.22.10.1083. [DOI] [PubMed] [Google Scholar]
- 22.Caruso D, Mazzaferri EL. Fine needle aspiration biopsy in the management of thyroid nodules. Endocrinologist. 1991;1:194–202. [Google Scholar]
- 23.Kwak JY, Koo H, Youk JH, Kim MJ, Moon HJ, Son EJ, et al. Value of US correlation of a thyroid nodule with initially benign cytologic results. Radiology. 2010;254:292–300. doi: 10.1148/radiol.2541090460. [DOI] [PubMed] [Google Scholar]
- 24.Gharib H, Goellner JR. Fine-needle aspiration biopsy of the thyroid: an appraisal. Ann Intern Med. 1993;118:282–289. doi: 10.7326/0003-4819-118-4-199302150-00007. [DOI] [PubMed] [Google Scholar]
- 25.Hamburger JI, Hamburger SW. Fine needle biopsy of thyroid nodules: avoiding the pitfalls. N Y State J Med. 1986;86:241–249. [PubMed] [Google Scholar]
- 26.Chung WY, Chang HS, Kim EK, Park CS. Ultrasonographic mass screening for thyroid carcinoma: a study in women scheduled to undergo a breast examination. Surg Today. 2001;31:763–767. doi: 10.1007/s005950170044. [DOI] [PubMed] [Google Scholar]
- 27.Moon WJ, Kwag HJ, Na DG. Are there any specific ultrasound findings of nodular hyperplasia ("leave me alone" lesion) to differentiate it from follicular adenoma? Acta Radiol. 2009;50:383–388. doi: 10.1080/02841850902740940. [DOI] [PubMed] [Google Scholar]


