

Abstract
The nature and mechanism of phosphate hydrolysis reactions are of great interest in view of the crucial role of these reactions in key biological processes. While it is becoming clearer that the ultimate way of resolving mechanistic controversies must involve reliable theoretical studies, it is not widely realized that such studies cannot be performed by using most existing automated ways and that only careful systematic mapping approach can lead to meaningful conclusions. The present work clarifies the above point by considering the hydrolysis of phosphate monoesters. The clarification starts by defining the actual issues that should be addressed in careful studies, and by highlighting the problems with studies that ignore the need for unique mechanistic definitions (e.g., works that confuse associative and dissociative pathways). We then focus on the analysis of the proton transfer (PT) pathways in phosphate hydrolysis and on recent suggestions that PT involves more than one water molecule. Here we point out that most of the studies that found a proton transfer through several water molecules have not involved a systematic search of the relevant reaction coordinates. This includes both energy minimization approaches as well as a recent metadynamics (MTD) simulation study. To illustrate the crucial need of exploring the potential surfaces reliably, rather than relying on automated approaches, we present here a very careful study of the free energy landscape along a 3D reaction coordinate (RC) exploring both the standard 2D RC, comprised of the attacking and leaving group reaction coordinates, as well as of the proton transfer (PT) coordinate. Our study points out that that QM/MM minimization or MTD studies, that concluded that the hydrolysis of phosphate monoesters involves a PT through several water molecules, have not explored the single water (1W) path (that involves a direct PT form the attacking water molecule to the phosphate oxygen). Furthermore, we identified the most likely reason for the difficulty in finding the 1W path by QM/MM minimization methods, as well as by the current MTD simulations. We also discuss the problems with current studies that challenge the phosphate as a base mechanism. Perhaps most importantly, we clarify and illustrate that crucial mechanistic problems with alternative pathways should not be explored by running black box search approaches.
Keywords: phosphate hydrolysis, associative and dissociative mechanisms, quantum mechanics/molecular mechanics, proton transfer reaction coordinate, direct and water assisted proton transfer pathways
I. Introduction
Phosphate hydrolysis reactions are arguably the most important class of biological reactions,1–7 and it is thus important to elucidate the mechanism of such reactions in solution and in proteins. In this respect, it is now gradually realized that quantum mechanical and combined quantum mechanical/molecular mechanics (QM/MM) studies are most probably the only way of resolving the fundamental mechanistic controversies associated with phosphate hydrolysis. However, this does not mean that just running uncritical black-box QM/MM-based calculations can be used to resolve any deep mechanistic issues. In fact, it seems that some in the theoretical community have not yet gained the perspective and experience of the experimental community, where it is a common practice to look carefully at all the possible alternative options. Instead, it is sometimes assumed that the results obtained by a specific computational method must represent the reality. The problem with such uncritical theoretical studies of phosphate hydrolysis by many irrelevant gas phase studies8–10 and subsequently by some energy minimization studies11 are rather obvious (see discussion in Ref.12). Furthermore, even recent studies that involve some configurational sampling,13–15 are far from providing a reliable mechanistic picture. This is largely due to the fact that these studies have mainly focused on exploring limited mechanistic pathways rather than exploring all the possible options. This can be very problematic especially when there are several earlier proposals in the literature (e.g., 12, 16, 17). In the case of phosphate monoester hydrolysis, the debate involves two issues: first, it is not clear whether the hydrolysis follows an associative or a dissociative path (unfortunately, most of the studies failed to identify the clear distinction between these two), and second, it is not clear whether the proton transfer (PT) from the attacking nucleophilic water molecule to the γ-phosphate oxygen occur in a direct manner or with the assistance of several water molecules. Thus it is clearly not sufficient (or useful) to explore a PT between several water molecules while not examining carefully a transfer from a single water molecule. Thus, it is important to try to clarify what are the problems and to present a clear benchmark that can be examined by those who are truly interested in the nature of phosphate hydrolysis reactions.
The basic issues in the mechanism of the hydrolysis of phosphate monoesters and in related systems can be formulated clearly and uniquely by considering the structural models presented in Fig. 1, where R1 represents the nuclear reaction coordinate between the Pγ and the leaving Ow atoms, R2 describes the nuclear reaction coordinate between the Pγ and the attacking nucleophilic Ow atom and the PT reaction coordinate is designated by X. As described above, the PT can occur along the associative or dissociative paths in either a direct manner (1W) or with the assistance of the second water molecule (2W) (this case is also taken as a representation of PT that involves even more water molecules). Both these cases are depicted in Fig. 1A and Fig. 1B respectively. Traditionally, the transition states of phosphate hydrolysis have been classified as associative or dissociative, depending on the relative distances of R1 and R2. This definition is related to the More O’Ferrall-Jencks (MOFJ) type surfaces17 which are illustrated in Figs. 2 and 3 for 1W and 2W cases, respectively. The representative structures corresponding to the characteristic points all along the reaction pathways are also depicted explicitly in Figs. 2 and 3 for the respective cases. The reaction coordinates R1 and R2 appear to provide a more unique picture than that obtained by using bond orders or Leffler indices such as those used by Williams et al.18 The requirement for a unique formulation cannot be overstated as softer definitions lead to major confusions with clear terms like associative and dissociative being replaced by “loose” and “tight” terms19–23 (see discussion in Ref.12). Here it is crucial to insist on keeping the original definition according to the shape of the surface. With this in mind, we can move to resolve the main current valid controversies (after clarifying common confusions).
Figure 1.
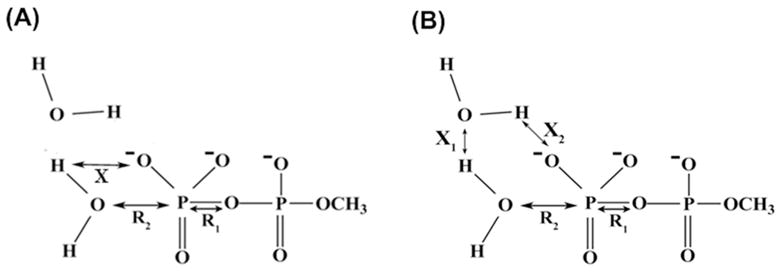
Structural models used in this study to demonstrate the hydrolysis of monomethyl pyrophosphate trianion in solution. R1, R2, and X define the three reaction coordinates, which explicitly will be varied during the course of the reaction. (A) represents the structural model where the proton has been directly transferred from the attacking nucleophilic water molecule to the substrate phosphate oxygen atom (direct PT (1W) mechanism). (B) represents the structural model where the proton transfer occurs through the assistance of an additional water molecule (water assisted PT (2W) mechanism).
Figure 2.

A schematic description of the potential energy surface for the hydrolysis of monomethyl pyrophosphate trianion utilizing the direct PT mechanism. The figure provides a clear definition of the associative, dissociative, and concerted pathways. Representative geometries corresponding to the key characteristic points along the potential energy surface are also depicted. Note that for simplicity we do not show here the additional water molecule that is involved explicitly in the 2W process.
Figure 3.

A schematic description of the potential energy surface for the hydrolysis of monomethyl pyrophosphate trianion utilizing the water assisted PT mechanism. The pathways corresponding to the associative, dissociative, and concerted mechanisms are clearly defined and the representative geometries corresponding to the key characteristic points along the potential energy surface are also depicted.
Arguably, the most extensive and systematic computational studies of the relevant surfaces12, 16, 17 found a similar barrier for the associative and concerted paths and with a proton transfer from the attacking water molecule to the phosphate oxygen (see Fig. 2). Now, ignoring the irrelevant and problematic works discussed in Ref.12 we will focus on a few recent studies that actually have presented some alternative views. This is done with the help of Fig. 5 that temporarily “avoids” the difficulties of talking on a specific potential surface by focusing on the paths between different configurations.
Figure 5.

A schematic description of all the probable mechanistic pathways through which the hydrolysis of monomethyl pyrophosphate trianion could take place. Starting from RS, the geometries of all the key points along the associative and dissociative pathways following the direct (1W) and water assisted (2W) PT mechanisms are also presented. The central path through TS1assoc (no PT) can also be used to describe a more concerted path.
We will start our discussion with the mechanistic pathway explored by Nemukhin and coworkers,11, 24 who explored the hydrolysis of triphosphate and GTP in an aqueous solution and in the Ras/GAP respectively. These works involved energy minimization on a QM/MM potential with a relatively low-level of theory for the QM part. The minimization in condensed phases raises certain concerns regarding the energy convergence due to the presence of multiple local minima encountered in minimization in addition to the accuracy of the prediction of the barrier heights, as well as the transition state geometries, by the low-level QM. These issues are even more serious when it comes to QM/MM studies of proteins (see Ref.25 for detailed discussion). Nevertheless, the findings of Ref11, 24 with regard to the solution reaction are of a significant interest. That is, these workers were the first to find that the attacking water arrives head on (as is the case in Fig. 1), which leads to the formation of the H2O-PγO3−3 intermediate11 (Fig. 4 in our study). Here, it is interesting to note that during the formation of this intermediate from the RS, the geometric coordinate, R1 is varied from approximately 1.68 to 2.3 Å, whereas R2 is varied from 3.2 to 2.3 Å. This clearly suggests that the reaction follows an associative path (or associative/concerted path) at least up to the rate determining TS. Unfortunately it was described as a dissociative path (see similar problems in Refs.14, 26 and in Ref13 that will be discussed further below). Furthermore, the calculated PT barrier is not the rate limiting barrier since it is not the global maximum along the reaction path. At any rate, the main presumption in this study has been that the PT involves several water molecules in TS2, i.e., during the PT step, (Fig. 3 of Ref.11 and the designated path in our Fig. 4) rather than a single water molecule.
Figure 4.

Schematic diagram of the free energy surface and the representative geometries for the hydrolysis of monomethyl pyrophosphate trianion in solution following the catalytic mechanism explored in Ref. 11 This mechanism corresponds to the associative (2W) pathway depicted in Fig. 5.
A more recent study on the hydrolysis of phosphate monoesters has been reported by Marx and coworkers,13 using the metadynamics (MTD) approach (with ab initio (BLYP-based) MD) used to construct the relevant free energy surface. While the computational cost of BLYP functional with the plane waves allowed to simulate a large QM system with 113 water molecules, but without proper spherical boundary conditions it may not be enough to capture the long-range electrostatics and to properly describe the solvation. Similar problems are likely to exist even with periodic boundary conditions (PBC), except in simple cases with a central isolated charge where clear corrections are available (see discussion in Ref.27). Furthermore, the performance of BLYP functional in evaluating activation free energy barriers for chemical processes is relatively poor.28 Here again the actual reaction path was clearly found to be the concerted (see their Fig. 4 in Ref.13), but unfortunately the authors who call it “dissociative” ignored this fact. More significant was the finding that the heights of TS2 and TS1 are very similar (about 29 kcal/mol) and thus the suggested mode of the PT might now be rate limiting (in contrast to the case of ref.11). However, it is not clear that the coordination numbers used as the MTD collective variables (CV) in the study of ref.13 actually explored a direct 1W PT pathway (since the authors leave validation of the sophisticated computational scheme to the reader), and this issue will be explored below. Furthermore, the nature of the PT path is important, since Marx et. al.13 presumed to find a new mechanism (basically that of Grigorenko et. al.11) which they described as a “water as a base” mechanism. The apparent problem is that if TS2 is actually lower than TS1 (the possibility depicted in Fig. 4) the presumption of the new mechanism is not justified since the rate-determining step involves a nucleophile attack of a water molecule and not the proton transfer step, where the proton ends up eventually on the phosphate oxygen (thus the phosphate is the actual base (see section V)). At any rate, if the energy of TS2 is higher than that of TS1, then it is still essential to explore the relative energy of the 1W and 2W paths until the actual rate limiting step is reliably determined. To clarify the above problems and to establish the basis for a well-defined analysis, we provide in Figs. 2, 3 and 5 a clear (though not trivial) description of the mechanistic alternatives.
We would also like to clarify that a path through which we move to a given TS defines the mechanism much more than the position of the TS or the intermediate. For example, the intermediate (INT) in Fig. 3 could have been obtained with an dissociative path or associative path. In the work of Ref.11 and Ref.13 it was obtained through an associative path and this should be used in describing the reaction as an associative reaction. With the above problems in mind, we will provide in this work a very systematic study of the 1W and 2W paths and will do so in a way that can be easily verified by other workers in the field.
II. Computational Methods
This work explores the free energy surface of phosphate monoester hydrolysis by a reasonable and well tested approach that can be reproduced by others. Our task is to map the reaction free energy surface in solution in a way that does not miss key points on this surface (missing such points is common to automatic energy minimization approaches). The challenge is to explore the surface while constraining the minimum number of essential coordinates and yet to be able to go against the gradient along the least energy path. The most obvious search involves the coordinates R1 and R2 as depicted in Fig. 1 that fully define the associative and dissociative paths. Unfortunately, it is also essential to explore the third coordinate, namely the proton transfer coordinate, X in case ∂E/∂X ≫ 0. That is, if we had a perfect and complete search method we could have assumed that we can locate the least energy path with respect to all essential coordinates in the complete configurational space. However, it is clear that standard energy minimization and probably non-systematic sampling approaches, (including the MTD approach) cannot do so in the 1D (R1−R2) or 2D space of R1 and R2 (at least without an adequate description and a special focus on the PT coordinate). In fact, as recognized by Guthrie29 we should discuss the surface of phosphate hydrolysis by diagrams of the type presented in Fig. 6. Furthermore, considering only R1 and R2 can lead to the equivalent of missing nonequilibrium solvation effects30 and to significantly overestimating the contribution of the PT to the overall barrier as it does not proceed along the least-energy path involving an uphill PT at earlier stages. Thus, it is useful to start by exploring the dependence on R1 and R2 for different fixed values of X and also with well-defined constraint transition between several water molecules (see below). With the above perspectives in mind we focused on mapping the solution free energy surface for the hydrolysis of mono methyl pyrophosphate trianion in 3D space using ab initio calculations with implicit solvent models as described below.
Figure 6.

Schematic three-dimensional representation of the hydrolysis of monomethyl pyrophosphate trianion along the three reaction coordinates R1, R2, and X. [000], and [111] represents the RS, and PS states respectively. [100], [010], and [001] are the states representing where the reaction had proceeded only along that respective reaction coordinate. [110], [101], and [011] corresponds to the states where the reaction had occurred along the respective two reaction coordinates.
All the ab initio calculations were carried out using the Gaussian03 software package.31 The initial geometry optimizations were performed in the gas phase using 6-31+G* basis set and Becke’s three level hybrid functional which combine the Hartree-Fock exchange and density functional theory (DFT) exchange correlations.32 The resulting structures were described using the larger 6-311++G** basis set and solvated by the IEF-PCM continuum model.33 The calculated free energy surfaces were subsequently used to identify the approximate location and energies of key stationary points. In addition, the performance of the IEF-PCM continuum model in estimating the solvation influence on the gas phase optimized geometries was compared with that of the COSMO continuum model at the characteristic points on the PES. The error range associated with the choice of the quantum method and the basis set was also established by evaluating selective points at the MP2/6-311++G** level of theory.
Obviously, it is important to have a proper minimization of the system in a given solvent model. Here we note that the mapping in the space of the three key coordinates reduces significantly the need of a careful mapping, since the key coordinates are included in the systematic search (and are not needed to be minimized). However, we still have to attempt to combine our mapping with more systematic minimization in the given solvent model. To achieve this we adopted some aspects of the strategy used in our early work 16 (where we locate a gas phase transition state and then search in the direction of the IRC in solution) and combined it with the 3D mapping technique previously used in other studies by our group.34 That is, we took the following 3 step procedure (i) we performed gas phase energy minimization at each point on the 3D map and then added the solvation energies of the corresponding geometries by using just by an implicit IEFPCM model.33 (ii) We took points that look like good candidates for being in TSs regions (or key intermediates) and performed gas phase TS optimization, and then reevaluate the energy of solvating the resulting structures in the implicit solvent model. (iii) We selected important regions on the surface (namely intermediates and TSs regions) and performed “solvation focusing” by taking a limited grid of the available (R1, R2, X) space and then performing COSMO35, 36 minimization thus exploring the effect of relaxing the remaining solute coordinates in solution. We must note that the TSs obtained in implicit solvent models are far from being perfect and we believe that more advanced exploration should involve PD approach.37, 38
III. Results
Our main test system was taken as monomethyl pyrophosphate trianion in solution, where in order to explore in a reliable way the free energy surface for the hydrolysis of this system we started with the systems shown in Fig. 1 with 2 explicit water molecules and explored the 1W and 2W paths following the approach outlined in Section II. Our exploration of the free energy surface started by generating a 2D surface in the space of R1 and R2. This was done for a series of fixed distances of the PT coordinate X. As stated above, we allowed all the coordinates except (R1, R2 and X) to be optimized freely at each point (first in the gas phase and then in a more limited way in solution). The reaction coordinate corresponding to the bond breaking, R1, is mapped in the range from 1.8 to 3.8 Å in 0.2 Å increments. In addition, the energetics corresponding to R1=1.68Å has also been computed for the entire range of R2. Similarly, the reaction coordinate corresponding to the bond formation, R2, was mapped in the range from 3.0 to 1.65 Å in 0.2 Å increments. However, in the range between R2 = 2.2–1.8 Å, the mapping was carried out in 0.1 Å increments for extra clarity. The mapping along the proton transfer coordinate, X, was carried out from the reactant state, where the proton is bound to the nucleophilic water molecule, to the product state, where the proton is fully transferred to the leaving phosphate group, through the intermediate states at X = 1.75, 1.50, 1.25, and 1.15 Å. Considering of all the six 2D free energy surfaces (each of which corresponds to a specific location of the proton i.e., water bound, protonated phosphate, and intermediates), allowed us to identify the minimum free energy path for the hydrolysis reaction in the hyperspace of R1, R2 and X. We note in this respect that, while generating the surfaces in this manner, it has been crucial to change the reaction coordinate very carefully, to avoid unwanted noise on the free energy surface, that could obscure the location of the key stationary points. After this initial exploration we performed gas phase transition states search in the regions where the actual TSs may exist, then we performed further focusing by selective COSMO minimization (see Section III).
The results of our calculations are summarized in Figs. 7–11. As seen from Figs 7 and 8 the 1W and 2W mechanisms have similar activation barriers and thus it is unjustified to assume that the 2W (or 3W) mechanisms are favored in solution. The reason why the 1W mechanism might have been overlooked in other studies will be clarified below. The structures of the key TSs are provided in Fig. 9 and their corresponding Cartesian coordinates are presented in SI. We also provide in the SI an assessment of the effect of the level of the QM and solvation models used. The above study has been done for the reaction in solution without Mg+2 ion. This corresponds to the study of Grigorenko et. al.,11 while the study of Marx and coworkers13 considered Mg+2 assisted hydrolysis, a system that was also considered in our previous (Fig. 9 of Ref. 17) study. Our studies of the difference between the reaction with and without Mg+2 have indicated that we have a similar trend and we do not expect to see significant difference between the 1W and 2W cases due to the Mg+2 effect. Obviously it would be instructive to perform the free energy calculations with a suitable for kinetics ab initio QM/MM (QM(ai)/MM) potential using the paradynamics (PD) reference potential-based approach37, 38, and such a study is in progress in our lab. However, the relative energies of the 1W and 2W mechanisms are unlikely to change significantly.
Figure 7.

The calculated free energy surfaces along the associative (A) and concerted/Late PT (B) pathways for the hydrolysis of monomethyl pyrophosphate trianion in solution utilizing both the 1W and 2W mechanisms. As seen from the figure the rate determining TSs for the 2W and 1W have similar energies. The surfaces are drawn as functions of R1, and R2 for several values of proton transfer coordinate X (R1, R2, and X are defined in Fig. 1A). TSassoc describes the transition state along the associative pathway, TS1conc and TS2conc describes the transition states along the concerted pathway. The values of the TS energies evaluated by different approaches are given near the corresponding TSs figures. Note that the figure also provides the COSMO optimized TSs which are not always where the initial search indicate them to be. However, the search provides a powerful guide for the relevant regions. Furthermore, note that the critical TSs (TS2conc(1W) and TS2conc(2W)) were carefully explored. However, since the transition states TS1asso/conc. and TS1conc are neither associated with the rate limiting steps of the reaction nor involved with the critical proton transfer step, hence they were only identified in a tentative way based on the energetics along the minimum free energy pathway.
Figure 11.

The effect of the change in pKa of the attacking water on the PT energetics in the 2W mechanism. The figure displays the R2 dependence of the energies of the “reactant state” (RS), where the proton is attached to nucleophilic water, the “product state ” (PS), where the proton is attached to the second water, and the corresponding TSs for the PT process. As seen from the figure, the attacking water becomes much more acidic upon formation of the O-P and the PT becomes basically spontaneous. Note that our constrained mapping does not capture the exact least energy path, and overestimate the TS energy.
Figure 8.

Focusing on the calculated free energy surfaces for the reaction paths that starts with an associative or a dissociative path followed by a late PT to the phosphate oxygen. As seen from the figure the rate determining TSs for the 2W and 1W paths have similar energies. Note that the activation entropy of the 2W path (which is not included) should be larger than that of the 1W barrier. The surfaces were obtained as functions of R1, and R2 for several values of the proton transfer coordinate X, and it focuses on comparing the PT barriers that starts from the intermediate where R2 is around 2 Å and R1 is partially broken. Note that the figure also provides COSMO optimized TSs which are not always where the initial search indicate them to be. However, the search provides a powerful guide for the relevant regions.
Figure 9.

The geometric features of the key transition states corresponding to the 1W and 2W pathways following the associative and associative/concerted mechanisms.
IV. Why has been the 1W path missed and what is the reason for spontaneous 2W motion with compressed bonds ?
One of the central question when “accusing” different studies of overlooking key reaction paths, is what is the reason for such problems. Here we explore the reason for overlooking the 1W path by the energy minimization (and MTD) by evaluating the energetics of the PT at different steps of the nucleophilic attack (different values of R2). The results are presented in Figs. 10 and 11, which provide a remarkable new insight. That is, it appears that the compression of the O-P distance drastically changes the pKa of the attacking water (from about 16 to approximately zero). Obviously at some stage the attacking water becomes very acidic and transfers its proton to either another water or to the phosphate. The problem is that the compression free energy cost, must be taken into account. Now adding the change in pKa between the donor and acceptor to the compression energy gives the free energy of the “reactant” and “product” in the PT process (see Figs. 10 and 11). However, what we actually need is the free energy of reaching the TS for the PT process. Here we have the main difference between the 2W and 1W. That is, in the case of 2W the exothermicity and the TS energy are almost equal, since the acceptor water molecule can be arranged in an optimal distance. This means that change in R2 during an automated energy minimization or MTD will reach eventually a point with a spontaneous PT. This however not the case for the 1W path. In this case the energy will always go up along the PT coordinate since it is necessary to stretch the formed P-O and/or bend the O-P-O angle for an optimal PT. The barrier for the PT in the case of 1W is almost certainly the reason why this path has been overlooked by the energy minimization and in the recent MTD studies. Thus it seems to us that the hydrolysis reaction requires a more complex RC, which is able to capture reliably uphill PT.
Figure 10.

The effect of the change in pKa of the attacking water on the PT energetics in the 1W mechanism. The figure displays the R2 dependence of the energy of the “reactant state” (RS), where the proton is bound to the nucleophilic water and the water oxygen is in a short distance of 2.2 Å, the “product state” (PS), where the proton is attached to the acceptor phosphate oxygen, and the corresponding TSs for the PT process. As discussed in the text and shown in Fig. 11, the attacking water becomes much more acidic upon formation of the O-P and the PT occur. However, the PT does not become spontaneous because of the extra energy required for bending the O-P-O angle for an optimal PT.
V. Discussion
Phosphate hydrolysis of monomethyl pyrophosphate trianion in solution is a prototype solution reaction for several important biological processes such as the catalytic reactions of GTPase and ATPase. However, there exist several proposals in the literature about the hydrolysis of this class of systems especially for the proton transfer step. We have found in several cases that the proton transfer during the reaction can take place directly from the incoming nucleophilic water molecule to the substrate oxygen atom of the phosphate group. However, there are several other proposals, where the proton transfer occurs through the assistance of additional water molecules rather than a direct transfer mechanism. Now, although any mechanistic proposal based on a proper scientific background deserves to be considered, it is important to try to prove that it is the most probable operational mechanism for the given reaction. Thus one needs to show in an unbiased way that the corresponding rate limiting free energy barrier is the lowest one available. Unfortunately, there is a risky bias in attempting to propose phosphate hydrolysis mechanisms with a path through several water molecules without exploring the alternative pathway. This problem has been compounded in different attempts 11, 24, 39, 40 to explore (and dismiss) the 1W, and phosphate as a base mechanism, while examining an early PT to the phosphate oxygen before the reduction of R2, rather than exploring the concerted path used in our studies (e.g. Ref. 41). We would also like to mention that the idea of multiwater PT in phosphate hydrolysis gain major popularity22, 42–44 in recent years, probably due to the popularity of the Grotthuss mechanism, although the role of this mechanism (and in particular the role of water orientation) has been found to be very problematic in many cases of proton transport in proteins (e.g. see Ref. 45). Here again we must point out that it is completely valid to suggest such path but it is also essential to explore the free energy of the single water path. Finally, traps associated with insufficient attention to the PT coordinate have also been discussed recently in Ref.46
It might also be useful to comment here on presumed experimental proofs for multiwater paths (e.g., Ref. 44) from the observed kinetic isotope effect (KIE). Unfortunately there is no way to obtain a unique mechanistic proof form experimentally observed KIE since both the 1W and 2W path are expected to have similar KIE (in fact the 1W is expected to have a larger KIE). Here it is essential to evaluate the KIE for both mechanism before reaching any mechanistic conclusion (see the analysis of a related problems in Ref.17). It is encouraging to note that a recent work 15 has obtained results that are very similar to our results exploring 1W mechanism and using similar search to the one used here (doing this however with a QM/MM model, but with a relatively poor sampling). However, that work did not explore the 2W mechanism. It should be noted that even if the path with a concerted PT through two water has slightly lower energy than that of PT from the nucleophile water, it has little to do with the term “ water as a base mechanism” proposed in Ref.13 That is, water as a base mechanism requires that a water molecule would be the base in the reactant state. Now if the definition is extended to the TS then the water should be a real proton acceptor rather than serve as a shuttle where the phosphate remain the ultimate base, and where the barrier is correlated with the pKa of the phosphate oxygen. In fact, the issue of PT assisted by an additional group at the TS is more interesting, when one considers the GTP hydrolysis in Ras/GAP. In this case, it is possible that the mechanism with Gln61 serving as a proton shuttle in the TS has a similar energy to that of the direct PT from the attacking water. Of course, getting the enormous effect found in Ref.24 is completely unrealistic, but some contribution from glutamine assisted PT in the TS is possible. Here we believe that the Gln 61 mainly acts in an allosteric mechanism as was found in our studies that simulated the structural changes associated with the mutation. In fact, it is even possible that TS with contributions from protonated (or partially protonated) Gln helps the allosteric transition. Interestingly, if a path with a partial PT to Gln stabilizes the TS, relative to the important 1W path mechanism we would expect the Gln61Ala mutation to let an a penetration of an additional water and still keep a similar rate with the 2W mechanism (whereas the rate is reduced in this mutation by six orders of magnitude). Furthermore, we note that the idea of a PT to an additional group in the TS becomes more problematic in the related case of the activation of EF-Tu by the ribosome and the effect of mutating His 84 on the activation,39 where the structural changes are known experimentally.47–54 In this case, which was explored in our study55, the His84 is already protonated in the ground state so it is hard to see the advantage of a path that does not involve the 1W mechanism. At any rate, any serious attempt to challenge the 1W mechanism in proteins must involve much more careful studies than those reported in previous attempts to promote the 2W and related paths. Here we believe that using the PD approach, with the EVB as a reference potential, provides the most promising option of quantifying the free energy difference between the 1W and alternative mechanisms.
One of the most instructive findings of the present work is the realization that the 2W is found spontaneously by approaches that just map R2, while the finding of the 1W path (as well as the 2W least energy path) requires a more sophisticated 3D search and is likely to be missed by oversimplified landscape search approaches when RC is composed of R1 and R2 only. This should serve as a guide and warning to those who are performing cutting-edge studies of complex biologically relevant systems. In fact, the above warning is relevant not only to energy minimization approaches but also to the far more sophisticated MTD approach (and to any other improved sampling strategies).
Studies of phosphate esters hydrolysis are another illustration of the importance of proper choice and representation of the RC. Here one should resist the temptation of reducing a chemical complex problem to a technical issue, which can be solved using a black box approach no matter how elegant it might seem (without fully examining, understanding and controlling what the black box does). An example of this point is given by the selection of the coordination number between all γ-oxygens and all water hydrogens as a collective variable in MTD simulations of Ref.13 Such a coordinate gives little control since the constraining force acts on the particles in the narrow shell around the specified coordination radius56 and there is a danger of getting some artifacts or discriminating one path over the other while being deceivingly ensured in exploring all the possible options. In fact, there is no effective way to choose the correct collective variables (and correspondingly the auxiliary MD variable) for a chemical reaction without understanding the nature of the reaction surface (which is done in our strategy by mapping the solution surface). One should realize that the ability of MTD CV to automatically determine the reaction path is an assumption, which was tested only on simple cases57, 58 and that the validity of this strategy needs to be repeatedly validated with the well-established conventional methods when moving to new systems. This is especially true when one deals with chemically challenging problems and may face the risk of reaching what may be a misleading conclusion.
In addition to our emphasis on performing a careful mapping while trying to reach mechanistic conclusions, we would like to emphasize that using incorrect (and sometimes misleading) terminology, such as calling a perfect assoc/conc path a dissociative path leads to unnecessary confusion in the field. For example while the schematic diagrams of Ref. 13 might look like dissociative paths, the actual simulations (i.e. Fig 4 in Ref. 13) barely bears any features of a dissociative path. Here we also would like to point out that a path through which we move to a given TS defines the mechanism much more rigorously than the position of the TS or the intermediate. Thus the intermediate (INT in Fig. 3) could have been obtained with a dissociative path or an associative path but in the work of Ref.11 and Ref.13 it was obtained through the associative path. Therefore the reaction should not be described as ”dissociative” and clearly not as a metaphospate mechanism. Similar problems are associated with terming a case where a water molecule serves as a shuttle for the proton on the way to the phosphate as “water as a base mechanism”, since this does not presents a careful analysis of the validity of the phosphate as base mechanism (since the actual base is the phosphate).
In our view when one faces a complex case with several mechanistic alternatives the starting point should be exploration of the solution surface with careful systematic mapping along the key coordinates. After such a step one can move to more automated sampling methods.
In addition to the above works that were used to demonstrate our concerns, it is useful to comment on some other works from the rapidly increasing QM/MM studies of the hydrolysis of phosphate monoesters. One example, is a relatively careful CPMD study 14, which explored the reaction in water. That is, these authors studied the hydrolysis of the highly charged reacting systems with only 26 water molecules over very few picoseconds, and concluded that “The latter (dissociative reaction) has an activation energy of 35 kcal/mol, where 25 kcal/mol can be assigned to the P-O bond breaking and 10 kcal/mol to the artificial stability of PO3− resulting from the small size and the short time scale of the simulation. The path and energy barrier (39 kcal/mol) of the less-favorable associative reaction suggest that it is possible only under conditions where the lytic water is already deprotonated to OH−”. Of course, presuming what the effect of the missing solvent would be is not a fully valid scientific approach for examining alternative mechanisms. Furthermore, the authors presume that the “reactions discussed are very fast (9-13 ps)” overlooking the fact that the reaction has an activation energy that leads to reaction rates of months. Subsequent studies by the same authors 14 tried to explore ATP hydrolysis in actin using MD simulations with an MM force field to generate starting points for cluster modeling. In this case, a perfectly valid SN2 TS is called “dissociative”, and a reaction where another water serves as a base is defined as an “associative” mechanism (the same problem mentioned above). The authors suggest that their work discriminates between different mechanisms, while presuming that their model includes a significant part of the protein electrostatics. Unfortunately, this work overlooks the fact that sampling with an MM force field that does not reflect the correct electrostatic coupling between the reactants and solvent and therefore cannot be effectively used in reliable QM free energy calculations of charge separation and transfer processes.
Another example is the recent study of the hydrolysis of ATP in solution,59 which presented an example of a brute force sampling. Unfortunately, this work has not provided a clear 2D free energy surface and has not attempted to look at the free energy for PT or to control the corresponding path. In fact, the study of the associative path have not explored the corresponding PT barrier, while the dissociative path, where the PT may have occurred spontaneously, presents another serious problem. That is, the mapping in this case only involves R1 and the TS looks as an associative TS based on Figure 4 of Ref.59 (No other information is given). In this case one may wonder whether the assertion of the authors that the water attack occurs only at the TS, is correct. That is, since R2 was not monitored we only have one snapshot with a large R2, but no real relevant statistics. However, studies that properly constrained R2 and R1 have reached very different conclusions. Here what is needed is a clear 2D PMF. In fact one may take significant exception to the presumption that until Ref 59 there was no work that “ captured by simulations the relaxation dynamics and its role in catalysis”. These aspects have, of course, been captured consistently and effectively in the EVB studies of Ref.60 and in countless related studies of GTP hydrolysis (e.g., Ref.55). Thus the challenge here is not the relatively trivial task of capturing the solvation effects (which can be done even with ab initio QM/MM by the approach of Ref.61), but the reliable evolution of the PMF along the key paths. Another interesting recent work that presumed a 2W type path is the work of Ref.62, which studied the reaction in Ras (without being aware of any previous serious theoretical study). This work used a semi-empirical QM/MM method and drastically overestimated the relevant barriers, and never explored the 1W path. More seriously, the calculations were only done for the PT path at the ground with the reactant state R1 and R2 and thus are irrelevant to the bond breaking process. An additional interesting and potentially useful recent study63 reported energy minimization exploration of the reaction in F1-ATPase. Here again it was only TS2 that was considered, with only the 2W (3W) mechanism, overlooking the energetic of competing paths. The authors also tried to invoke a presumed consistency with the observed isotope effect, overlooking the fact that both 1W and 2W PT paths will have an isotope effect and that the same will happened in the associative and dissociative (1W) TSs.
Another interesting recent work which explored the 1W and 2W mechanisms in phosphate triester hydrolysis study in ref.64 This work concluded that the 1W associative barrier is 15 kcal/mol higher that the 2W (although paper has not provided the TS structure for the 1W path nor examined the paths with the concerted TS2 path). It is also of some concern that this work overlooked early studies that examined the problems with mixed explicit and implicit models.65 That is, the authors of Ref 64 seems to misinterpret the emphasis of Ref.65 regarding the problems which arise for implicit models which include non reacting explicit water molecules as a recommendation for not including the explicit water molecules involved in chemical reaction. In fact, Ref.65 stresses the importance of exploring the resulting multiple local minima and the entropy associated with the additional degrees of freedom, and never suggested to exclude important solvent molecules that are involved directly in the chemistry. At any rate, even if the barrier of the 1W path is actually higher than that of the 2W barrier, we note that in the triester case we found that the pKa gradient that facilitated the reduction of the 1W barrier in the monoester case (see Fig. 10) does not exist. In fact, the pKa of the accepting oxygen is reduced strongly upon moving from the monoester to the diester and then to the triester.
The same points highlighted here are relevant to phosphate hydrolysis in proteins. Here the chance of getting problematic results is much larger and the confusion is likely to persist for a longer time. This is why we view EVB studies as the most reliable current approach for exploring the reaction in enzymes. This means, however, that one must start with a very careful search of all key mechanistic options in solution and then ask (without prior bias) what happens to these mechanisms when we move to the protein. Of course, with increasing computer power we can start to explore the effect of moving from the EVB to QM(ai)/MM surfaces by the PD approach. However, this approach is likely to give reasonable results only with very extensive EVB sampling.
In conclusion we would like to emphasize that the present study found similar activation free energies for the 1W and 2W paths, but more careful PD studies would be needed to establish which (if any) of the paths is the rate limiting. It is important to note in this respect that the current calculations have not consider the entropic effect that is likely to increase the barrier for the 2W path relative to that of the 1W path by 2–5 kcal/mol (a careful determination will require the use our restraint release approach as described in Ref.66). Furthermore, it would also be important to consider the difference in quantum mechanical tunneling effects that are likely to reduce the 1W barrier more than the 2W barrier (where we can use our QCP approach67).
Supplementary Material
Acknowledgments
This work was supported by NSF grant MCB-08364000 and NCI (1U19CA105010). We acknowledge the University of Southern California’s High Performance Computing and Communications Center for computer time.
Footnotes
Supporting Information Available
The data used to generate the free energy surfaces presented in Figs. 7, and 8 are presented. Also, the Cartesian coordinates for the critical points along the surfaces of 1W and 2W pathways are presented. This information is available free of charge via the Internet at http://pubs.acs.org.
References
- 1.Vetter IR, Wittinghofer A. Q Rev Biophys. 1999;32(1):1–56. doi: 10.1017/s0033583599003480. [DOI] [PubMed] [Google Scholar]
- 2.Cleland WW, Hengge AC. Chem Rev. 2006;106(8):3252–3278. doi: 10.1021/cr050287o. [DOI] [PubMed] [Google Scholar]
- 3.Benkovic SJ, Schray KJ. Chemical Basis of Biological Phosphoryl Transfer. Academic Press; New York: 1973. pp. 201–238. [Google Scholar]
- 4.Cox JR, Jr, Ramsay OB. Chem Rev. 1964;64:317–352. [Google Scholar]
- 5.Kirby JA, Warren SG. The Organic Chemistry of Phosphorus. Elsevier; Amsterdam: 1967. [Google Scholar]
- 6.Mildvan AS. Adv Enzymol Relat Areas Mol Biol. 1979;49:103–126. doi: 10.1002/9780470122945.ch3. [DOI] [PubMed] [Google Scholar]
- 7.Westheimer FH. Chem Rev. 1981;81(4):313–326. [Google Scholar]
- 8.Zhou DM, Taira K. Chem Rev. 1998;98(3):991–1026. doi: 10.1021/cr9604292. [DOI] [PubMed] [Google Scholar]
- 9.Colvin ME, Evleth EV, Akacem Y. J Am Chem Soc. 1995;117:4357. [Google Scholar]
- 10.Wang YN, Topol IA, Collins JR, Burt SK. J Am Chem Soc. 2003;125(43):13265–13273. doi: 10.1021/ja0279794. [DOI] [PubMed] [Google Scholar]
- 11.Grigorenko BL, Rogov AV, Nemukhin AV. J Phys Chem B. 2006;110(9):4407–4412. doi: 10.1021/jp056395w. [DOI] [PubMed] [Google Scholar]
- 12.Kamerlin SCL, Sharma PK, Prasad BR, Warshel A. Q Rev Biophys. 2012 doi: 10.1017/S0033583512000157. [DOI] [PMC free article] [PubMed] [Google Scholar]
- 13.Glaves R, Mathias G, Marx D. J Am Chem Soc. 2012;134(16):6995–7000. doi: 10.1021/ja2101533. [DOI] [PubMed] [Google Scholar]
- 14.Akola J, Jones RO. J Phys Chem B. 2003;107(42):11774–11783. [Google Scholar]
- 15.Branduardi D, De Vivo M, Rega N, Barone V, Cavalli A. J Chem Theory Comput. 2011;7(3):539–543. doi: 10.1021/ct100547a. [DOI] [PubMed] [Google Scholar]
- 16.Florián J, Warshel A. J Phys Chem B. 1998;102:719–734. [Google Scholar]
- 17.Klahn M, Rosta E, Warshel A. J Am Chem Soc. 2006;128(47):15310–15323. doi: 10.1021/ja065470t. [DOI] [PubMed] [Google Scholar]
- 18.Williams A. Acc Chem Res. 1984;17:425–430. [Google Scholar]
- 19.Lassila JK, Zalatan JG, Herschlag D. Ann Rev of Biochem. 2011;80(1):669–702. doi: 10.1146/annurev-biochem-060409-092741. [DOI] [PMC free article] [PubMed] [Google Scholar]
- 20.Nikolic-Hughes I, Rees DC, Herschlag D. J Am Chem Soc. 2004;126(38):11814–11819. doi: 10.1021/ja0480421. [DOI] [PubMed] [Google Scholar]
- 21.Grzyska PK, Czyryca PG, Purcell J, Hengge AC. J Am Chem Soc. 2003;125(43):13106–13111. doi: 10.1021/ja036571j. [DOI] [PubMed] [Google Scholar]
- 22.Thatcher RJG, Kluger R. Mechanism and Catalysis of Nucleophilic Substitution in Phosphate Esters. In: Bethell D, editor. Adv in Phys Org Chem. Vol. 25. Academic Press; 1989. pp. 99–265. [Google Scholar]
- 23.Hengge AC. Acc of Chem Res. 2002;35(2):105–112. doi: 10.1021/ar000143q. [DOI] [PubMed] [Google Scholar]
- 24.Grigorenko BL, Nemukhin AV, Shadrina MS, Topol IA, Burt SK. Proteins: Struct Funct Bioinf. 2007;66:456–466. doi: 10.1002/prot.21228. [DOI] [PubMed] [Google Scholar]
- 25.Klahn M, Braun-Sand S, Rosta E, Warshel A. J Phys Chem B. 2005;109(32):15645–15650. doi: 10.1021/jp0521757. [DOI] [PMC free article] [PubMed] [Google Scholar]
- 26.Akola J, Jones RO. J Phys Chem B. 2006;110(15):8121–8129. doi: 10.1021/jp054921d. [DOI] [PubMed] [Google Scholar]
- 27.Sham YY, Warshel A. J Chem Phys. 1998;109:7940–7944. [Google Scholar]
- 28.Zhao Y, Truhlar DG. Acc Chem Res. 2008;41(2):157–167. doi: 10.1021/ar700111a. [DOI] [PubMed] [Google Scholar]
- 29.Guthrie JP. J Am Chem Soc. 1996;118(51):12878–12885. [Google Scholar]
- 30.Villa J, Warshel A. J Phys Chem B. 2001;105:7887–7907. [Google Scholar]
- 31.Frisch MJT, GW, Schlegel HB, Scuseria GE, Robb MA, Cheeseman JR, Montgomery JA, Jr, Vreven T, Kudin KN, Burant JC, Millam JM, et al. Gaussian 03, Revision C.03. 2004. [Google Scholar]
- 32.Becke AD. J Chem Phys. 1993;98(7):5648–5652. [Google Scholar]
- 33.Cancès E, Mennucci B, Tomasi J. J Chem Phys. 1997;107:3032–3041. [Google Scholar]
- 34.Sharma PK, Xiang Y, Kato M, Warshel A. Biochemistry. 2005;44(34):11307–11314. doi: 10.1021/bi0509806. [DOI] [PubMed] [Google Scholar]
- 35.Barone V, Cossi M. J Phys Chem A. 1998;102(11):1995–2001. [Google Scholar]
- 36.Klamt A, Schuurmann G. J Chem Soc, perkin Trans 2. 1993;(5):799–805. [Google Scholar]
- 37.Plotnikov NV, Kamerlin SC, Warshel A. J Phys Chem B. 2011;115(24):7950–62. doi: 10.1021/jp201217b. [DOI] [PMC free article] [PubMed] [Google Scholar]
- 38.Plotnikov N, Warshel A. J Phys Chem B. 2012;116:10342–10356. doi: 10.1021/jp304678d. [DOI] [PubMed] [Google Scholar]
- 39.Grigorenko BL, Shadrina MS, Topol IA, Collins JR, Nemukhin AV. Biochem Biophys Acta. 2008;1784(12):1908–1917. doi: 10.1016/j.bbapap.2008.08.003. [DOI] [PMC free article] [PubMed] [Google Scholar]
- 40.Grigorenko BL, Kaliman IA, Nemukhin AV. J Mol Graph Model. 2011;31(0):1–4. doi: 10.1016/j.jmgm.2011.07.005. [DOI] [PubMed] [Google Scholar]
- 41.Klahn M, Rosta E, Warshel A. J Am Chem Soc. 2006;128:15310–15323. doi: 10.1021/ja065470t. [DOI] [PubMed] [Google Scholar]
- 42.Radhakrishnan R, Schlick T. Biochem Biophys Res Commun. 2006;350:521–529. doi: 10.1016/j.bbrc.2006.09.059. [DOI] [PMC free article] [PubMed] [Google Scholar]
- 43.Wang Y, Schlick T. J Am Chem Soc. 2008;130:13240–13250. doi: 10.1021/ja802215c. [DOI] [PMC free article] [PubMed] [Google Scholar]
- 44.Castro C, Smidansky E, Maksimchuk KR, Arnold JJ, Korneeva VS, Götte M, Konigsberg W, Cameron CE. Proc Natl Acad Sci USA. 2007;104:4267–4272. doi: 10.1073/pnas.0608952104. [DOI] [PMC free article] [PubMed] [Google Scholar]
- 45.Kato M, Pisliakov AV, Warshel A. Proteins: Struct Funct Bioinf. 2006;64(4):829–844. doi: 10.1002/prot.21012. [DOI] [PubMed] [Google Scholar]
- 46.Rosta E, Woodcock HL, Brooks BR, Hummer G. J Comp Chem. 2009;30(11):1634–1641. doi: 10.1002/jcc.21312. [DOI] [PMC free article] [PubMed] [Google Scholar]
- 47.Daviter T, Wieden HJ, Rodnina MV. J Mol Biol. 2003;332(3):689–699. doi: 10.1016/s0022-2836(03)00947-1. [DOI] [PubMed] [Google Scholar]
- 48.Voorhees RM, Schmeing TM, Kelley AC, Ramakrishnan V. Science. 2010;330(6005):835–838. doi: 10.1126/science.1194460. [DOI] [PMC free article] [PubMed] [Google Scholar]
- 49.Schmeing TM, Ramakrishnan V. Nature. 2009;461(7268):1234–1242. doi: 10.1038/nature08403. [DOI] [PubMed] [Google Scholar]
- 50.Schmeing TM, Voorhees RM, Kelley AC, Gao YG, Murphy FV, Weir JR, Ramakrishnan V. Science. 2009;326(5953):688–694. doi: 10.1126/science.1179700. [DOI] [PMC free article] [PubMed] [Google Scholar]
- 51.Schuette JC, 4th, FVM, Kelley AC, Weir JR, Giesebrecht J, Connell SR, Loerke J, Mielke T, Zhang W, Penczek PA, et al. EMBO J. 2009;28:755–765. doi: 10.1038/emboj.2009.26. [DOI] [PMC free article] [PubMed] [Google Scholar]
- 52.Cool RH, Parmeggiani A. Biochemistry. 1991;30:362–366. doi: 10.1021/bi00216a008. [DOI] [PubMed] [Google Scholar]
- 53.Scarano G, Krab IM, Bocchini V, Parmeggiani A. FEBS Lett. 1995;365:214–218. doi: 10.1016/0014-5793(95)00469-p. [DOI] [PubMed] [Google Scholar]
- 54.Ramakrishnan V. Biochem Soc Trans. 2008;36:567–574. doi: 10.1042/BST0360567. [DOI] [PubMed] [Google Scholar]
- 55.Adamczyk AJ, Warshel A. Proc Natl Acad Sci U S A. 2011;108:9827–9832. doi: 10.1073/pnas.1105714108. [DOI] [PMC free article] [PubMed] [Google Scholar]
- 56.Sprik M. Faraday Discuss. 1998;110:437–445. [Google Scholar]
- 57.Iannuzzi M, Laio A, Parrinello M. Phys Rev Lett. 2003;90(23):238302. doi: 10.1103/PhysRevLett.90.238302. [DOI] [PubMed] [Google Scholar]
- 58.Stirling A, Iannuzzi M, Laio A, Parrinello M. Chem Phys Chem. 2004;5(10):1558–1568. doi: 10.1002/cphc.200400063. [DOI] [PubMed] [Google Scholar]
- 59.Harrison CB, Schulten K. J Chem Theory Comput. 2012;8(7):2328–2335. doi: 10.1021/ct200886j. [DOI] [PMC free article] [PubMed] [Google Scholar]
- 60.Strajbl M, Shurki A, Warshel A. Proc Natl Acad Sci USA. 2003;100(25):14834–9. doi: 10.1073/pnas.2436328100. [DOI] [PMC free article] [PubMed] [Google Scholar]
- 61.Rosta E, Haranczyk M, Chu ZT, Warshel A. J Phys Chem B. 2008;112(18):5680–5692. doi: 10.1021/jp711496y. [DOI] [PMC free article] [PubMed] [Google Scholar]
- 62.Martín-García F, Mendieta-Moreno Jesús I, López-Viñas E, Gómez-Puertas P, Mendieta J. Biophys J. 2012;102(1):152–157. doi: 10.1016/j.bpj.2011.11.4005. [DOI] [PMC free article] [PubMed] [Google Scholar]
- 63.Hayashi S, Ueno H, Shaikh AR, Umemura M, Kamiya M, Ito Y, Ikeguchi M, Komoriya Y, Iino R, Noji H. J Am Chem Soc. 2012;134(20):8447–8454. doi: 10.1021/ja211027m. [DOI] [PubMed] [Google Scholar]
- 64.Mora JR, Kirby AJ, Nome F. J Org Chem. 2012;77(16):7061–7070. doi: 10.1021/jo301380v. [DOI] [PubMed] [Google Scholar]
- 65.Kamerlin SC, Haranczyk M, Warshel A. Chem Phys Chem. 2009;10(7):1125–34. doi: 10.1002/cphc.200800753. [DOI] [PubMed] [Google Scholar]
- 66.Strajbl M, Sham YY, Villà J, Chu ZT, Warshel A. J Phys Chem B. 2000;104:4578–4584. [Google Scholar]
- 67.Hwang JK, Warshel A. J Am Chem Soc. 1996;118:11745–11751. [Google Scholar]
Associated Data
This section collects any data citations, data availability statements, or supplementary materials included in this article.