

Abstract
Schwannomas are peripheral nerve sheath tumors that often occur in the setting of an inherited tumor predisposition syndrome, including Neurofibromatosis Types 1 (NF1) and 2 (NF2), Familial Schwannomatosis (FS) and Carney Complex (CNC). Loss of the NF2 tumor suppressor (encoding NF2, or Merlin) is associated with upregulation of the Rac1 small GTPase, which is thought to play a key role in mediating tumor formation. In prior studies, we generated a mouse model of schwannomas by performing tissue-specific knockout of the CNC gene Prkar1a, which encodes the type 1A regulatory subunit of Protein Kinase A. These tumors exhibited down-regulation of Nf2 protein and an increase in activated Rac1. To assess the requirement for Rac1 in schwannoma formation, we generated a double knockout of Prkar1a and Rac1 in Schwann cells and monitored tumor formation. Loss of Rac1 reduced tumor formation by reducing proliferation and enhancing apoptosis. Surprisingly, the reduction of tumor formation was accompanied by re-expression of the Nf2 protein. Furthermore, activated Rac1 was able to downregulate Nf2 in vitro in a Pak-dependent manner. These in vivo data indicate that activation of Rac1 is responsible for suppression of Nf2 protein production; deficiency of Nf2 in Schwann cells leads to loss of cellular growth control and tumor formation.. Further, PKA activation through mutation in Prkar1a is sufficient to initiate Rac1 signaling, with subsequent reduction of Nf2 and schwannomagenesis. Although in vitro evidence has shown that loss of Nf2 activates Rac1, our data indicates that signaling between Nf2 and Rac1 occurs in a bidirectional fashion, and these interactions are modulated by PKA.
Keywords: PKA, PRKAR1A, Schwann cell tumor, Rac1, Merlin
Introduction
Schwannomas are benign tumors of peripheral nervous system that have been well studied due to their association with neurofibromatosis syndromes. Neurofibromatosis Type I (NF1, Online Mendelian Inheritance in Man [OMIM] #162200) and NF2 [OMIM #101000] syndromes are caused by inactivating mutations in the RasGAP Neurofibromin 1 (encoded by the NF1 gene) and ezrin–radixin–moesin (ERM) family protein Neurofibromin 2 (Merlin or Schwannomin, encoded by NF2), respectively (1). In addition to these syndromes, schwannomas are also observed in two other autosomal dominant tumor syndromes. Familial schwannomatosis (OMIM #162091) caused by mutations in the SWI/SNF complex protein SMARCB1 and is rarely associated with non-neural tumors (2). Lastly, pigmented schwannomas are seen in patients with Carney complex (CNC), a tumor predisposition bearing significant similarities to multiple endocrine neoplasia syndromes. CNC is characterized by tumors of various endocrine glands, bone and cartilage tumors, Schwann cell tumors and skin discoloration. This condition is caused by loss of function mutations in PRKAR1A, the gene which encodes type 1A regulatory subunit of cAMP-dependent protein kinase, PKA. Loss of PRKAR1A causes dysregulation of PKA activity, with elevated basal and stimulated PKA activity (3–4).
Cyclic AMP (cAMP) regulates a number of key cellular processes such as cell growth, differentiation, gene transcription, and ion channel conductivity. In Schwann cells, activation of cAMP/PKA pathway promotes cell growth, cell cycle progression (5) and required for myelin formation (6). PKA phosphorylates a wide variety of physiological substrates, including, Neurofibromin1 (7) and 2 (Merlin) (8). PKA is able to phosphorylate Merlin at Serine-518, at Serine-10 where phosphorylation of this residue appears to alter Merlin’s interaction with actin cytoskeleton to cause morphologic and mobility alterations (9). Notably, the Ser-518 site is also targeted by p21-activated kinases (PAKs) (10). Phosphorylation of Nf2 has been demonstrated for PAKs 1,2, and 6, although others have not been tested (11). One report has suggested that PAKs are primarily activated by Cdc42 in Schwann cells (12), although this question has not been studied extensively. Functionally, mutation in Nf1 leads to increased intracellular cAMP in Schwann cells (13), and increased PKA activity, which would mimic the increased PKA activity seen by loss of Prkar1a (4).
Previously, we assessed the contribution of complete loss of Prkar1a to schwannoma formation using a tissue-specific knockout (KO) mouse approach. Mice carrying conditional null allele of Prkar1a were bred to mice of TEC3 line, which uses the Tyrosinase promoter to drive expression of cre-recombinase in a limited set of facial neural crest cells (14). TEC3;PRKAR1lloxP/loxP mice (henceforth called T3;R1aKO) developed facial schwannomas with high penetrance (15). In contrast, mice with ablation throughout the neural crest died at birth due to craniofacial defects caused by aberrant differentiation of the cranial neural crest (16). Prkar1a-null schwannomas demonstrated post-transcriptional loss of Nf2 protein. Analysis of signaling pathways thought to lie downstream from Nf2 showed no activation of Akt, Erk, or an increase in GTP-loaded Ras. However, study of other small G-proteins demonstrated significant enhancement of activated Rac1. Inhibition of Rac-Pak activity in confluent cells has been proposed to be one of the key means by which NF2 inhibits proliferation of confluent cells (17). Thus, based on this data, we proposed that activation of PKA in Schwann cells (caused by loss of Prkar1a) led to reduction in Merlin, and thence to an increase in Rac1 activity as the key pathway in tumorigenesis.
In present study, we sought to test the hypothesis that Rac1 is downstream effector essential and required for Schwann cell tumorigenesis in T3;R1aKO model. To pursue this question in vivo, we introduced a conditional null allele of Rac1 into these mice and monitored tumor formation. We report that Rac1 KO in this setting significantly reduces tumorigenesis. Surprisingly, ablation of Rac1 led to re-expression of Nf2, suggesting that there is bidirectional signaling between Nf2 and Rac1, and these interactions are modulated by PKA. These observations have important implications for understanding both Schwann cell development and Schwann cell tumorigenesis.
Results
Deletion of Rac1 reduces schwannoma formation in Prkar1a KO model
T3;R1aKO;Rac1WT mice have been previously generated in our laboratory (15). Because TEC3 driver expresses cre in a limited subset of facial neural crest derivatives (14), it is highly suitable for studying Schwann cell tumorigenesis (15). Tumors derived from T3;R1aKO;Rac1WT mice showed upregulated Rac1 activity. To assess the requirement of Rac1 in tumorigenic process, we used TEC3 cre line to generate mice lacking both Prkar1a and Rac1 in a subset of facial Schwann cell.
T3;R1aKO;Rac1KO (DKO) and T3;R1aKO;Rac1Het (Hets) mice were generated by crossing T3;R1aKO;Rac1WT with mice carrying a conditional null allele of Rac1. All genotypes of mice were born at expected Mendelian frequencies (data not shown) and allowed to age to 40 weeks, a time by which >80% of T3;R1aKO mice developed Schwann cell tumors on face (15). Although heterozygosity for Rac1 did not affect tumor incidence at 40 weeks (81% for T3;R1aKO;RacHet vs. 73% for T3;R1aKO;RacWT), complete ablation of the gene led to significant suppression of tumor formation (54% for T3;R1aKO;RacKO vs. 73% for T3;R1aKO;RacWT, p=0.0295) (Fig. 1). Also, the incidence of bilateral tumors observed in Prkar1a/Rac1 double KO mice (6%) was much lower than that observed in heterozygous mice (43.6%) or WT (41%) for Rac1. We have previously described that tumors in T3;R1aKO;Rac1WT can grow up to nearly 1.5 cm in diameter with no signs of metastases (15). As shown in Fig. 1 (A to F), the size of tumors was smaller in T3;R1aKO;Rac1KO mice, whereas the T3;R1aKO;Rac1Het were comparable to T3;R1aKO;Rac1WT. No metastatic disease was observed in any of the schwannoma models studied.
Figure 1. Tumor burden is reduced and onset is delayed in T3;R1aKO;Rac1KO mice compared to T3;R1aKO;Rac1WT and T3;R1aKO;Rac1Het.
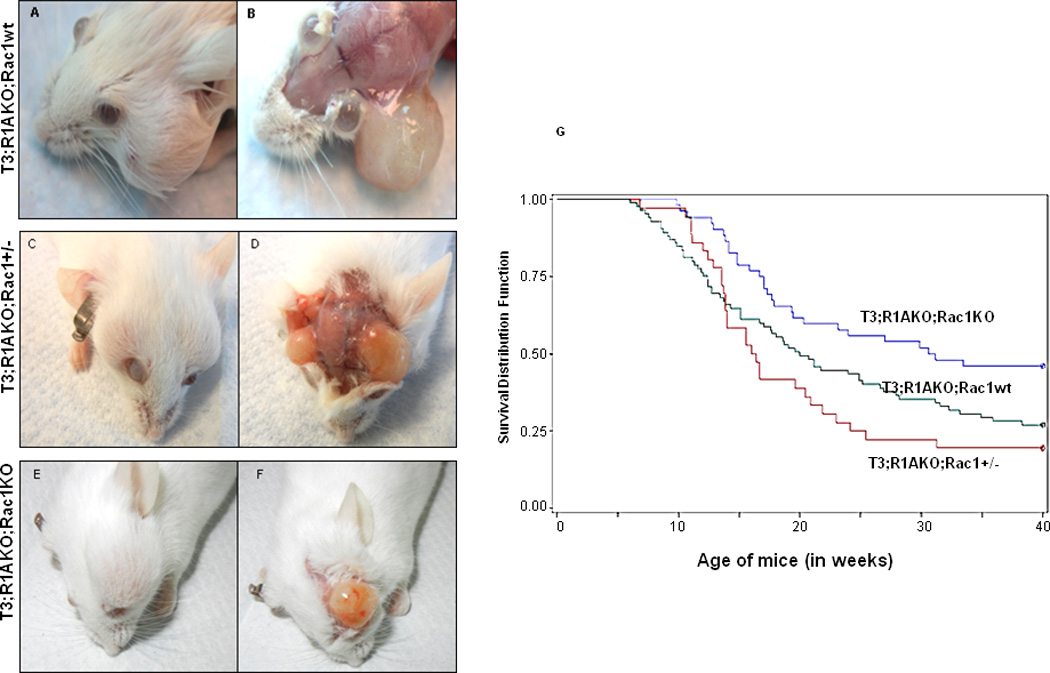
(A, B) Macroscopic appearance of schwannomas is shown for T3;R1aKO;Rac1WT (C, D) T3;R1aKO;Rac1Het and (E, F) T3;R1aKO;Rac1KO mice. (G) Kaplan-Meier plot of tumor onset in a cohort of mice. Animals were monitored for 40 weeks of life, and tumor onset was considered when a tumor reached 0.5 cm in diameter, as previously reported (15).
To confirm that deletion of Rac1 allele in limited subset of facial neural crest cells does not affect the normal development, we also generated Tec3;Rac1loxP/loxP (T3;Rac1KO) mice. These mice carried the ROSA26lacZ reporter allele in order to confirm cre expression by LacZ staining (18) (Supplemental Fig. 1). Histological analysis did not show any aberration or alteration in neural crest development (data not shown). A cohort of mice was allowed to grow until 12 months of age. These mice were completely normal for one year and did not show any phenotypic abnormality.
Tumor Histology
Based on guidelines for classification of genetically engineered mouse Schwann cell tumors (19), T3;R1aKO;Rac1WT tumors were categorized previously as schwannomas given their characteristics on S-100 immunohistochemistry (20). According to this classification scheme, tumors with mesenchymal, epithelial or neuroendocrine differentiation are grade III peripheral nerve sheath tumors with divergent differentiation. To assess histologic changes induced by loss of Rac1, we studied a subset of tumors from each genotype at the histopathologic level (Table 1). Of the T3;R1aKO;Rac1WT tumors studied, 2/6 (33%) were grade III with divergent squamous differentiation, whereas others were classified as grade II tumors. A similar distribution of pathology was observed in both T3;R1aKO;Rac1KO (4/7 grade III with divergent differentiation and 3/7 grade II) and T3;R1aKO;Rac1Het (4/6 grade III with divergent differentiation and 2/6 grade II) tumors. Hypercellular areas were present in all tumors; grade II tumors displayed nuclear pleomorphism and mitoses. Thus, no significant differences were detected in histopathologic characterisitics of T3;R1aKO tumors, regardless of Rac1 status.
Table I.
Histopathological characteristics of Schwannomas in this study
| ID | Genotype* | Grade+ | MITOSES | NECROSIS | HYPOCELLULARITY/ ALCIAN BLUE |
SQUAMOUS DIFFERENTIATION |
|---|---|---|---|---|---|---|
| L9799 | SKO | II | 15 | N | 30% | N |
| L9838 | SKO | II | 11 | N | 60% | N |
| L6233 | SKO | II | 3 | N | 90% | N |
| M439 | SKO | II | 6 | N | 70% | N |
| L7884 | SKO | III | 24 | Y | 70% | Y |
| L6239 | SKO | III | 1 | N | 60% | Y |
| M0732 | HETS | II | 4 | N | 25% | N |
| M454 | HETS | II | 2 | N | 40% | N |
| M0443 | HETS | III | 5 | N | 25% | Y |
| M236R | HETS | III | 2 | N | 50% | Y |
| M207 | HETS | III | 23 | N | 70% | Y |
| M205L | HETS | III | 18 | N | 70% | Y |
| M1279 | DKO | II | 6 | Y | 70% | N |
| M2206 | DKO | II | 1 | N | 95% | N |
| M484 | DKO | II | 10 | N | 50% | N |
| M652 | DKO | III | 6 | N | 60% | Y |
| M1281 | DKO | III | 9 | N | 50% | Y |
| M916 | DKO | III | 1 | Y | 40% | Y |
| M1289 | DKO | III | 5 | Y | 40% | Y |
SKO: Single KO (T3;R1aKO;Rac1WT); Het: T3;R1aKO;Rac1Het; DKO: Double KO (T3;R1aKO;Rac1KO); N = no; Y = yes
Grade according to (19)
Rac1 loss causes reduced proliferation and increased apoptosis in Schwann cell tumors
To determine the basis for reduced tumorigenesis caused by ablation of Rac1, total mitotic figures in each representative section of tumor were counted at 400× for group of tumors evaluated histologically (Table 1). T3;R1aKO;Rac1WT tumors had a mean of 10 mitoses/hpf (n=6), T3;R1aKO;Rac1Het (Het) tumors had a mean of 9 mitoses/hpf (n=6), and T3;R1aKO;Rac1KO (DKO) tumors had a mean of 5.4 mitoses/hpf (n=7). Although these results were consistent with the notion that T3;R1aKO;Rac1KO tumors had a reduced mitotic count, the variability precluded statistical significance with these small numbers. To enhance the analysis, we also examined tumor cell proliferation by Ki-67 staining (Fig. 2A, C). In this assay, T3;R1aKO;Rac1WT tumor cells had significantly higher percentage of proliferating cells than T3;R1aKO;Rac1KO or T3;R1aKO;Rac1Het tumors. (P<0.001).
Figure 2. T3;R1aKO;Rac1WT schwannomas exhibited increased proliferation and reduced apoptosis.
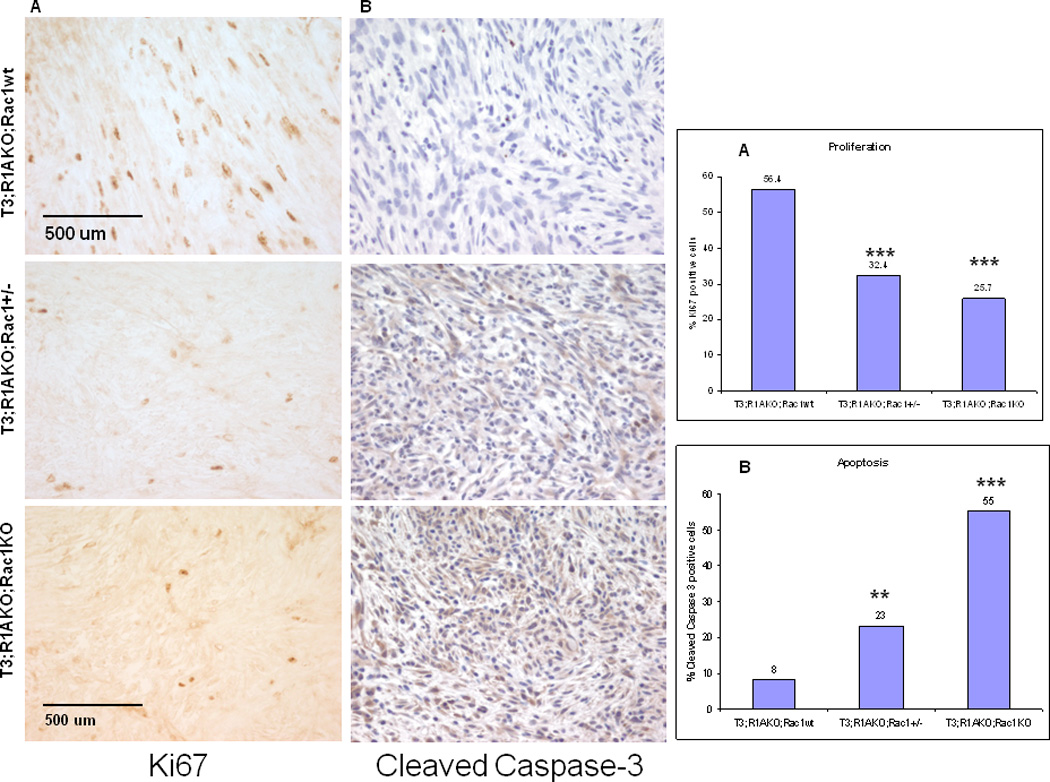
(A) Ki67 staining in the paraffin-embedded tumor sections from T3;R1aKO;Rac1WT, T3;R1aKO;Rac1Het and T3;R1aKO;Rac1KO mice, labeled as in Fig. 1. (B) Cleaved Caspase-3 staining in paraffin embedded sections of T3;R1aKO;Rac1WT, T3;R1aKO;Rac1Het and T3;R1aKO;Rac1KO tumors showing abundant staining in T3;R1aKO;Rac1KO tumors. (C) Proliferation from panel (A) was evaluated by determining the percentage of Ki67 positive cells in tumor sections. Six fields were counted per slide for each section in three slides for each tumor genotype. *** P<0.001
(D) Apoptosis from panel (B) was evaluated by determining the percentage of Cleaved caspase-3 positive cells in tumors sections. For panels (C) and (D), six fields were counted at 400X on slides of 3 independent tumors per group. *** p<0.001, ** p<0.01
Because T3;R1aKO;Rac1Het mice did not demonstrate a clinical reduction in tumor formation (unlike the T3;R1aKO;Rac1KO mice), we also studied markers for apoptosis in these tumor genotypes. Using cleaved caspase-3 as a marker for cells undergoing apoptosis (Fig. 2B, D), abundant activated caspase-3 was detected in T3;R1aKO;Rac1KO tumors whereas much less was detected in T3;R1aKO;Rac1WT (p=<0.0001). As above, the difference between T3;R1aKO;Rac1Het and T3;R1aKO;Rac1WT was noted and found to be significant (p=0.002).
To verify these findings, a similar analysis was performed using TUNEL as an additional marker for apoptosis (Supplemental Fig. 2). There was an obvious difference between T3;R1aKO;Rac1KO and those carrying 1 or 2 WT alleles of Rac1 (p=<0.0001 for the comparison of T3;R1aKO;Rac1KO vs. T3;R1aKO;Rac1WT tumors). Again, T3;R1aKO;Rac1Het tumors demonstrated a smaller but statistically significant increase in apoptosis compared to T3;R1aKO;Rac1WT tumors (p=0.0031).
Loss of activated Rac1 in the tumors
Tumors from T3;R1aKO;Rac1WT have previously been examined for loss of Prkar1a within the tumors (15). To confirm successful excision of Rac1 in tumor cells, we measured total and activated (GTP-bound) levels of Rac1 in tumors from T3;R1aKO;Rac1WT, T3;R1aKO;Rac1Het and T3;R1aKO;Rac1KO mice. As shown in Fig. 3A, GTP-bound Rac1 was significantly lower in T3;R1aKO;Rac1KO tumors compared to T3;R1aKO;Rac1WT. In contrast to the proliferation/apoptosis data, levels of GTP-Rac1 did not appear significantly different between tumors heterozygous or WT.
Figure 3. T3;R1aKO;Rac1KO tumors revealed lower levels of activated Rac1.
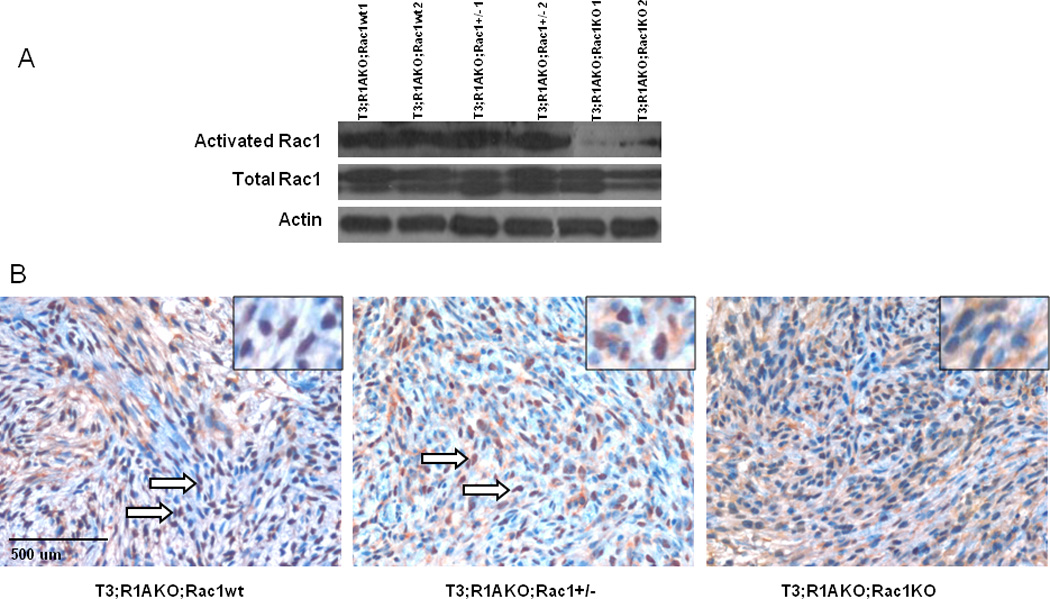
(A) Levels of activated and total Rac1 in Schwann cell tumor lysates. Β-actin is included as a loading control (B) Immunohistochemistry for Rac using the same antibody. Note that T3;R1aKO;Rac1WT and T3;R1aKO;Rac1Het tumors primarily exhibit nuclear staining (arrows) and cytoplasmic staining, whereas T3;R1aKO;Rac1KO tumors only exhibit cytoplasmic staining. Insets show higher power magnification of nuclear (T3;R1aKO;Rac1WT, T3;R1aKO;Rac1Het) and cytoplasmic (T3;R1aKO;Rac1KO) staining.
In these blots, we noticed that levels of total Rac1 in whole tumor lysates remained detectable despite the almost complete loss of GTP-bound Rac1 (Fig 3A, middle). To determine if this represented cross reactivity with other Rac isoforms or represented a contribution from stromal cells within the tumor, we analyzed Rac by immunohistochemistry using the same antibody (Fig. 3B). This analysis demonstrated that tumors carrying 1 or 2 WT alleles for Rac1 exhibited both nuclear and cytoplasmic staining; however, tumors with KO of Rac1 exhibited primarily cytoplasmic staining. We interpret this finding as indicating that Rac identified by Western blot and IHC represent other Rac isoforms. The GTP pull-down assay demonstrates that Rac1 was not activated in DKO tumors.
Effect of Rac1 ablation on NF2
Loss of NF2 is common event in human schwannomas, even those without a germline mutation in the gene (21). Consistent with this observation in human patients, our prior work demonstrated that ablation of Prkar1a in T3;R1aKO;Rac1WT associated schwannomas exhibited a post-transcriptional reduction of Nf2 (15). As Rac1 is a major downstream target of NF2 (22), we wanted to determine if ablation of Rac1 had any effects on Nf2 levels. As an initial study, we performed immunofluorescence on frozen sections of tumors from T3;R1aKO;Rac1WT, T3;R1aKO;Rac1Het, and T3;R1aKO;Rac1KO mice. As seen previously, T3;R1aKO;Rac1WT tumors demonstrate minimal if any staining for Nf2 in the tumor, although staining is retained in the tumor capsule (Fig. 4A, left)(15). Surprisingly, ablation of Rac1 led to restoration of Nf2 immunostaining in the tumor (Fig. 4A, right), whereas tumors heterozygous for Rac1 had a lower but detectable level of immunstained Nf2 (Fig. 4A, center). Positive staining in the surrounding tumor capsule served as an internal control for Nf2 reactivity in each sample (Fig 4A, insets). In order to verify that these changes were not artifacts of immunofluorescence, we isolated the central region of tumor tissue from all three groups of mice and prepared proteins for Western blotting, using rat Schwann cell line as a reference. As observed in the IF, T3;R1aKO;RacWT had a minimal amount of Nf2 protein, which increased with genetic reduction in Rac1 (Fig. 4B). To assess if phosphorylation of Nf2 was altered in response to these manipulations, we also used an antibody which specifically detect phospho-Ser518 in Nf2. Although increased pS518-Nf2 was detected in the T3;R1aKO;Rac1KO lysates, it paralleled increases in total Nf2, such that the ratio of phosphorylated to total Nf2 was not altered (Supplemental Fig. 3).
Figure 4. Nf2 Protein expression is restored by KO of Rac1 in Schwannomas.
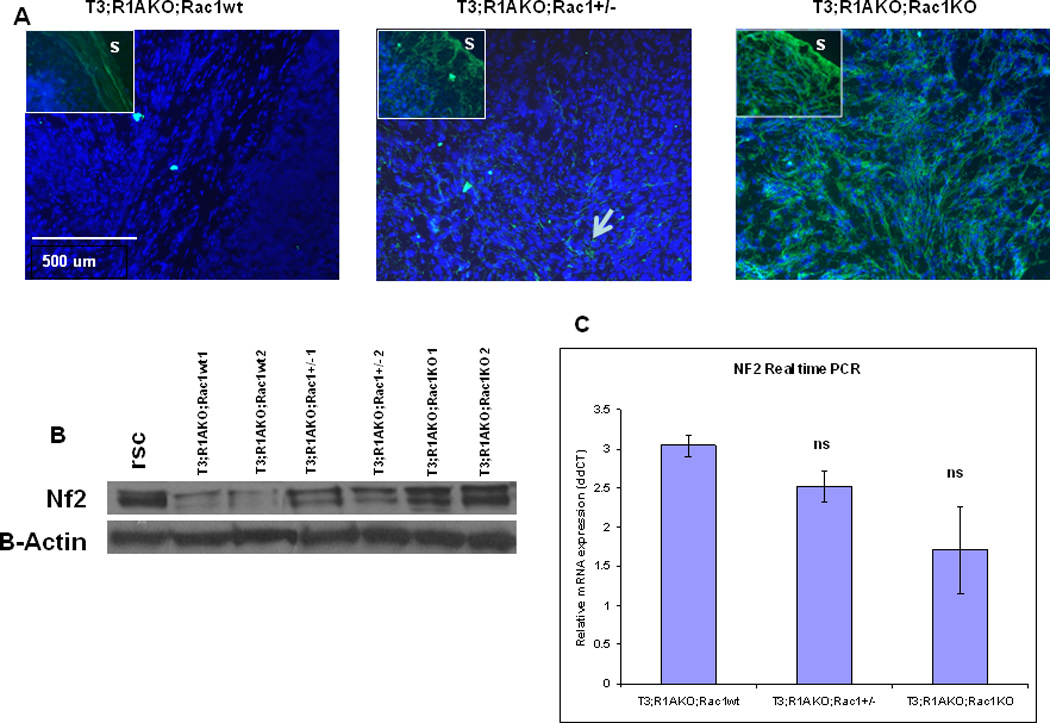
(A) Frozen tissue sections from the tumors from T3;R1aKO;Rac1WT, T3;R1aKO;Rac1Het and T3;R1aKO;RacKO mice were stained by immunofluorescence for Nf2 protein. The insets show the edge of the tumor with normal stroma (S) stained green as a positive control. Note the complete absence of intratumoral Nf2 in the T3;R1aKO;Rac1WT tumor, and its restoration in T3;R1aKO;Rac1KO tumors. Het tumors exhibit patchy staining for Nf2 (arrow). (B) Western Blot of Nf2 protein expression in tumor lysates. Rat Schwann cells are included as a reference. (C) Real-time PCR analysis of mRNA for Nf2 from WT sciatic nerves and T3;R1aKO;Rac1WT, T3;R1aKO;Rac1Het and T3;R1aKO;Rac1KO tumors. Results are shown as mean expression among all six tumors compared with WT sciatic nerves set to a value of 1. ΔΔCt was calculated compared with a Gapdh standard, and error bars represent the relative standard deviation.
Our previous study demonstrated that Nf2 protein reduction in T3;R1aKO;Rac1WT tumors was accompanied by increases in Nf2 mRNA. Analysis of Rac1 KO tumors by qRT-PCR demonstrated that levels of mRNA varied inversely with Nf2 protein levels (Fig. 4C). As previously observed, T3;R1aKO;Rac1WT tumors had the least Nf2 protein but highest mRNA levels, whereas T3;R1aKO;Rac1KO had highest protein levels with the lowest mRNA levels. Consistent with our prior data (15), T3;R1aKO;Rac1WT tumors had about 3-fold elevation of Nf2 mRNA compared to normal mouse sciatic nerve, whereas T3;R1aKO;Rac1KO tumors had a 1.7-fold elevation.
Rac1 downregulates Nf2 via Pak2
In order to corroborate the hypothesis that activated PKA caused downregulation of the Nf2 protein through the activation of Rac1, we introduced activated Rac1 into normal rat Schwann cells and studied the effect on Nf2 protein abundance. As observed, introduction of activated Rac1 (Rac1L61) led to a substantial decrease in Nf2 protein level (Fig. 5A) compared to Rac1WT. Activation of Rac1 in Schwann cells has been proposed to affect Nf2 independently of Nf1 (17). In agreement with this concept, introduction of Rac1L61 into rat Schwann cells had no effect on Nf1 levels (Supplemental Fig. 5A). Similarly, although there was some variability in Nf2 expression among mouse tumors, there was no significant correlation between Nf1 levels and genotype (Supplemental Fig. 5B).
Figure 5. Nf2 is downregulated through the action of Rac1-Pak2.
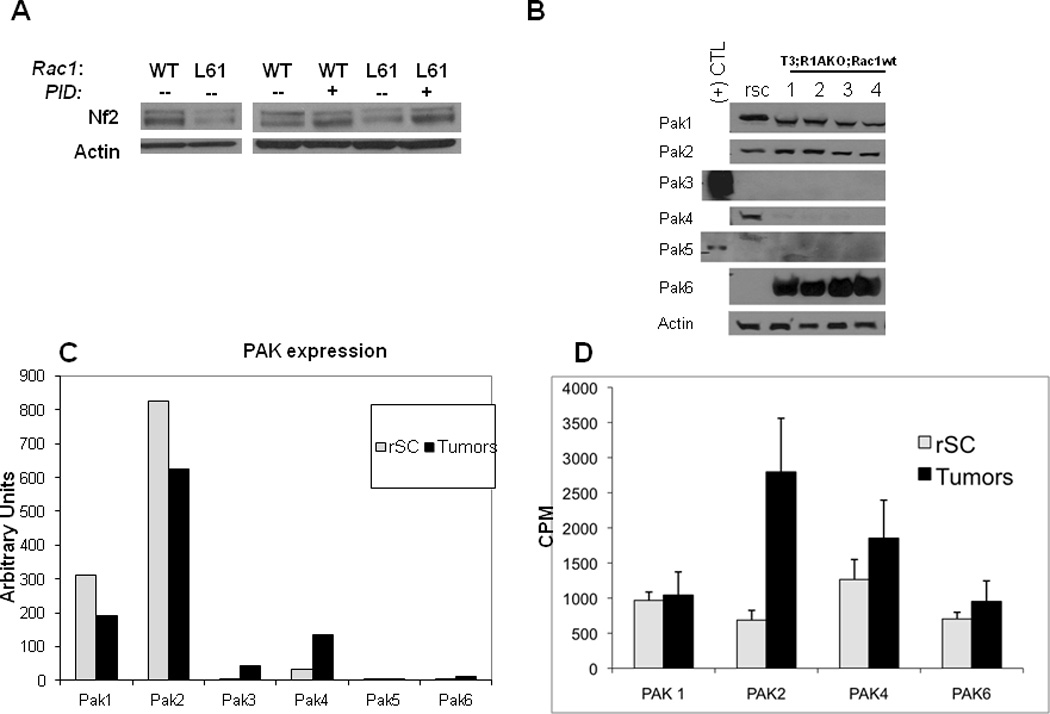
(A) Left: Transfection of rat Schwann cells (rsc) with WT or L61(constitutively active) Rac1. Right: Transfection of rsc with WT or L61 Rac with or without the Pak autoinhibitory domain (PID). Quantitation of the blot is shown in Supplemental Fig. 4. Shown is a representative blot from one of three independent experiments. (B) Western blotting of Pak isoforms from Tec3;R1aKO;Rac1WT tumors. (+) control lanes for Pak3 and Pak5 indicate HEK293 cells transfected with the respective Pak cDNAs. (C) mRNA expression level of Paks from WT rSC and T3;R1aKO;Rac1WT tumors by qRT-PCR. Normalized expression levels relative to Gapdh (set as 10,000 arbitrary units) is shown. (D) IP-kinase assays were performed for the Paks indicated. **p≤0.0001 for the comparison between WT and tumors. Note that Pak3 and Pak5 were not assayed due to extremely low protein levels.
Lastly, Rac1 is reported to signal through class I Paks, and this signaling is inhibited by the Pak1 autoinhibitory domain (PID) (23). To determine this, Schwann cells were co-transfected with Rac1L61 with or without PID. Inclusion of PID blocked the ability of Rac1L61 to cause Nf2 downregulation (Fig. 5A, right).
To understand the relation between Rac1 and Pak activation in vivo, we studied the expression and function of Paks in normal Schwann cells and in tumors from T3;R1aKO mice. Because mouse Schwann cells do not proliferate in culture, we used primary rat Schwann cells (rSCs) as a control after verifying that they express similar levels of Paks compared to mouse Schwann cells (Supplemental Fig. 6). Analysis of rSCs by immunblot (Fig. 5B) revealed production of Pak’s 1, 2, 4 and 6. In tumors, Paks 1 and 2 were expressed at levels similar to those in rSCs, whereas Pak4 was detectable but only at low levels. Notably, there was a marked increase in Pak6 production in tumors. At mRNA level (Fig. 5C), Pak1 and -2 exhibited highest level of relative expression, with Paks 3 and 4 showing modest increases in tumors compared with rSCs, despite low (Pak4) or undetectable (Pak3) protein. Pak5 was not detectable at the mRNA level, and Pak6 showed an increase in mRNA, although levels were still relatively low. Increase in Pak6 protein in the tumors appeared to be much larger than the change in mRNA level.
Since PAK protein levels may not correlate with activation status, we performed IP-kinase assays for Pak isoforms using lysates from rSCs and six T3;R1aKO tumors (Fig. 5D). In this analysis, we observed a significant elevation of the activity of Pak2. Although there were small changes in the activity of other Paks, none were significantly different compared to rSCs. We did not evaluate Pak3 and Pak5 because no expression was seen at either protein or mRNA level.
Lastly, to correlate ablation of Rac1 with changes in Pak activity, we compared the expression of Paks among T3;R1aKO;Rac1WT, T3;R1aKO;Rac1KO and T3;R1aKO;Rac1Het tumor lysates (Fig. 6A). In this analysis, we did not observe correlation of the levels of Pak1, 2, 4 or 6 with genotype. Differences between rSCs and T3;R1aKO;Rac1WT tumors were also observed in tumors lacking 1 or both alleles of Rac1. Because only Pak2 was activated in the T3;R1aKO;Rac1WT tumors, we repeated the analysis using lysates from each tumor groups. As shown in Fig. 6B, Pak2 activity in the T3;R1aKO;Rac1KO tumors was not different from rSCs, whereas T3;R1aKO;Rac1WT and T3;R1aKO;Rac1Het tumors exhibited higher activity. These data indicate that the Rac1 effect occurs through Pak signaling, specifically Pak2, in these tumors.
Figure 6. Pak2 hyperactivity is ablated by loss of Rac1 in tumors.
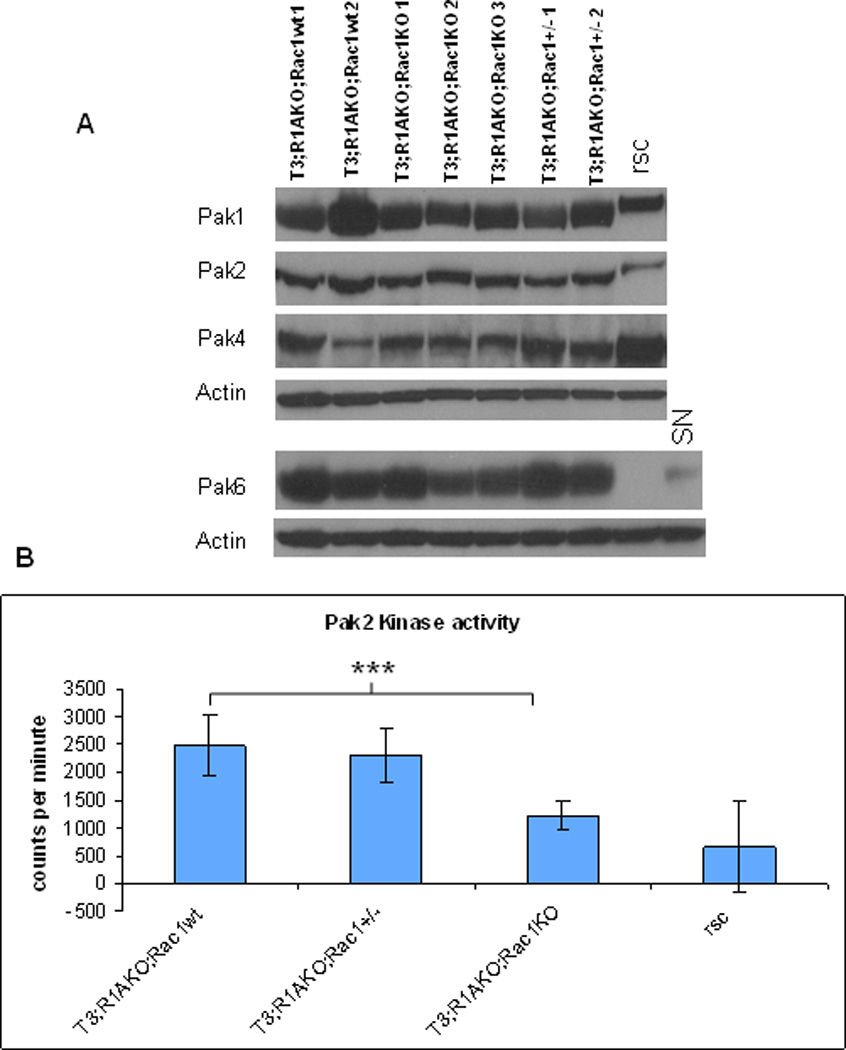
(A) Western blotting of expressed Paks (Pak1, -2, -4, and -6) in T3;R1aKO;Rac1WT, T3;R1aKO;Rac1Het, and T3;R1aKO;Rac1KO tumors. Normal rat Schwann cells (rSCs) or mouse sciatic nerve (SN) are shown as normal controls. Note that there is no significant difference in protein abundance in the three tumor group. (B) IP-kinase assay for Pak2 activity was performed in tumors or rSC’s. P<0.0001 (T3;R1aKO;Rac1WT vs T3;R1aKO;Rac1KO); p values were not significant for the comparisons between T3;R1aKO;Rac1WT and T3;R1aKO;Rac1Het, and for T3;R1aKO;Rac1KO vs rSC.
Discussion
Loss of PRKAR1A/Prkar1a tumor suppressor is tumorigenic in cAMP-responsive tissues, including Schwann cells, in both humans and mice (4, 20).
In this manuscript, we report the results of our investigation to determine if Rac1 is required for Prkar1a-associated Schwann cell tumorigenesis. Rac1 is known to play an important role in normal Schwann cell function, including the regulation of cell shape, polarity, migration, cytokinesis, gene transcription, apoptosis, cell cycle progression, cell adhesion promoting dynamic actin remodeling, lamellipodia formation and random cell migration (24–28). It is also responsible for the formation of myelin sheaths in central nervous system (29). Previous studies have shown that conditional ablation of Rac1 in the Schwann cell lineage affects radial sorting of axons and leads to a failure to form lamellipodia, necessary for proper Schwann cell process extension and stabilization (30–33). Interestingly, unlike the related small G-protein Rho (34), Rac1 lacks PKA phosphorylation sites. Although it has been suggested that integrin signaling may mediate PKA-Rac crosstalk (35), there is no known mechanism by which activation of PKA directly enhances Rac1 activity.
Based on this fact and prior reports that Nf2 serves as a negative regulator of Rac1 function (22, 36–37), we hypothesized that ablation of Rac1 from Prkar1a KO Schwann cell tumors would reduce tumor formation by reducing a key signaling mechanism downstream from Nf2.
Initial studies linking Rac1 and Nf2 showed that cells lacking Nf2 have increased levels of activated Rac1, as judged primarily by increases in downstream targets (22). The same phenomenon was observed in lysates from human schwannomas (38). Prior data has suggested that either Rac-activated Pak or cAMP-activated PKA can phosphorylate Nf2 on Ser518 and that this modification abrogates Nf2’s normal growth suppressive ability (8, 39).
Although ablation of Rac1 did, in fact, reduce tumor formation, our data suggests that the interplay between PKA, Rac1, and Nf2 in vivo appears to be more complex. Schwann cell tumors with activated PKA (caused by ablation of Prkar1a) do not exhibit hyperphosphorylated Nf2; rather, Nf2 protein is lost from tumors. When Rac1 was knocked out of these tumors, Nf2 was restored in the tumors that developed, suggesting that PKA’s effects are indirect and are mediated through Rac1 activation. Thus, Rac1’s ability to promote Schwann cell tumors thus may rely on its ability to suppress Nf2 protein abundance, rather than altering Nf2 function. This effect does not appear to be mediated by alterations in Nf2 phosphorylation. When re-expression of Nf2 in the double KO tumors occurs, it causes decreased proliferation and enhanced apoptosis, consistent with previous reports where both decreased proliferation (40–41) and increased apoptosis (42–43) were observed in Schwann cells transduced with Nf2.
The mechanism by which activation of Rac1 leads to downrregulation of Nf2 at the protein level remains obscure. Proteasomal degradation of mutant Nf2 isoforms has previously been demonstrated (44). Efforts to demonstrate enhanced proteasomal degradation of Nf2 in Prkar1a-null Schwann cells have not recapitulated this observation (Jones and Kirschner, unpublished observations). However, these studies may have been limited by the choice of cell line, as Rac1L61 induced Nf2 degradation, but only in primary cells. Alternatively, degradation of Nf2 may occur via other means yet to be identified. Other possibilities exist, including induction of microRNAs targeted to Nf2 (45) or the direct inhibition of translation of the mRNA. Efforts to define this mechanism are currently underway.
Our observations regarding Paks also merit mention. Regardless of mechanism, our data strongly indicate that Pak2 is the Pak isoform downstream from Rac1 which mediates Rac1’s ability to downregulate Nf2. This effect is specific for Nf2, as Nf1 is not affected by modulation of Rac1-Pak signaling. More intriguing is the relative lack of correspondence between Pak isoform mRNA, protein, and activity levels (Fig. 5). These studies highlight the need to specifically investigate these kinases at functional level, and not solely through mRNA or protein abundance. It is possible that the same intracellular pathways causing dissociation between Nf2 mRNA and protein levels (Fig. 4) have this same effect on Paks, especially Paks 4 and 6. Despite high levels of Pak6 in tumors, we do not observe activation of this kinase, and its function in schwannomas remains obscure. Recent data suggests that Pak6 can phosphorylate and inactivate the proapoptotic protein Bad in prostate cancer cells (46). However, this mechanism may not be applicable to schwannomas, which show increased levels of apoptosis in DKO tumors despite high levels of Pak6.
In conclusion, KO of PRKAR1A/Prkar1a in Schwann cell lineage leads to loss of Nf2 at protein level and that this loss appears to be mediated by activation of Rac1 in this tissue. Our data indicates that the Rac1 effect is mediated by Type I Paks specifically Pak2. These data should lead to an enhanced understanding of the regulation of Nf2 in vivo, and suggests that inhibition of Rac1 or Pak2 may be a viable therapy for treating Schwann cell tumors.
Materials and Methods
Mouse experiments
All genetically modified animals were maintained in a sterile environment with 12-hour light/dark cycles under the highest standards of ethical care under an IACUC-approved protocol. Derivation of TEC3 (14), Prkar1aloxP (20), and Rac1loxP (47) has previously been described. TEC3;Prkar1aloxP/loxP mice (T3;R1aKO or T3;R1aKO;RacWT) were designated TEC3KO in our previous paper (15). TEC3;Prkar1aloxP/loxP;Rac1loxP/loxP (T3;R1aKO;RacKO) and TEC3;Prkar1aloxP/loxP;Rac1loxP/+ (T3;R1aKO;RacHet) were generated by mating of appropriate straints. TEC3;Rac1KO mice were also generated as a control group.
In this study, T3;R1aKO;RacWT (n=85), T3;R1aKO;RacHet (n=36) and T3;R1aKO;RacKO (n=52) animals were monitored weekly for tumor onset, which was defined as the age at which a tumor of 0.5-cm linear dimension (as measured by calipers) was first detected. Mice with bilateral tumors were designated as having tumor onset at time the first tumor reached 0.5 cm.
Rac1 Activation Assays
Active Rac1 was affinity precipitated using PAK1-PBD, separated by SDS-PAGE, and immunoblotted with anti-Rac1 antibody according to manufacturer's instructions (Millipore, cat#17–441). Activity assays were performed on 5 tumors of each genotype. Total Rac1 was measured from corresponding whole tumor lysates normalized to β-Actin (Sigma, St. Louis MO) as loading control. Quantitation of blots was determined using Genetools imaging software (Spectronics Corporation, Westbury, NY).
Western blot
Proteins from tumors were homogenized and lysed under non-denaturing conditions (Cell lysis buffer, Cell Signaling, Danvers MA). Samples were separated on NuPAGE® 4–12% Bis-Tris gels (Invitrogen, Carlsbad, CA), transferred to nitrocellulose, and probed with the following antibodies: PAK1 (#2602); PAK2 (#2608); PAK3 (#2609); and PAK4 (#3242) (CST, Danvers, MA); NF1 (sc-67); NF2 (sc-331); PAK5 (sc-22156); PAK6 (H-300) (Santa Cruz Biotechnology, CA); β-Actin (Sigma).
Histology
In order to visualize cre activity using LacZ staining, mice were bred to carry ROSA26lacZ allele (48). Pups at postnatal day 2 (P2) were sacrificed and heads washed in cold PBS. Whole-mount X-gal staining was performed as described (49). Heads were visualized under dissecting microscope and images taken using Zeiss digital camera with Axio Vision 4.3 software (Carl Zeiss GmbH, Jena, Germany). Specimens were dehydrated and embedded in paraffin. Sections were cut through trigeminal ganglion and visualized and images captured under a microscope (Olympus BX50, Japan) with Spot Basic v4.1 software.
Hematoxylin and Eosin (H/E) staining was performed using Leica autostainer (Leica Microsystems Inc., Bannockburn, IL). Alcian blue staining was performed manually in 1% Alcian blue (Sigma Aldrich) prepared in 0.1 N HCl for 30 min. Nuclei were counterstained using Nuclear Fast Red (Sigma) for 5 min, then sections were dehydrated and cover-slipped.
Immunofluorescence/Immunohistochemistry (IF/IHC)
For IF, freshly dissected tumor tissues were frozen in Tissue Tek® Optimal Cutting Temperature Compound (Sakura Finetek U.S.A. Inc., Torrence, CA). 5 µm sections were fixed using cold acetone and permeabilized in 0.1% sodium citrate with 0.1% Triton-X100 detergent (Sigma, St. Louis, MO). Primary antibody was prepared in 3% BSA in PBS. Slides were incubated with primary antibodies at 4°C overnight, washed, and incubated with Alexafluor-488 conjugated secondary antibodies (Invitrogen, Carlsbad, CA) for 25 min in dark. Samples were then washed, mounted with DAPI mounting medium (Vector Labs), and visualized using Zeiss Axioskop 40 microscope and Axiovision software.
For IHC, samples were fixed overnight in 10% formalin, processed, and embedded in paraffin. IHC was developed by adding DAB chromogen reagent (Vector Labs) to each section for 1–2 min before counterstaining with hematoxylin, dehydration, and cover-slipping. Following antibodies were used: Cleaved caspase-3 (CST#9661), Ki67 (Clone TEC-3, DAKO, Carpinteria CA). TUNEL staining was performing using a commercial kit per the manufacturer’s instructions (GenScript., Piscataway, NJ#L00297). For Rac1 IHC, we used the same antibodies as for Rac1 pull down. Samples were analyzed on an Olympus BX50 microscope, and images captured using Spot Basic v4.1 software.
Quantitative Real-Time PCR
RNA was isolated from mouse tumors and converted to cDNA with BioRad iScript cDNA Synthesis Kit (BioRad Laboratories, Hercules, CA). cDNA was subject to qRT-PCR using iQ SYBR Green Supermix Kit (BioRad) as per manufacturer’s instructions. Expression data were pooled for all experiments to derive the data presented. Reactions were each performed in triplicate. Primers are previously described (15).
Cell culture and transfection
Primary rat Schwann cells (rSCs) were isolated from neonatal rat pups using standard methods (50). pRK5-myc-Rac1-wt and pRK5-myc-Rac1-Q61L (constitutively active) plasmids were generated in lab of Dr. Gary Bokoch and obtained from Addgene (plasmids 12985 and 12983, respectively). The PAK autoinhibitory domain (PID) construct has been described (23) and was gracious gift of Dr. Jonathan Chernoff. Cells transfections were performed with Amaxa Nucleofector using reagents from manufacturer (Rat Neural Stem Cell Nucleofector® Kit from Lonza).
PAK IP-Kinase Assay
200 ug protein was used as starting material to immunoprecipitate (IP) each Pak isoform for subsequent kinase activity assays. For our initial studies, we used lysates from rSCs and 6 TEC3KO tumors for analysis. For comparison among tumors from T3;R1aKO;RacWT, T3;R1aKO;RacHet and T3;R1aKO;RacKO mice, 3 independent tumors were analyzed. In brief, samples were pre-cleared with 1.0 ug rabbit IgG prior to IP, and the antibodies used for PAK were same as those used for Western blots. Protein A/G beads (Santa Cruz Biotechnology) were used to pull down the IgG-Pak complexes which were subsequently resuspended in and equal volume of 0.5 mg/ml myelin basic protein (Sigma, St. Louis, MO). Kinase assays were performed by adding 3× hot mix containing 50 mM Hepes (pH 7.5), 10 mM MgCl2, 150 uM ATP, and 10 uCi/reaction γ-32P ATP. Samples were incubated at 30°C for 30 min and then 10 ul of each reaction was spotted on P81 paper. Counts per minute were read on scintillation counter, and samples normalized to background readings from negative controls. Each sample was tested in triplicate for kinase activity to control for variability.
Statistics
Tumor onset was analyzed by generation of Kaplan-Meier curves. Based on tumor-free survival curve shown we used a double sided log rank test at alpha=0.05 to compare time to tumor onset of the TEC3KO mice (as the ‘baseline’) with other mice. Unpaired t tests were used for all other analyses assuming Gaussian populations with a 95% confidence interval. Data are presented as mean ± SE. Differences were analyzed with Student t test, and significance set at P less than 0.05.
Supplementary Material
A. Whole-mount staining in two days old pups from Tec3;Rac1KO and B. WT mice. D and E are histological sections through trigeminal ganglion of lacZ-stained Tec3;Rac1KO and WT from pups shown at 40X power. Whole-mount embryo staining of animals localizes cre activity to the lateral aspect of the face.
(A) Western Blot of Nf1 protein in rSC cells co-transfected with WT or L61 (constitutively active) Rac1, with or without the Pak autoinhibitory domain (PID). The Nf1 expression did not change in these studies. (B) NF1 expression was evaluated by Western blot in tumor lysates. Although Nf1 protein levels are downregulated in the tumors compare to rat Schwann cells (rSCs), there was no significant difference seen among tumor groups.
(A and B) Apoptosis in mouse tumor tumors was confirmed by TUNEL analysis. A) TUNEL staining in tissue sections. B) Quantification of TUNEL data. The analysis was performed the same way as described in the text for analysis of cleaved caspase-3.
Images were scanned and analyzed by ImageJ software.
The lower panel shows aWestern blot of phosphoSer-518 Nf2 and total Nf2 in T3;R1aKO;Rac1WT and T3;R1aKO;Rac1KO schwannomas The top panel shows the ratio of phospho- to total Nf2 when normalized for loading to β-actin.
Levels of mRNA for Paks1-6 from rSC and mSC were measured by quantitative real-time PCR. ΔΔCt was calculated compared with a Gapdh standard, and error bars represent the relative standard deviation. No significant difference was observed between rSCs and mSCs expression levels.
ACKNOWLEDGEMENTS
This work was supported by grant from the Department of Defense (DOD) Neurofibromatosis program. We thank Dr Matthew D Ringel and Dr Motoyasu Saji for insightful discussions.
Footnotes
Supplementary Information is available at Oncogene’s website.
REFERENCES
- 1.Kissil JL, Blakeley JO, Ferner RE, Huson SM, Kalamarides M, Mautner VF, et al. What's new in neurofibromatosis? Proceedings from the 2009 NF Conference: new frontiers. Am J Med Genet A. 2010 Feb;152A(2):269–283. doi: 10.1002/ajmg.a.33189. [DOI] [PMC free article] [PubMed] [Google Scholar]
- 2.Hulsebos TJ, Plomp AS, Wolterman RA, Robanus-Maandag EC, Baas F, Wesseling P. Germline mutation of INI1/SMARCB1 in familial schwannomatosis. Am J Hum Genet. 2007 Apr;80(4):805–810. doi: 10.1086/513207. [DOI] [PMC free article] [PubMed] [Google Scholar]
- 3.Kirschner LS, Sandrini F, Monbo J, Lin JP, Carney JA, Stratakis CA. Genetic heterogeneity and spectrum of mutations of the PRKAR1A gene in patients with the carney complex. Hum Mol Genet. 2000 Dec 12;9(20):3037–3046. doi: 10.1093/hmg/9.20.3037. [DOI] [PubMed] [Google Scholar]
- 4.Kirschner LS, Carney JA, Pack SD, Taymans SE, Giatzakis C, Cho YS, et al. Mutations of the gene encoding the protein kinase A type I-alpha regulatory subunit in patients with the Carney complex. Nat Genet. 2000 Sep;26(1):89–92. doi: 10.1038/79238. [DOI] [PubMed] [Google Scholar]
- 5.Kim HA, DeClue JE, Ratner N. cAMP-dependent protein kinase A is required for Schwann cell growth: interactions between the cAMP and neuregulin/tyrosine kinase pathways. J Neurosci Res. 1997 Jul 15;49(2):236–247. [PubMed] [Google Scholar]
- 6.Howe DG, McCarthy KD. Retroviral inhibition of cAMP-dependent protein kinase inhibits myelination but not Schwann cell mitosis stimulated by interaction with neurons. J Neurosci. 2000 May 15;20(10):3513–3521. doi: 10.1523/JNEUROSCI.20-10-03513.2000. [DOI] [PMC free article] [PubMed] [Google Scholar]
- 7.Izawa I, Tamaki N, Saya H. Phosphorylation of neurofibromatosis type 1 gene product (neurofibromin) by cAMP-dependent protein kinase. FEBS Lett. 1996 Mar 11;382(1–2):53–59. doi: 10.1016/0014-5793(96)00137-8. [DOI] [PubMed] [Google Scholar]
- 8.Alfthan K, Heiska L, Gronholm M, Renkema GH, Carpen O. Cyclic AMP-dependent protein kinase phosphorylates merlin at serine 518 independently of p21-activated kinase and promotes merlin-ezrin heterodimerization. J Biol Chem. 2004 Apr 30;279(18):18559–18566. doi: 10.1074/jbc.M313916200. [DOI] [PubMed] [Google Scholar]
- 9.Laulajainen M, Muranen T, Carpen O, Gronholm M. Protein kinase A-mediated phosphorylation of the NF2 tumor suppressor protein merlin at serine 10 affects the actin cytoskeleton. Oncogene. 2008 May 22;27(23):3233–3243. doi: 10.1038/sj.onc.1210988. [DOI] [PubMed] [Google Scholar]
- 10.Kissil JL, Johnson KC, Eckman MS, Jacks T. Merlin phosphorylation by p21-activated kinase 2 and effects of phosphorylation on merlin localization. J Biol Chem. 2002 Mar 22;277(12):10394–10399. doi: 10.1074/jbc.M200083200. [DOI] [PubMed] [Google Scholar]
- 11.Xiao GH, Beeser A, Chernoff J, Testa JR. p21-activated kinase links Rac/Cdc42 signaling to merlin. J Biol Chem. 2002 Jan 11;277(2):883–886. doi: 10.1074/jbc.C100553200. [DOI] [PubMed] [Google Scholar]
- 12.Thaxton C, Lopera J, Bott M, Baldwin ME, Kalidas P, Fernandez-Valle C. Phosphorylation of the NF2 tumor suppressor in Schwann cells is mediated by Cdc42-Pak and requires paxillin binding. Mol Cell Neurosci. 2007 Feb;34(2):231–242. doi: 10.1016/j.mcn.2006.11.003. [DOI] [PubMed] [Google Scholar]
- 13.Kim HA, Ratner N, Roberts TM, Stiles CD. Schwann cell proliferative responses to cAMP and Nf1 are mediated by cyclin D1. J Neurosci. 2001 Feb 15;21(4):1110–1116. doi: 10.1523/JNEUROSCI.21-04-01110.2001. [DOI] [PMC free article] [PubMed] [Google Scholar]
- 14.Tonks ID, Nurcombe V, Paterson C, Zournazi A, Prather C, Mould AW, et al. Tyrosinase-Cre mice for tissue-specific gene ablation in neural crest and neuroepithelial-derived tissues. Genesis. 2003 Nov;37(3):131–138. doi: 10.1002/gene.10242. [DOI] [PubMed] [Google Scholar]
- 15.Jones GN, Tep C, Towns WH, 2nd, Mihai G, Tonks ID, Kay GF, et al. Tissue-specific ablation of Prkar1a causes schwannomas by suppressing neurofibromatosis protein production. Neoplasia. 2008 Nov;10(11):1213–1221. doi: 10.1593/neo.08652. [DOI] [PMC free article] [PubMed] [Google Scholar]
- 16.Jones GN, Pringle DR, Yin Z, Carlton MM, Powell KA, Weinstein MB, et al. Neural crest-specific loss of Prkar1a causes perinatal lethality resulting from defects in intramembranous ossification. Mol Endocrinol. 2010 Aug;24(8):1559–1568. doi: 10.1210/me.2009-0439. [DOI] [PMC free article] [PubMed] [Google Scholar]
- 17.Okada T, You L, Giancotti FG. Shedding light on Merlin's wizardry. Trends Cell Biol. 2007 May;17(5):222–229. doi: 10.1016/j.tcb.2007.03.006. [DOI] [PubMed] [Google Scholar]
- 18.Yin Z, Williams-Simons L, Rawahneh L, Asa S, Kirschner LS. Development of a pituitary-specific cre line targeted to the Pit-1 lineage. Genesis. 2008 Jan;46(1):37–42. doi: 10.1002/dvg.20362. [DOI] [PubMed] [Google Scholar]
- 19.Stemmer-Rachamimov AO, Louis DN, Nielsen GP, Antonescu CR, Borowsky AD, Bronson RT, et al. Comparative pathology of nerve sheath tumors in mouse models and humans. Cancer Res. 2004 May 15;64(10):3718–3724. doi: 10.1158/0008-5472.CAN-03-4079. [DOI] [PubMed] [Google Scholar]
- 20.Kirschner LS, Kusewitt DF, Matyakhina L, Towns WH, 2nd, Carney JA, Westphal H, et al. A mouse model for the Carney complex tumor syndrome develops neoplasia in cyclic AMP-responsive tissues. Cancer Res. 2005 Jun 1;65(11):4506–4514. doi: 10.1158/0008-5472.CAN-05-0580. [DOI] [PubMed] [Google Scholar]
- 21.Sainz J, Huynh DP, Figueroa K, Ragge NK, Baser ME, Pulst SM. Mutations of the neurofibromatosis type 2 gene and lack of the gene product in vestibular schwannomas. Hum Mol Genet. 1994 Jun;3(6):885–891. doi: 10.1093/hmg/3.6.885. [DOI] [PubMed] [Google Scholar]
- 22.Shaw RJ, Paez JG, Curto M, Yaktine A, Pruitt WM, Saotome I, et al. The Nf2 tumor suppressor, merlin, functions in Rac-dependent signaling. Dev Cell. 2001 Jul;1(1):63–72. doi: 10.1016/s1534-5807(01)00009-0. [DOI] [PubMed] [Google Scholar]
- 23.Beeser A, Jaffer ZM, Hofmann C, Chernoff J. Role of group A p21-activated kinases in activation of extracellular-regulated kinase by growth factors. J Biol Chem. 2005 Nov 4;280(44):36609–36615. doi: 10.1074/jbc.M502306200. [DOI] [PubMed] [Google Scholar]
- 24.Bashour AM, Meng JJ, Ip W, MacCollin M, Ratner N. The neurofibromatosis type 2 gene product, merlin, reverses the F-actin cytoskeletal defects in primary human Schwannoma cells. Mol Cell Biol. 2002 Feb;22(4):1150–1157. doi: 10.1128/MCB.22.4.1150-1157.2002. [DOI] [PMC free article] [PubMed] [Google Scholar]
- 25.Pelton PD, Sherman LS, Rizvi TA, Marchionni MA, Wood P, Friedman RA, et al. Ruffling membrane, stress fiber, cell spreading and proliferation abnormalities in human Schwannoma cells. Oncogene. 1998 Oct 29;17(17):2195–2209. doi: 10.1038/sj.onc.1202141. [DOI] [PubMed] [Google Scholar]
- 26.Cotteret S, Chernoff J. The evolutionary history of effectors downstream of Cdc42 and Rac. Genome Biol. 2002;3(2) doi: 10.1186/gb-2002-3-2-reviews0002. REVIEWS0002. [DOI] [PMC free article] [PubMed] [Google Scholar]
- 27.Pankov R, Endo Y, Even-Ram S, Araki M, Clark K, Cukierman E, et al. A Rac switch regulates random versus directionally persistent cell migration. J Cell Biol. 2005 Aug 29;170(5):793–802. doi: 10.1083/jcb.200503152. [DOI] [PMC free article] [PubMed] [Google Scholar]
- 28.Flaiz C, Chernoff J, Ammoun S, Peterson JR, Hanemann CO. PAK kinase regulates Rac GTPase and is a potential target in human schwannomas. Exp Neurol. 2009 Jul;218(1):137–144. doi: 10.1016/j.expneurol.2009.04.019. [DOI] [PMC free article] [PubMed] [Google Scholar]
- 29.Thurnherr T, Benninger Y, Wu X, Chrostek A, Krause SM, Nave KA, et al. Cdc42 and Rac1 signaling are both required for and act synergistically in the correct formation of myelin sheaths in the CNS. J Neurosci. 2006 Oct 4;26(40):10110–10119. doi: 10.1523/JNEUROSCI.2158-06.2006. [DOI] [PMC free article] [PubMed] [Google Scholar]
- 30.Feltri ML, Suter U, Relvas JB. The function of RhoGTPases in axon ensheathment and myelination. Glia. 2008 Nov 1;56(14):1508–1517. doi: 10.1002/glia.20752. [DOI] [PMC free article] [PubMed] [Google Scholar]
- 31.Chan JR. Myelination: all about Rac 'n' roll. J Cell Biol. 2007 Jun 18;177(6):953–955. doi: 10.1083/jcb.200705105. [DOI] [PMC free article] [PubMed] [Google Scholar]
- 32.Krause S, Stendel C, Senderek J, Relvas JB, Suter U. Small Rho GTPases are key regulators of peripheral nerve biology in health and disease. J Peripher Nerv Syst. 2008 Sep;13(3):188–199. doi: 10.1111/j.1529-8027.2008.00177.x. [DOI] [PubMed] [Google Scholar]
- 33.Benninger Y, Thurnherr T, Pereira JA, Krause S, Wu X, Chrostek-Grashoff A, et al. Essential and distinct roles for cdc42 and rac1 in the regulation of Schwann cell biology during peripheral nervous system development. J Cell Biol. 2007 Jun 18;177(6):1051–1061. doi: 10.1083/jcb.200610108. [DOI] [PMC free article] [PubMed] [Google Scholar]
- 34.Lang P, Gesbert F, Delespine-Carmagnat M, Stancou R, Pouchelet M, Bertoglio J. Protein kinase A phosphorylation of RhoA mediates the morphological and functional effects of cyclic AMP in cytotoxic lymphocytes. Embo J. 1996 Feb 1;15(3):510–519. [PMC free article] [PubMed] [Google Scholar]
- 35.O'Connor KL, Mercurio AM. Protein kinase A regulates Rac and is required for the growth factor-stimulated migration of carcinoma cells. J Biol Chem. 2001 Dec 21;276(51):47895–47900. doi: 10.1074/jbc.M107235200. [DOI] [PubMed] [Google Scholar]
- 36.Okada T, Lopez-Lago M, Giancotti FG. Merlin/NF-2 mediates contact inhibition of growth by suppressing recruitment of Rac to the plasma membrane. J Cell Biol. 2005 Oct 24;171(2):361–371. doi: 10.1083/jcb.200503165. [DOI] [PMC free article] [PubMed] [Google Scholar]
- 37.Kissil JL, Wilker EW, Johnson KC, Eckman MS, Yaffe MB, Jacks T. Merlin, the product of the Nf2 tumor suppressor gene, is an inhibitor of the p21-activated kinase, Pak1. Mol Cell. 2003 Oct;12(4):841–849. doi: 10.1016/s1097-2765(03)00382-4. [DOI] [PubMed] [Google Scholar]
- 38.Kaempchen K, Mielke K, Utermark T, Langmesser S, Hanemann CO. Upregulation of the Rac1/JNK signaling pathway in primary human schwannoma cells. Hum Mol Genet. 2003 Jun 1;12(11):1211–1221. doi: 10.1093/hmg/ddg146. [DOI] [PubMed] [Google Scholar]
- 39.Thaxton C, Lopera J, Bott M, Fernandez-Valle C. Neuregulin and laminin stimulate phosphorylation of the NF2 tumor suppressor in Schwann cells by distinct protein kinase A and p21-activated kinase-dependent pathways. Oncogene. 2008 Apr 24;27(19):2705–2715. doi: 10.1038/sj.onc.1210923. [DOI] [PubMed] [Google Scholar]
- 40.Morrison H, Sherman LS, Legg J, Banine F, Isacke C, Haipek CA, et al. The NF2 tumor suppressor gene product, merlin, mediates contact inhibition of growth through interactions with CD44. Genes Dev. 2001 Apr 15;15(8):968–980. doi: 10.1101/gad.189601. [DOI] [PMC free article] [PubMed] [Google Scholar]
- 41.Xiao GH, Gallagher R, Shetler J, Skele K, Altomare DA, Pestell RG, et al. The NF2 tumor suppressor gene product, merlin, inhibits cell proliferation and cell cycle progression by repressing cyclin D1 expression. Mol Cell Biol. 2005 Mar;25(6):2384–2394. doi: 10.1128/MCB.25.6.2384-2394.2005. [DOI] [PMC free article] [PubMed] [Google Scholar]
- 42.Schulze KM, Hanemann CO, Muller HW, Hanenberg H. Transduction of wild-type merlin into human schwannoma cells decreases schwannoma cell growth and induces apoptosis. Hum Mol Genet. 2002 Jan 1;11(1):69–76. doi: 10.1093/hmg/11.1.69. [DOI] [PubMed] [Google Scholar]
- 43.Herrlich P, Morrison H, Sleeman J, Orian-Rousseau V, Konig H, Weg-Remers S, et al. CD44 acts both as a growth- and invasiveness-promoting molecule and as a tumor-suppressing cofactor. Ann N Y Acad Sci. 2000 Jun;910:106–118. doi: 10.1111/j.1749-6632.2000.tb06704.x. discussion 18–20. [DOI] [PubMed] [Google Scholar]
- 44.Gautreau A, Manent J, Fievet B, Louvard D, Giovannini M, Arpin M. Mutant products of the NF2 tumor suppressor gene are degraded by the ubiquitin-proteasome pathway. J Biol Chem. 2002 Aug 30;277(35):31279–31282. doi: 10.1074/jbc.C200125200. [DOI] [PubMed] [Google Scholar]
- 45.Meng F, Henson R, Wehbe-Janek H, Smith H, Ueno Y, Patel T. The MicroRNA let-7a modulates interleukin-6-dependent STAT-3 survival signaling in malignant human cholangiocytes. J Biol Chem. 2007 Mar 16;282(11):8256–8264. doi: 10.1074/jbc.M607712200. [DOI] [PubMed] [Google Scholar]
- 46.Zhang M, Siedow M, Saia G, Chakravarti A. Inhibition of p21-activated kinase 6 (PAK6) increases radiosensitivity of prostate cancer cells. Prostate. 2010 Jun 1;70(8):807–816. doi: 10.1002/pros.21114. [DOI] [PMC free article] [PubMed] [Google Scholar]
- 47.Glogauer M, Marchal CC, Zhu F, Worku A, Clausen BE, Foerster I, et al. Rac1 deletion in mouse neutrophils has selective effects on neutrophil functions. J Immunol. 2003 Jun 1;170(11):5652–5657. doi: 10.4049/jimmunol.170.11.5652. [DOI] [PubMed] [Google Scholar]
- 48.Soriano P. Generalized lacZ expression with the ROSA26 Cre reporter strain. Nat Genet. 1999 Jan;21(1):70–71. doi: 10.1038/5007. [DOI] [PubMed] [Google Scholar]
- 49.Crabtree JS, Scacheri PC, Ward JM, McNally SR, Swain GP, Montagna C, et al. Of mice and MEN1: Insulinomas in a conditional mouse knockout. Mol Cell Biol. 2003 Sep;23(17):6075–6085. doi: 10.1128/MCB.23.17.6075-6085.2003. [DOI] [PMC free article] [PubMed] [Google Scholar]
- 50.Brockes JP, Fields KL, Raff MC. Studies on cultured rat Schwann cells. I Establishment of purified populations from cultures of peripheral nerve. Brain Res. 1979 Apr 6;165(1):105–118. doi: 10.1016/0006-8993(79)90048-9. [DOI] [PubMed] [Google Scholar]
Associated Data
This section collects any data citations, data availability statements, or supplementary materials included in this article.
Supplementary Materials
A. Whole-mount staining in two days old pups from Tec3;Rac1KO and B. WT mice. D and E are histological sections through trigeminal ganglion of lacZ-stained Tec3;Rac1KO and WT from pups shown at 40X power. Whole-mount embryo staining of animals localizes cre activity to the lateral aspect of the face.
(A) Western Blot of Nf1 protein in rSC cells co-transfected with WT or L61 (constitutively active) Rac1, with or without the Pak autoinhibitory domain (PID). The Nf1 expression did not change in these studies. (B) NF1 expression was evaluated by Western blot in tumor lysates. Although Nf1 protein levels are downregulated in the tumors compare to rat Schwann cells (rSCs), there was no significant difference seen among tumor groups.
(A and B) Apoptosis in mouse tumor tumors was confirmed by TUNEL analysis. A) TUNEL staining in tissue sections. B) Quantification of TUNEL data. The analysis was performed the same way as described in the text for analysis of cleaved caspase-3.
Images were scanned and analyzed by ImageJ software.
The lower panel shows aWestern blot of phosphoSer-518 Nf2 and total Nf2 in T3;R1aKO;Rac1WT and T3;R1aKO;Rac1KO schwannomas The top panel shows the ratio of phospho- to total Nf2 when normalized for loading to β-actin.
Levels of mRNA for Paks1-6 from rSC and mSC were measured by quantitative real-time PCR. ΔΔCt was calculated compared with a Gapdh standard, and error bars represent the relative standard deviation. No significant difference was observed between rSCs and mSCs expression levels.