

Abstract
Whole-genome sequencing across multiple samples in a population provides an unprecedented opportunity for comprehensively characterizing the polymorphic variants in the population. Although the 1000 Genomes Project (1KGP) has offered brief insights into the value of population-level sequencing, the low coverage has compromised the ability to confidently detect rare and low-frequency variants. In addition, the composition of populations in the 1KGP is not complete, despite the fact that the study design has been extended to more than 2,500 samples from more than 20 population groups. The Malays are one of the Austronesian groups predominantly present in Southeast Asia and Oceania, and the Singapore Sequencing Malay Project (SSMP) aims to perform deep whole-genome sequencing of 100 healthy Malays. By sequencing at a minimum of 30× coverage, we have illustrated the higher sensitivity at detecting low-frequency and rare variants and the ability to investigate the presence of hotspots of functional mutations. Compared to the low-pass sequencing in the 1KGP, the deeper coverage allows more functional variants to be identified for each person. A comparison of the fidelity of genotype imputation of Malays indicated that a population-specific reference panel, such as the SSMP, outperforms a cosmopolitan panel with larger number of individuals for common SNPs. For lower-frequency (<5%) markers, a larger number of individuals might have to be whole-genome sequenced so that the accuracy currently afforded by the 1KGP can be achieved. The SSMP data are expected to be the benchmark for evaluating the value of deep population-level sequencing versus low-pass sequencing, especially in populations that are poorly represented in population-genetics studies.
Introduction
Genome-wide association studies (GWASs) have in recent years successfully identified many variants to be associated with complex diseases and common traits. This has been facilitated largely by the SNP database of the International HapMap Project, which characterized the SNP allele frequencies and extent of linkage disequilibrium (LD) between neighboring SNPs present in major population groups in the world.1–3 SNPs on most commercial arrays were elected from polymorphism data generated in Europeans, Africans, and East Asians,2,4 and indeed, even the early-generation genome-wide association arrays5,6 are already leveraging such information. Additional public databases for SNPs and copy-number variants (CNVs) have contributed to the frequency catalog for the known genetic variants in other diverse populations; one example is the Singapore Genome Variation Project (SGVP), which provides a HapMap-like resource for SNPs and CNVs for the three ethnic populations of Southern Han Chinese, South Asian Indians, and Southeast Asian Malays in Singapore.7,8
However, one potential limitation of these databases appears to be the inadvertent bias toward surveying common genetic variants appearing at appreciable frequency (minor allele frequency [MAF] > 5%), and this bias has left the remaining allelic spectrum unexplored. Very recent efforts have repeatedly underlined the need for deep resequencing of the specific population previously studied with GWAS arrays and subsequent imputation and reanalysis to allow insights into the contributed and impact of rarer, protein-changing alleles of higher penetrance.9–11
The advent of next-generation-sequencing technologies has propelled an unbiased discovery of genetic variants throughout the human genome. Early efforts to provide a comprehensive survey of genetic variants (comprising SNPs, indels, and structural variants) were either restricted to targeted sequencing of specific genomic regions across multiple samples12–14 or to whole-genome sequencing of only one individual at a time.15–20 The 1000 Genomes Project (1KGP) was among the first efforts to perform whole-genome sequencing of multiple samples in a specific population and had the eventual goal of sequencing more than 2,500 individuals from at least 27 human populations in order to catalog human genetic variants found at a frequency of 1% or more.21
The pilot phase of the 1KGP involved whole-genome sequencing at coverages between 2× and 6×. Although this has identified around 8 million SNPs not present in dbSNP131 from 179 samples, it is likely to have missed the detection of variants that are private or recurrent but rare. In this light, several reports have highlighted the necessity to sequence at higher genome coverage in order to confidently distinguish low-frequency and rare mutations from sequencing errors in assembly and base calling,15,18,20 especially in the detection and annotation of segmental duplications.22 This improvement in the form of increased coverage has successfully identified rare, highly penetrant, and pathogenic genetic variants that have escaped detection by standard GWAS approaches.9,10
The Singapore Sequencing Malay Project (SSMP) aims to perform deep, population-level whole-genome sequencing of 100 healthy Singapore Malays. Malays are an ethnic group of Austronesian-speaking people predominantly inhabiting the modern countries of Singapore, Malaysia, and Indonesia in the Southeast Asian region. Presently, Malays account for 13.4% of the local population in Singapore and are broadly defined as comprising descendants of indigenous Malays residing in Singapore prior to the British colonization, as well as migrants of other Southeast Asian Malay ethnic groups, including the Achehnese, Ambonese, Batak, Bugis, Banarese, Boyanese, Dusun, Dayak, Iban, Javanese, Kelabit, Kadazan, Minangkabau, Murut, Makasarese, Melanau, Sumatran, and Sudanese from Malaysia and Indonesia. A detailed population-genetics survey of Asian diversity revealed detectable population substructures between these different Malay ethnic groups,23–25 although, as a whole, the Malays were found to exhibit a considerable degree of genetic similarity to the Chinese.7
Here, we describe the genomic resource contributed by the SSMP; after quality control (QC), 96 Malay samples from Singapore were sequenced with a minimum of 30× depth coverage. In total, around 14 million SNPs, 1.6 million indels of sizes between 1 and 50 bp, and around 34,000 deletions spanning more than 50 bp were detected. The high sequencing depth also presented an opportunity for quantifying the extent of genomic variants that would be missed by low-pass sequencing and for evaluating the frequency spectrum of these missed variants. Genomic hotspots enriched with mutations, particularly those resulting in functional modifications, were also identified. Loss-of-function (LOF) variants present in the Malay samples were also compared to those reported in the 1KGP pilot. Data in the form of the variant call format (VCF), as well as the phased haplotypes, are publicly available at the SSMP website (see Web Resources).
Material and Methods
Samples
Subjects enrolled in the SSMP were pseudorandomly selected from the multiethnic cohort of the Singapore Population Health Study and consisted of 50 male and 50 female self-reported Malays. Ethnic membership for each subject was further ascertained by telephone recall for verification that both sets of grandparents are self-reported to be Malays. All subjects provided informed consent to participate in the study. Ethical approval for the original Singapore Population Health Study and further ethical approval for the extension to whole-genome sequencing were granted by two independent institutional review boards at the National University Hospital (Singapore) and the National University of Singapore.
Sample Preparation and Generation of Sequence Data
Genomic DNA for all 100 individuals was extracted from the Singapore BioBank and was sent to the Defense Medical and Environmental Research Institute for preparation. DNA quantification was performed with Picogreen, and fluorescence intensity was measured by the SpectraMax Gemini EM microplate reader with spectrophotometric settings at 480/520 nm (Ex/Em) for confirming that DNA concentration was greater than 50 ng/μl. DNA samples were subsequently delivered to the Illumina facility at Hayward, CA, USA for whole-genome sequencing with the Illumina HiSeq 2000; the target coverage was 30× for 100 bp paired-end reads, and the target insert size was 300–400 bp. Prior to library preparation, each sample was genotyped on the Illumina HumanOmni1-Quad as an initial DNA QC and for in-house assessment of gender and familial relations. During library preparation, DNA quality and size distribution were confirmed with the Bioanalyzer. After library preparation, the samples were run through a short paired-end sequencing reaction for ensuring that the GC bias and sequencing quality were within the normal ranges. Sequencing was subsequently performed on the Illumina HiSeq 2000, and each sample was run on a unique lane. Each lane was quality controlled during and after the run for ensuring that 80% of the bases achieved at least a base quality score of 30; otherwise, the lane was put through for another sequence run.
Read Assembly and Alignment
The Illumina proprietary sequence-data analysis module CASAVA (Consensus Assessment of Sequence and Variation) v.1.8 was used for read assembly and alignment. In brief, CASAVA performs sequence read alignment with the Efficient Large-Scale Alignment of Nucleotide Databases (ELAND) v.2e software, which processes the short reads by constructing a hash table of the short reads and scans the genome to identify matches before mapping to the respective section in the reference genome with the highest posterior probability. ELAND v.2e performs gapped alignment that extends each candidate alignment to the full read length and also employs multiseed alignment of consecutive sets of 16–32 bases separately to minimize artifactual mismatches. We used NCBI build 37 of the reference genome, although we masked out the pseudoautosomal region on chromosome Y to avoid duplicate alignments on chromosome X. We aligned female samples to the same reference without chromosome Y to avoid ambiguous alignments of highly similar regions present on both chromosomes X and Y. All generated reads were subsequently consolidated into a single BAM file per sample as per standard specification.26
SNP and Indel Discovery
For variants such as SNPs and short indels, two methods were used for discovery: (1) a single-sample variant caller in CASAVA and (2) the multisample variant-caller mpileup module in SAMtools v.0.1.17. To reduce the likelihood of false discoveries due to the choice of the variant caller, we only utilized the consensus set of variants identified by both CASAVA and SAMtools (see Supplemental Methods at the SSMP website in the Web Resources). Functional annotation of the variants was carried out with ANNOVAR (November 2011 release)27 with the ENSEMBL reference database. For exonic SNPs, both SIFT28 and PolyPhen-229 were used for predicting the possible impact of the amino acid substitution. To avoid conflicting inference, we only defined a nonsynonymous SNP (nsSNP) as damaging if both SIFT yielded a score ≤ 0.05 and PolyPhen-2 yielded a score ≥ 2.
Deletion Discovery
Two paired-end approaches, BreakDancer v.1.130 and VariationHunter v.0.3,31 were used for detecting large deletions in excess of 50 bp. To avoid false discoveries, we only used reads with a mapping quality score > 35 as inputs to both methods. BreakDancer identifies a region to carry deletions if all four of the following conditions are satisfied: (1) the region achieves a BreakDancer confidence score ≥ 25, (2) there are at least three distinct reads supporting the presence of the deletion, (3) both paired-end reads are mapped to the same chromosome, and (4) the deleted region is not found in the centromere. Within each individual, overlapping deletions are subsequently merged into a single deletion. For the output from VariationHunter, only deletions supported by at least three distinct reads and not present in the centromere are retained. We report only the set of deletions that were detected by both BreakDancer and VariationHunter and are between 50 and 10 Mb in length. A deletion is defined as previously identified if at least 50% of the deletion overlaps with previously reported deletions in the Database of Genomic Variants (DGV, November 2010 release) or the 1KGP.
LOF Variants
In silico annotation of LOF variants was performed with reference to the ENSEMBL gene annotation release 66.32 This focused on exonic variants classified as stop-gain or stop-loss mutations because such variants have the potential to result in the gain or loss of stop codons.33 Indels annotated as frameshift, stop-loss, and stop-gain mutations were also classified as LOF variants. In addition, we required the SNP or indel to be located in a protein-coding gene with corresponding protein-coding transcription.
Assessing Population Structure
To verify the ethnic membership of the 100 SSMP samples, we performed a principal-component analysis (PCA) between the 100 SSMP samples and the 268 samples from the SGVP7 with the pca option in the EIGENSTRAT software.34 The PCA was performed on a set of 111,776 SNPs, which we obtained by using every fifth SNP from the set of 558,882 SNPs present in both the SGVP samples and the Illumina Omni1-Quad array.
Identifying Mutation Hotspots
In order to evaluate whether there are human genomic regions that carry an uncharacteristically high density of SNPs, we divided each autosomal chromosome into 1 Mb nonoverlapping bins and counted the number of SNPs in each of the three following categories in each bin: (1) all SNPs, (2) nsSNPs, and (3) damaging nsSNPs. We used the human-leukocyte-antigen (HLA) region in the major histocompatibility complex (MHC) on chromosome 6 as a benchmark to identify mutation hotspots, defined as regions that carry at least 50% of the density (of all SNPs) observed at the densest window in the HLA. We did not identify hotspots of nsSNPs but instead identified any regions containing a greater density of damaging nsSNPs than the densest signal at the HLA region. To avoid genomic regions carrying a higher density of repeats, we excluded findings found within 1 Mb of the start and end of the telomeres and centromeres.
Assessing Impact of Sequencing Coverage
For the 96 samples, we thinned the sequence reads on chromosome 20 from 30× to 5× coverage in decreasing step sizes of 5× by using the DownsampleSam module in Picard v.1.5.5. Multisample variant calling was performed at each step size with SAMtools mpileup, which allowed an assessment of the extent of identified variants across the allele-frequency spectrum as sequencing depth changed. In addition, we thinned the sequence reads across the whole genome from 30× to 5× to assess the extent of the variants that would be missed when sequencing at a depth similar to that of the 1KGP.
Assessing Genomic Coverage of Genotyping Microarrays
We quantified and calculated the pairwise LD between two SNP markers by using the r2 metric and PLINK v.1.07, respectively. We only considered SNPs located within a physical distance of 250 kb of each other. To calculate the genomic coverage of the study population panel on each DNA SNP array, we first considered a reference set of SNP variants R that were unambiguously determined and were assumed to be the complete set of SNPs in the population. Let D denote the set of SNPs located on a given SNP genotyping array. Note that D is not a complete subset of R because the selected SNPs to be placed on the array might not necessarily be polymorphic in the target population and, as such, might not be found in R. For the given set of selected tag SNPs D, some SNPs in R are either (1) contained in both D and R (we denote this as set T) or (2) in LD with at least one SNP in D according to a predefined LD threshold (we denote this as set L). We thus proceeded to estimate the genomic coverage of a specific DNA genotyping array on a specified population panel as (T + L) / R, where L changes depending on the specific r2 threshold applied and both T and R remain constant for each population group and array evaluated. The calculation of coverage for the exome genotyping arrays is similar to that of the genome-wide calculation described earlier with the exception that, here, we restricted the complete set of SNPs to be constrained to those located in the exon regions rather than genome-wide. For SNP annotation, we used the software ANNOVAR27 with annotations from the ENSEMBL gene database, in which R SNPs annotated to be either within an exon or exon splicing constitute the reference set of complete polymorphisms in the exomes. These exonic SNPs can be further divided into various classes according to their functions: nonsynonymous, synonymous, splicing, frameshift, stop-gain, and stop-loss mutations.
Comparison of Reference Panels in Genotype Imputation
We evaluated the performance of genotype imputation with 2,542 Singapore Malays who were genotyped on the Illumina HumanHap610Quad array as part of a genome-wide association study on eye-related disorders and traits.35–38 We considered two imputation reference panels, (1) phased haplotypes from the 96 Malays in SSMP (see Supplemental Methods at the SSMP website for details of the haplotype phasing) and (2) phased haplotypes from 1,092 samples from 14 populations in phase 1 of the 1KGP (this later panel constitutes a “cosmopolitan” panel for genotype imputation). We adopted a two-step imputation strategy in which we prephased the 2,542 target samples at the chromosomal level by using MaCH v.1.07 before genotype imputation with Minimac. We removed SNPs with imputation quality scores < 0.8 from further analyses of imputation accuracy, leaving us with 517,234 SNPs that were on the microarray and that thus possessed assayed genotype calls for the 2,542 samples. At each SNP, we calculated the square of the Pearson’s correlation coefficient (r2) between the assayed genotype calls and the allele dosages from the imputation for all the samples with valid genotype calls. We binned each SNP into 1 of 11 MAF bins and computed the proportion of SNPs in each bin with r2 < 0.9.
A full description of our methods, along with additional figures and tables, can be found in the Supplemental Methods at the SSMP website.
Results
Sequence-Data Assembly, Alignment, and QC
A total of 100 subjects, comprising 50 males and 50 females from the Singapore Population Health Study, were whole-genome sequenced with the Illumina HiSeq 2000 with a target coverage of 30×, 100 bp paired-end reads, and a target insert size of 300–400 bp. Sequence-read assembly was performed with the Illumina proprietary CASAVA v.1.8 assembler, which yielded around 145 billion paired-end reads. These reads were mapped to the NCBI build 37 reference genome with the CASAVA GERALD module, which performs ELAND v.2e mapping, and 88.5% of the reads (1) passed Illumina QC filters, (2) were mapped with the proper read-pair orientation, (3) had insert sizes within the targeted size range, and (4) were not flagged as an optical duplicate. Each sample was additionally genotyped on the Illumina Omni1Quad array, and these genotypes were used for preliminary sample QC, as well as for assessing the accuracy of the genotype calling from the sequence data. We performed a PCA of the 100 SSMP samples together with the SGVP samples, and this identified one SSMP sample (SSM048) that was distinctively of Asian Indian origin (Figure 1); this sample was subsequently excluded from downstream analysis. To minimize false discoveries of structural variants, we also identified and excluded samples with anomalous distribution of insert sizes (SSM051, SSM054, and SSM060 [see Figure S1, available online]). This yielded a final set of 96 samples with around 14.4 terabases (Tb) of unfiltered DNA bases for further analyses. Details of the QC process can be found in the Material and Methods and Supplemental Methods online at the SSMP website.
Figure 1.
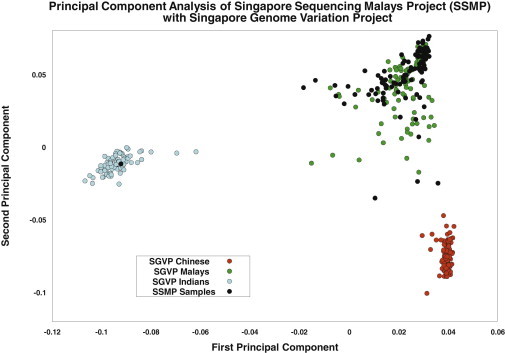
PCA of Samples from the SSMP and SGVP
PCA of the 100 samples from the SSMP (black circles) and the 268 samples from the SGVP, which includes 96 Chinese (red), 89 Malays (green), and 83 Indians (blue). A set of 111,776 SNPs present on the Illumina Omni1-Quad array, as well as in the SGVP, was used for this analysis.
For the 96 samples, an average of 97.11% (SD = 0.98%) of the reads were mapped to the reference genome; in comparison, the low-coverage pilot of the 1KGP only reported 58.3% for Europeans (CEU [Utah residents with ancestry from northern and western Europe from the CEPH collection]) and 78.5% for East Asians (CHB [Han Chinese in Beijing, China] + JPT [Japanese in Tokyo, Japan]) (see Figure 2, Table 1 and Table S1). Although we targeted a sequencing depth of 30×, the 96 samples actually yielded a mean coverage of 47.6× across all 96 samples and accessed an average of 91.66% of the human genome. The depth of coverage for each sample ranged from a minimum of 35.5× to a maximum of 81.9×.
Figure 2.
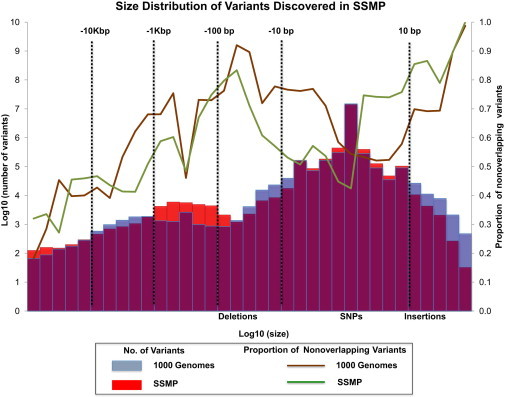
Size Distribution Variants Discovered in the SSMP Compared to the 1KGP
Variants detected in the SSMP include SNPs, small indels between the sizes of −50 and 50 bp, and large deletions between the sizes of 50 bp and 1 Mb. Variants identified by the 1KGP were compared with those in NCBI build 36 and dbSNP129, and variants identified by the SSMP were compared with those in dbSNP132 and the July 2010 release of the 1KGP.
Table 1.
Summary of Sequence Reads and Variants Discovered in SSMP
| Summary Statistic | SSMP | CHB + JPT | CEU | YRI |
|---|---|---|---|---|
| Number of Samples | 96 | 60 | 60 | 59 |
| Total raw bases (Gb) | 14,421 | 596 | 1,402 | 874 |
| Total mapped bases (Gb) | 13,991 | 468 | 817 | 596 |
| Mean mapped depth | 47.58 | 2.65 | 4.62 | 3.42 |
| Number of SNPs (% nonoverlapping) | 14,033,150 (42.4%) | 6,273,441 (28%) | 7,943,827 (33%) | 10,938,130 (47%) |
| Mean variant SNP sites per individual | 3,596,151 | 2,810,573 | 2,918,623 | 3,335,795 |
| Number of indels (% nonoverlapping) | 1,599,717 (60.3%) | 666,639 (39%) | 728,075 (39%) | 941,567 (52%) |
| Number of SV deletions (% nonoverlapping) | 34,113 (60%) | 15,893 (60%) |
The values reported in the table for populations CHB + JPT, CEU, and YRI are taken from the 1KGP and are based on NCBI build 36 and dbSNP129, whereas the values reported for SSMP are based on NCBI build 37 and dbSNP132. Nonoverlapping variants are those found only in the SSMP. The following abbreviations are used: SSMP, Singapore Sequencing Malay Project; CHB, Han Chinese in Beijing, China; JPT, Japanese in Tokyo, Japan; CEU, Utah residents with ancestry from northern and western Europe from the CEPH collection; YRI, Yoruba in Ibadan, Nigeria; and SV, structural variation.
SNP Discovery and Annotation
We used CASAVA and SAMtools/BCFtools to call variants from the reads of each individual sample and to call variants from the pooled reads from multiple samples, respectively. Overall, we identified more SNPs with the single-sample calling strategy than with the multisample approach (Table S2), although we report only variants that were discovered by both approaches. To decide which set of genotype calls we would use to construct the SSMP resource, we assessed the degree of concordance between the sequence calls by both CASAVA and SAMtools mpileup and the set of genotypes from the Omni1Quad genotyping by identifying a consensus set of SNPs on the basis of genomic coordinates. Although both approaches yielded remarkably high degrees of concordance in excess of 99.2%, calls made by CASAVA with the use of the sequence data were found to exhibit a higher degree of concordance with the genotyping calls (Figure S2). The public resource and downstream analyses were thus based on the genotype calls made by CASAVA.
Of the 96 Malay samples, we discovered a total of 13,989,823 biallelic SNPs with a genome-wide transition-to-transversion (Ti:Tv) ratio of 2.17 (Table 2). The Ti:Tv ratio did not differ significantly between those SNPs present in and those SNPs absent from dbSNP (2.18 versus 2.15, respectively), although the ratio was much higher (at 3.02) for SNPs in the exome than for the genome-wide average. When assessed against dbSNP132, which includes the variants reported in the pilot phase of the 1KGP, 42% of the biallelic SNPs were absent (Table S3). We also observed 43,327 triallelic and quadallelic SNPs, of which 26.4% were absent from dbSNP (Table S4). For the biallelic SNPs, the largest proportion of the known SNPs (67.8%) had a MAF > 5% (defined subsequently as common), whereas 15.6% had a MAF between 1% and 5% (low frequency) and the remaining 16.6% had a MAF < 1% (rare). Unsurprisingly, the majority of the SNPs absent from dbSNP were rare (77.9%), and only a small fraction of them (5.8%) were common. Within each sample, the number of SNPs detected ranged from 3,519,881 to 3,672,553 SNPs per sample (mean = 3,596,151; SD = 26,785 [Figure 3]). The ratio of heterozygous to homozygous SNPs per sample had an average of 1.36 (SD = 0.057) when calculated across all 96 samples. This ratio was 3.4× higher in the set of SNPs absent from dbSNP than in the set of previously identified SNPs, consistent with previous reports suggesting that SNPs absent from publically available databases are more likely to be rare and present in heterozygotes.20,28
Table 2.
Ti:Tv Ratio for SNPs Discovered in SSMP
|
Ti:Tv Ratio |
||
|---|---|---|
| Whole Genome | Exome | |
| Previously identified SNPs | 2.178 | 3.125 |
| Nonoverlapping SNPs | 2.153 | 2.917 |
| All | 2.167 | 3.020 |
Nonoverlapping SNPs are those found only in the SSMP.
Figure 3.
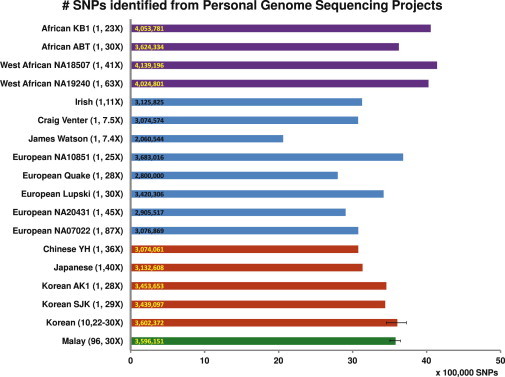
Number of Variants in Individual Whole-Genome Sequencing
Illustration of the number of variants detected in the individual whole-genome-sequencing projects that have been performed, along with the number of samples and the corresponding sequence depth. The number shown at the start of each horizontal bar indicates the exact number of variants discovered in the individual sequencing or the average number of variants discovered in multisample sequencing (for the Koreans and the Malays). The error bars for the multisample sequencing of the Koreans and Malays show the minimum and the maximum number of variants detected across the samples.
ANNOVAR27 was used for classifying SNPs into eight categories according to functional annotation. Most of the SNPs were intergenic (48.12%) or intronic (36.51%), and the remaining 15%, including 119,283 exonic SNPs (of which 58,610 were absent from dbSNP), fell into the other six categories (Figure S3). Of the exonic SNPs, nsSNPs accounted for the largest proportion (57.7%), whereas 39.8% were synonymous (Table S5). Across 96 samples, we discovered 37,379 nsSNPs, 971 stop-gain SNPs, and 180 stop-loss SNPs that were absent from dbSNP. Overall, nsSNPs and synonymous SNPs made up 0.50% and 0.35% of the detected SNPs, respectively; these percentages are similar to the numbers reported by the 1KGP (0.41% and 0.37%, respectively). For the nsSNPs, we found that 15,439 were consistently predicted to be damaging by both SIFT and PolyPhen.
Mutation Hotspots
Deep whole-genome sequencing offers an unprecedented opportunity for investigating whether there are human genomic regions with an enrichment of mutations, particularly those that result in amino acid changes and that are predicted to be deleterious. We considered nonoverlapping windows of 1 Mb across the genome and counted the number of SNPs in each window. We additionally counted the number of nsSNPs, as well as SNPs predicted by both SIFT and PolyPhen to be damaging. Densities of these different categories of SNPs were observed to vary significantly throughout the genome (Figure 4). For example, the HLA region on chromosome 6 exhibited the highest SNP density in the genome (Figure 4A), as well as considerably higher densities of nsSNPs (Figure 4B) and damaging SNPs (Figure 4C) than the genome-wide averages.
Figure 4.
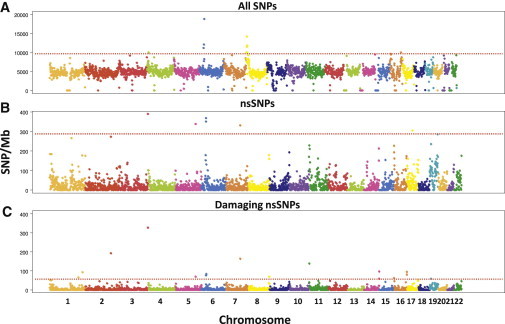
Density of SNPs in the SSMP
Density of SNPs discovered in the SSMP. Each chromosome is divided into nonoverlapping windows of 1 Mb and the number of SNPs in each of the three categories: all SNPs (A), nsSNPs (B), and damaging nsSNPs (C). Horizontal dashed lines correspond to the thresholds used for defining the regions of interest where the SNP densities are at least 50% of those observed at the HLA region on chromosome 6.
Using the HLA region as a benchmark, we identified four other genomic regions that possess at least 50% of the SNP density observed at the densest window in the HLA region (Table 3). This included a 1 Mb chromosome 4 window encompassing beta-defensin 131 (DEFB131), dopamine receptor D5 (DRD5), and a member of the solute carrier family (SLC2A9); a 4 Mb chromosome 8 window spanning several genes, including six members of the defensin gene family (DEFB1, DEFA1, DEFA3, DEFA4, DEFA5, and DEFA6); a 2 Mb chromosome 16 window spanning ataxin-2-binding protein 1 isoform 4 (A2BP1); and a 1 Mb window between 78 and 79 Mb on chromosome 16 (Figure S4). Compared with the densest signal at the HLA region, the following five regions emerged with higher densities of damaging nsSNPs (Table 4): (1) chr1: 228–229 Mb (including a gene implicated in basal cell carcinoma and endometriosis [RHOU]); (2) chr2: 179–180 Mb (including the titin isoform gene [TTN] implicated in QT-interval variation); (3) chr3: 195–196 Mb (spanning a pancreatic cancer gene [TFRC]); (4) chr7: 100–101 Mb (spanning a transferrin-receptor gene [TFR2] and a gene implicated in type 2 diabetes [ACHE]); and (5) chr16: 88–89 Mb (carrying genes reported to be associated with central corneal thickness [BANP and ZNF469]).
Table 3.
Summary Information of Genomic Regions Possessing at Least 50% of the SNP Density Observed at the HLA Region on Chromosome 6
| Chromosome | Start (Mb) | End (Mb) | Density (Number of SNPs per Mb) | Genes |
|---|---|---|---|---|
| 4 | 9 | 10 | 9,961 | DEFB131, DRD5, SLC2A9, and USP17 |
| 6 | 29 | 30 | 11,162 | GABBR1, HCG4P7, HCG4P8, HLA-F, MAS1L, MOG, OR10C1, OR11A1, OR12D2, OR12D3, OR14J1, OR2B3, OR2H1, OR2H2, OR2J2, OR2J3, OR2W1, OR5V1, UBD, and ZFP57 |
| 6 | 31 | 33 | 11,162 12,094 |
ABHD16A, AGER, AGPAT1, AIF1, APOM, ATF6B, ATP6V1G2, ATP6V1G2-DDX39B, BAG6, BRD2, C6orf15, C6orf25, C6orf47, C6orf48, CCHCR1, CDSN, CFB, CLIC1, CSNK2B, CYP21A2, DDAH2, DDX39B, DOM3Z, EGFL8, EHMT2, FKBPL, GPANK1, HLA-B, HLA-C, HLA-DMA, HLA-DMB, HLA-DOA, HLA-DOB, HLA-DQA1, HLA-DQA2, HLA-DQB1, HLA-DQB2, HLA-DRA, HLA-DRB1, HLA-DRB5, HSPA1A, HSPA1B, HSPA1L, LSM2, LST1, LTA, LTB, LY6G5B, LY6G5C, LY6G6D, MCCD1, MICA, MICB, MSH5, MUC22, NCR3, NEU1, NFKBIL1, PBX2, POU5F1, PPT2, PRRC2A, PRRT1, PSG1, PSMB8, PSMB9, PSORS1C1, PSORS1C2, RDBP, RNF5, SAPCD1, SKIV2L, SLC44A4, STK19, TAP1, TAP2, TCF19, TNF, TNXB, VARS, and ZBTB12 |
| 8 | 3 | 7 | 14,176 11,418 11,801 10,027 |
AGPAT5, ANGPT2, CSMD1, DEFA1, DEFA1B, DEFA3, DEFA4, DEFA5, DEFA6, DEFB1, MCPH1, and XKR5 |
| 16 | 6 | 8 | 9,666 9,479 |
RBFOX1 |
| 16 | 78 | 79 | 10,027 | CLEC3A, WWOX, and VAT1L |
Table 4.
Summary Information of Genomic Regions Possessing Higher Densities of Damaging Nonsynonymous SNPs than the HLA Region on Chromosome 6
| Chromosome | Start (Mb) | End (Mb) | Density (Number of SNPs per Mb) | Genes |
|---|---|---|---|---|
| 1 | 228 | 229 | 93 | ARF1, BUTR1, C1orf35, GJC2, GUK1, HIST3H2A, HIST3H2BA, HIST3H2BB, HIST3H3, IBA57, MRPL55, OBSCN, PRSS38, RHOU, RNF187, TRIM11, TRIM17, WNT3A, and WNT9A |
| 2 | 179 | 180 | 193 | CCDC141, DFNB59, FKBP7, OSBPL6, PLEKHA3, PRKRA, SESTD1, and TTN |
| 3 | 195 | 196 | 327 | ACAP2, APOD, MUC20, MUC4, PCYT1A, PPP1R2, TFRC, TNK2, and ZDHHC19 |
| 6 | 31 | 33 | 77; 84 | Same gene list as in Table 2 |
| 7 | 100 | 101 | 163 | ACHE, ACTL6B, AGFG2, AP1S1, C7orf47, C7orf51, C7orf52, C7orf61, CLDN15, DGAT2L7, EPHB4, EPO, FBXO24, FIS1, GIGYF1, GNB2, LRCH4, MEPCE, MOGAT3, MOSPD3, MUC12, MUC17, MUC3A, PCOLCE, PLOD3, POP7, RABL5, SAP25, SERPINE1, SLC12A9, SRRT, TFR2, TRIM56, TRIP6, TSC22D4, UFSP1, VGF, ZAN, ZCWPW1, and ZNHIT1 |
| 16 | 88 | 89 | 95 | APRT, BANP, CBFA2T3, CDT1, CTU2, CYBA, GALNS, IL17C, MVD, PABPN1L, PIEZO1, RNF166, SNAI3, TRAPPC2L, ZC3H18, ZFPM1, and ZNF469 |
A relevant corollary to the above findings is whether these regions similarly exhibit a higher density of SNPs currently absent from dbSNP or whether these regions carry previously reported SNPs. For example, even though the SNP and damaging nsSNP densities were significantly higher at the HLA region, the corresponding density of SNPs absent from dbSNP was considerably lower and did not feature in the top signals across the genome (Figure S5). Of the four regions first identified without any category restriction on the SNPs, three regions (except chr16: 78–79 Mb) similarly carried significantly higher densities of SNPs absent from dbSNP. All five regions identified with a high density of damaging nsSNPs were present in the top signals with the highest density of damaging nsSNPs absent from dbSNP (Table S6).
Indels and Large Deletions
A total of 1,599,717 indels with sizes between −50 bp (deletions) and +50 bp (insertions) were discovered from the sequencing of the 96 Malay subjects; an average of 558,343 indels (SD = 16,564) were detected in each individual. We compared our discoveries against those of both dbSNP132 and the reported findings from the pilot phase of the 1KGP, given that dbSNP132 did not include the indels from the 1KGP. As expected, a significant proportion of the common indels had been previously identified, whereas a higher proportion of the rare and low-frequency indels were absent from dbSNP (Table 1, Figure 5). Annotating the indels with ANNOVAR, we observed that 47.0% of the indels were intergenic, 38.3% were intronic, and about 0.1% (2,298) were in the exonic regions classified as frameshift, nonframeshift, stop-loss, or stop-gain. Of the 2,298 exonic indels, nonframeshift indels constituted the largest proportion (58.3%) and were followed by frameshift (37.4%), stop-gain (1.3%), and stop-loss (0.3%) mutations.
Figure 5.
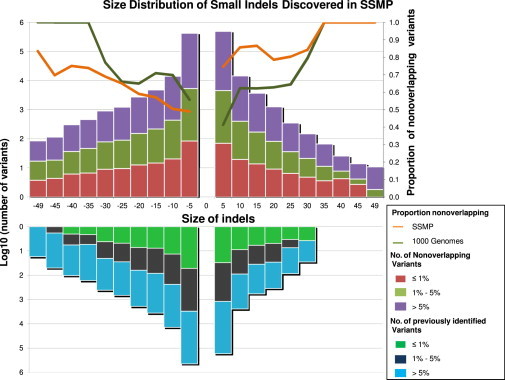
Size Distribution of Indels by Population Frequency
Indels discovered in the SSMP are distributed by size and categorized into three MAF bins: rare (≤1%), low frequency (1%–5%), and common (≥5%). Previously identified indels refer to those that are present in dbSNP132 or in the July 2010 release of the IKGP (lower panel), whereas nonoverlapping indels are defined as those present in only the SSMP and not in either dbSNP132 or the 1KGP (upper panel). The lines shown in the upper panel indicate the proportion of nonoverlapping indels identified by the SSMP (orange line) and the 1KGP (green).
Deletions between 50 and 10 Mb were identified with VariationHunter31 and BreakDancer,30 two paired-end-mapping approaches. Across all 96 samples, we found 34,113 deletions, of which 13,650 (40.0%) overlapped with deletions reported either in the DGV (November 2010 release) or in the 1KGP. Unsurprisingly, a significant proportion (53.0%) of the 20,463 nonoverlapping deletions were seen in at most 1% of the 96 samples, whereas 5,798 were found with a frequency between 1% and 5% and only 3,821 were common (frequency > 5%) (Table 1). With the use of similar QC criteria, our samples yielded 18,220 more deletions than the 1KGP despite the fact that the pilot phase of 1KGP assayed almost twice as many samples as we had. We believe this is attributed to the significantly deeper coverage that the SSMP possesses given that thinning the read depth from 30× to 5× for four randomly chosen SSMP samples yielded only about half of the deletions that would have been found with 30× coverage in these four samples (Figure S6). However, for those deletions that were consistently identified with both 5× and 30× coverage data, the sizes of the deletions were remarkably similar (Figure S7).
LOF Variants
From the set of SNPs and indels annotated to be stop-loss or stop-gain mutations or to result in frameshifts, we identified in 2,505 genes 2,782 variants that were likely to result in LOF. An average of 470 LOF variants were seen in each sample, consistent with previous whole-genome sequencing that reported between 200 and 800 LOF variants per healthy individual.28,39 Comparing against the samples in the low-pass pilot phase of the 1KGP, we observed almost twice as many LOF variants per individual (Table S7 and Figure S8). Comparing the LOF variants that emerged from the SSMP with the reported list of validated LOF variants, we observed that 95 of the LOF variants in our samples were also observed in the 1KGP and were functionally validated, suggesting that these mutations are genuine and not sequencing artifacts. (Table S8).
Variant Discovery versus Coverage
We expected the high-coverage sequencing to uncover more variants than low-pass sequencing. To investigate this formally, we varied the read depth from 5× to 30× in each of the 96 samples on chromosome 20 and reperformed the multisample variant calling with SAMtools to evaluate the number of SNPs and indels detected (Table S9). Although it is clear that a monotonically increasing relationship exists between sequencing depth and the number of variants detected (Figure S9), there appears to be, at best, a modest increase in variant discovery beyond 20× coverage. Examining SNP discovery by the allele-frequency spectrum, we observed that sequencing at a deep coverage primarily benefitted the discovery of variants at lower MAFs, particularly those at 1% or less (Figure S10). We additionally thinned the whole-genome sequence data for all 96 samples to 5× and reperformed the variant calling to investigate the consequence of sequencing at a coverage similar to that of the 1KGP pilot phase. Out of 14,033,150 SNPs that were observed in the sequencing at 30× coverage, we recovered only 11,336,667 (80.8%) SNPs. Of those that were not present in the low-pass sequencing, the majority were low-frequency and rare variants (97.5%) (see Figure 6).
Figure 6.
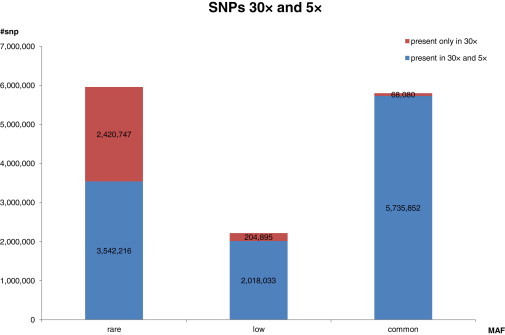
Number of SNPs Detectable by Sequencing at Different Depths
Pictorial representation of the number of SNPs detected by sequencing at 30× or 5× coverage. The blue bars represent the number of SNPs found by both 5× and 30× sequencing, and the red bars represent those that were only detected by sequencing at 30×.
Validation Sequencing
In order to assess the reliability of the discovered variants, we randomly selected 11 samples and resequenced chromosome 20 by using a NimbleGen sequence-capture approach (SeqCap EZ Choice XL library) to cover all 63,025,520 bases. Samples were sequenced on the Illumina HiSeq1000, and the reads were mapped to Hg19 with ELAND v.2e. SNPs and indels were subsequently called with a different caller with the Genome Analysis Toolkit (GATK, see Supplemental Methods at the SSMP website). An average per-sample coverage of 45.11× was attained (Table S10). Out of the 167,277 SNPs identified by both CASAVA and SAMtools in the main experiment for only the 11 samples on chromosome 20 (defined as the consensus set), 145,670 (87.08%) were consistently observed in the validation sequencing (Table S11 and Figure S11). Although 12,957 SNPs were found by the validation sequencing only, these tended to correspond to SNPs for which the GATK quality scores were significantly lower than those present in both the consensus set and the validation sequencing (Table S12). The concordance between the GATK genotype calls and the Omni1Quad calls was observed to be lower than those reported in the consensus set, particularly for the common SNPs for which the concordance was only 99.5% (compared to 99.9% from the CASAVA calls in the consensus set [Table S13]). For indels, 16,761 out of 22,876 (73.27%) in the consensus set were present in the validation sequencing. Similarly, we observed that the set of 5,365 indels that were solely discovered by the validation sequencing exhibited lower GATK quality scores than did those present in the consensus set (Table S12).
Coverage Assessment of Next-Generation Genotyping Arrays
The SSMP resource provides a unique opportunity for investigating the genomic coverage of next-generation genotyping microarrays designed with information from the IKGP pilot phase, such as the two exome arrays that focus on exonic content. Unsurprisingly, our findings indicate that genomic coverage of the populations in the 1KGP pilot phase tends to be higher for denser arrays that assay more SNPs (Figure 7), and the coverage of low-frequency SNPs was considerably lower than that of common SNPs, except in the cases of the Illumina Omni2.5 and Omni5.0 arrays.
Figure 7.
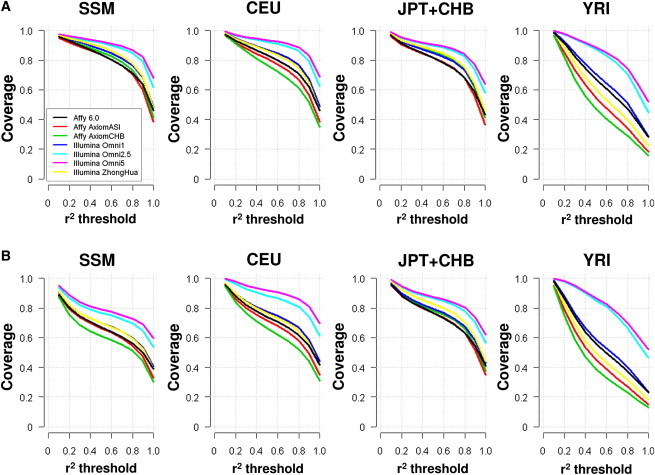
Genomic Coverage of Genotyping Arrays
Coverage of SNP variation for Southeast Asian Singapore Malays (SSM), Europeans (CEU), East Asians (CHB + JPT), and Africans (YRI) from the 1KGP on various commercially available genome-wide genotyping arrays.
(A) SNPs of common frequency (≥5% in each population) were assessed.
(B) SNPs of low and common frequency (≥1% in each population) were assessed.
For the common SNPs that we reported in SSMP, it was observed that arrays designed specifically with East Asian content (Affy Axiom ASI and Axiom CHB, Illumina ZhongHua), especially the Illumina ZhongHua, performed better against other standard-content arrays that assayed similar number of variants (Figure 7A). The coverage of all the arrays for low-frequency and common SNPs identified in the SSMP was considerably lower, even for the Omni2.5 and Omni5.0, which yielded at least 80% coverage with a tagging threshold of r2 ≥ 0.8 in 1KGP Europeans (CEU) and East Asians (CHB + JPT) (Figure 7B). Because coverage assessment included the low-frequency SNPs, which are not as easily tagged and are more likely to be population specific, the poorer coverage for the Malays and Africans was most likely the consequence of ascertainment biases that prioritized SNPs present in Europeans and East Asians. When comparing Omni2.5 with Omni5, we observed that Omni5 actually yielded a perceptible improvement over Omni2.5 in the coverage of low-frequency and common variants in Europeans (CEU). This is in line with the design of Omni5, which includes additional rare and low-frequency content identified in the CEU population in the pilot phase of the 1KGP.
Affymetrix and Illumina have introduced two exome arrays that were designed to consider the functional exonic SNP content from 16 major exome-sequencing projects, including the pilot phase of the 1KGP. The primary content of the Affy Axiom Exome carries 347,364 SNPs, whereas the Illumina HumanExome BeadChip contains 241,326 SNPs. Our coverage calculations suggested that the Affy exome array achieved almost 20% higher coverage than the Illumina exome array in all four populations, although, as expected, the coverage of the YRI (Yoruba in Ibadan, Nigeria) samples was the lowest among all four populations at around 40% for Illumina and 58% for Affymetrix at an r2 threshold of 0.8 (Figure 8). The rest of the non-African populations achieved around 45% and 62% coverage for Illumina and Affymetrix, respectively, and there were no significant differences between the SSMP and the other non-African populations. However, the coverage of exonic variants in the SSMP decreased dramatically when the evaluation of coverage was extended to include low-frequency variants to the extent that the SSMP actually exhibited a lower coverage than YRI. Although there was no discernible difference in coverage for the 1KGP populations upon the inclusion of the low-frequency variants, there was almost a 10% drop in the coverage of the SSMP variants; this most likely stems from the poor coverage of the low-frequency content.
Figure 8.
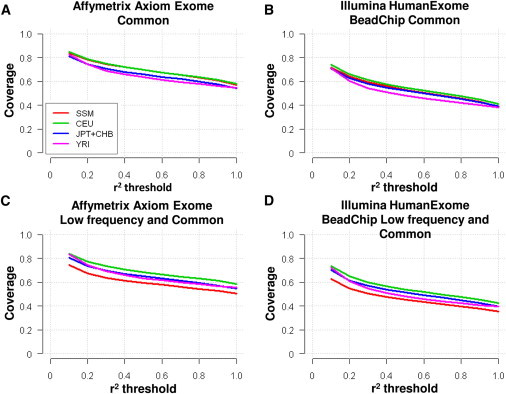
Genomic Coverage of Exome Arrays
The percentage of variation covered by the two currently commercially available exome-focused genotyping arrays for the different 1KGP population groups: Southeast Asia Singapore Malays (SSM), Europeans (CEU), East Asians (CHB + JPT), and Africans (YRI). Assessment of the coverage of common exonic variants by the Illumina HumanExome Beadchip (A) and the Affymetrix Axiom Exome Array (B) are shown. Additionally, low-frequency exonic SNPs are included in the coverage assessment of the Illumina HumanExome Beadchip (C) and Affymetrix Axiom Exome Array (D).
Comparison of Reference Panels in Genotype Imputation
The sequencing of 96 Southeast Asian Malays allows the evaluation of imputation strategies that have been proposed for fine-mapping functional polymorphisms with sequence-level data. For example, how should one perform genotype imputation for a population (such as the Malays) that has not been included in the 1KGP? There are two possible strategies here: (1) to use a “cosmopolitan reference panel,” defined as a haplotype panel constructed by the aggregation of samples from different populations that are available in databases such as the 1KGP or (2) to use a population-specific panel obtained by either targeted or whole-genome sequencing of a smaller number of samples from the same population as the intended samples for imputation.
In order to address this, we considered 2,542 Singapore Malays who were genotyped on the Illumina HumanHap610Quad as part of a study of eye traits and diseases. These samples were imputed twice because we used two different reference panels constructed from (1) the 96 Malay samples in the SSMP and (2) the 1,092 samples across 14 populations in phase 1 of the 1KGP (cosmopolitan panel). We subsequently calculated the correlation r2 between the allele dosages from the imputation with the actual genotype calls for 517,234 SNPs found on the microarray and considered the fraction of SNPs with r2 < 0.9 in each of 11 MAF bins (Figure 9). We observed that for rare and low-frequency SNPs (MAF < 5%), the use of the much larger cosmopolitan panel yielded more accurate imputation than did the use of the population-specific panel, which is not surprising because a substantial number (e.g., n > 400) of individuals need to be whole-genome sequenced for rarer SNPs to surface in the first place.9,10 For common SNPs (MAF > 5%), the Malay resequencing panel achieved more accurate imputation than did the cosmopolitan panel.
Figure 9.
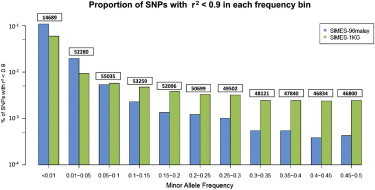
Comparison of Reference Panels in Genotype Imputation
Evaluation of the performance of genotype imputation of 2,542 Singapore Malays who were genotyped on the Illumina610 array against the two reference panels constructed from (1) 96 Malays from the SSMP and (2) 1,092 samples from 14 populations in phase 1 of the 1KGP. The correlation r2 between the allele dosages and the actual genotype calls was calculated for each SNP on the microarray. The vertical bars represent the percentage of SNPs in each MAF bin where r2 is less than 0.9. The figure at the top of each frequency bin represents the number of SNPs with a MAF (calculated from 2,542 Malay samples) that falls within the frequency spectrum of the bin. The vertical axis is represented in logarithmic scale for ease of interpretation.
Discussion
The Singapore Sequencing Malay Project aims to provide an unbiased characterization of the genomic architecture of the Malays in Southeast Asia through whole-genome sequencing of 100 individuals. We opted to sequence at a target coverage of 30× rather than to adopt the 1KGP strategy of performing low-pass sequencing because we believe that deep coverage is vital for uncovering variants that are present at lower frequencies in the population. Given that the Malays belong to the Austronesian group, which is underrepresented in population-genetics studies, we believe that the SSMP will yield valuable insights into how this population differs from other major groups in the world. The SSMP data are publicly available for researchers in the VCF that is identical to that of the 1KGP.
Our findings reiterate that low-pass sequencing tends to miss low-frequency and rare variants, consistent with several reports on targeted gene sequencing that investigated the impact of sequence depth on variant discovery.15,41 Because the majority of genuine LOF variants tend to be of low frequency in the population,28,40 sequencing deeply across multiple samples is likely to be necessary for discovering more of these variants. Although the low-passing sequencing in the 1KGP pilot phase has delivered an unsurpassed resource that documents the genomic diversity of several populations, the high-coverage in the SSMP meant that we could interrogate the genome in an unbiased fashion for regions that possess a higher SNP density, especially those regions harboring nsSNPs that are predicted to be potentially damaging. Although it is premature to give any biological significance to these regions, the fact that these genomic regions carry an uncharacteristically high density of damaging nsSNPs warrants careful investigation, especially because most of these nsSNPs are absent from dbSNP.
One interesting question that arose during the design of the SSMP was whether it would be better to sequence at a lower depth but to include more samples rather than to sequence deeply but to compromise on the sample size. To investigate this, we randomly chose 20 samples that were sequenced at 30× and compared the number of variants observed to the number present from 96 samples after we thinned the sequence coverage to 5×. Although the two scenarios required approximately the same amount of sequencing, the first scenario yielded 9,051,538 variants, whereas the second scenario yielded 11,442,159 variants. This suggests that low-pass sequencing of more samples uncovers more variants than does deep sequencing with a smaller sample size, although most of the additional variants found were rare or of low frequency (Table S9). The number of common variants detected by both scenarios was similar (5.80 million SNPs for 96 samples compared to 5.75 million SNPs for 20 samples).
Although this seems to suggest that low-pass sequencing of more samples is a better strategy, we emphasize, however, that this depends on which of the following two scenarios one aims to accomplish: (1) to discover as many variants as possible given a fixed amount of sequencing or (2) to detect as many variants genuinely present within the sequenced individuals as possible. In the former scenario, sequencing as many samples as possible clearly yields more variants as the number of private mutations increases with the number of individuals sequenced, but our study (see Figure 6) has revealed that this comes at the expense of imperfect coverage for each individual sample. In the latter scenario, deeper sequencing yields a better ability to characterize the variants that are present within each sample, although this misses rare or low-frequency variants that are simply not carried by the sequenced individuals. In our assessment of variant discovery versus sequencing coverage, we have already established that the majority of variants that are missed from low-pass sequencing are rare and of low frequency. Clearly, there are merits in both approaches, and what is appropriate depends on the underlying research hypothesis. In the SSMP, we sought a compromise in which our deep-sequencing coverage would allow us to provide an unbiased characterization of variants in the Malay population with a MAF of at least 0.5%, although this does assume that such variants are polymorphic in the 96 Malay individuals.
Our results indicate that the use of a population-specific reference panel during genotype imputation can lead to more accurate inference of genotypes at unobserved common SNPs than the use of a cosmopolitan reference panel for a population such as the Malays, who are not part of the International HapMap Project or the 1KGP. When assessed for SNPs for which the derived allele frequencies are less than 5%, our current sample size of 96 whole-genome sequenced Malay individuals was outperformed by the 1KGP, which had 1,092 samples and delivered more accurate genotype imputation. The most likely reason for this observation is that a reference panel containing more individuals has a higher chance of carrying low-frequency and rare variants. For example, for an allele that is found at 1% in a number of populations, a reference panel of 1,000 samples means that we expect 20 copies of the allele to be present, and this figure reduces to only two copies in a panel of 100 samples. This discovery is important when one attempts to localize the functional polymorphisms driving genotype-phenotype correlations observed in GWASs. A previous report by Jallow and colleagues noted a strong association between variants in the vicinity of the HBB locus on chromosome 11 and severe onset of malaria in a collection of Gambian samples.42 The authors successfully identified causal variant rs334 by imputing against a population-specific panel built from targeted resequencing of 60 Gambian samples across the HBB locus. This illustrates the potential of the SSMP resource in furthering biological discoveries: providing a high-fidelity population-specific reference panel for imputation-based fine mapping of functional variants. Such approaches are currently being built on and extended to large-scale GWASs involving individuals of Southeast Asian descent so that more of the allelic spectrum accounting for individual disease severity can be defined.43–46
To date, the SSMP has provided one of the deepest whole-genome-sequencing resources across multiple subjects in a single population. This is a timely complement to the 1KGP just as it releases whole-genome-sequencing data of more populations from different parts of the world. That this is performed in a population from Southeast Asia is significant given that the 1KGP currently includes only one population from this region (Vietnamese Kinh) and none from the Austronesian groups. We envisage that the SSMP database will be a useful benchmark for population-level deep whole-genome sequencing, and we expect that high coverage will enable methodological and technological assessments of current strategies in sequence-data analysis.
Acknowledgments
We thank all the subjects in this study for their participation. This project acknowledges the support of the Yong Loo Lin School of Medicine, the National University Health System, the Life Sciences Institute, and the Office of the Deputy President (Research and Technology) from the National University of Singapore. We also acknowledge the support from the National Research Foundation (NRF-RF-2010-05) and the Singapore Biomedical Research Council (05/1/21/19/425 and 11/1/21/18/678).
Supplemental Data
Web Resources
The URLs for data presented herein are as follows:
ANNOVAR November 2011 release, http://www.openbioinformatics.org/annovar/
BEAGLE Genetic Analysis Software, http://faculty.washington.edu/browning/beagle/beagle.html
BreakDancer, http://breakdancer.sourceforge.net/
ENSEMBL gene annotation release 66, ftp://ftp.ensembl.org/pub/release-66/gtf/homo_sapiens/Homo_sapiens.GRCh37.66.gtf.gz
GATK, http://www.broadinstitute.org/gsa/wiki/index.php/Home_Page
Gene Association Database, http://geneticassociationdb.nih.gov
NCBI Map Viewer, http://www.ncbi.nlm.nih.gov/mapview/
Online Mendelian Inheritance in Man (OMIM), http://www.omim.org
PennCNV, http://www.openbioinformatics.org/penncnv/penncnv_download.html#_Toc214817256
Picard, http://picard.sourceforge.net/
SAMtools, http://sourceforge.net/projects/samtools/files/samtools/0.1.17/
Singapore Sequencing Malay Project, http://www.statgen.nus.edu.sg/∼SSMP
Singapore Sequencing Malay Project Supplemental Methods, http://www.statgen.nus.edu.sg/∼SSMP/supp_methods.html
VariationHunter, http://compbio.cs.sfu.ca/software-variation-hunter
Accession Numbers
The Database of Genomic Variants accession number for the structural variants reported in this paper is estd201.
References
- 1.Frazer K.A., Ballinger D.G., Cox D.R., Hinds D.A., Stuve L.L., Gibbs R.A., Belmont J.W., Boudreau A., Hardenbol P., Leal S.M., International HapMap Consortium A second generation human haplotype map of over 3.1 million SNPs. Nature. 2007;449:851–861. doi: 10.1038/nature06258. [DOI] [PMC free article] [PubMed] [Google Scholar]
- 2.International HapMap Consortium The International HapMap Project. Nature. 2003;426:789–796. doi: 10.1038/nature02168. [DOI] [PubMed] [Google Scholar]
- 3.Altshuler D.M., Gibbs R.A., Peltonen L., Altshuler D.M., Gibbs R.A., Peltonen L., Dermitzakis E., Schaffner S.F., Yu F., Peltonen L., International HapMap 3 Consortium Integrating common and rare genetic variation in diverse human populations. Nature. 2010;467:52–58. doi: 10.1038/nature09298. [DOI] [PMC free article] [PubMed] [Google Scholar]
- 4.Hinds D.A., Stuve L.L., Nilsen G.B., Halperin E., Eskin E., Ballinger D.G., Frazer K.A., Cox D.R. Whole-genome patterns of common DNA variation in three human populations. Science. 2005;307:1072–1079. doi: 10.1126/science.1105436. [DOI] [PubMed] [Google Scholar]
- 5.Easton D.F., Pooley K.A., Dunning A.M., Pharoah P.D., Thompson D., Ballinger D.G., Struewing J.P., Morrison J., Field H., Luben R., SEARCH collaborators. kConFab. AOCS Management Group Genome-wide association study identifies novel breast cancer susceptibility loci. Nature. 2007;447:1087–1093. doi: 10.1038/nature05887. [DOI] [PMC free article] [PubMed] [Google Scholar]
- 6.Sladek R., Rocheleau G., Rung J., Dina C., Shen L., Serre D., Boutin P., Vincent D., Belisle A., Hadjadj S. A genome-wide association study identifies novel risk loci for type 2 diabetes. Nature. 2007;445:881–885. doi: 10.1038/nature05616. [DOI] [PubMed] [Google Scholar]
- 7.Teo Y.Y., Sim X., Ong R.T., Tan A.K., Chen J., Tantoso E., Small K.S., Ku C.S., Lee E.J., Seielstad M., Chia K.S. Singapore Genome Variation Project: a haplotype map of three Southeast Asian populations. Genome Res. 2009;19:2154–2162. doi: 10.1101/gr.095000.109. [DOI] [PMC free article] [PubMed] [Google Scholar]
- 8.Xu H., Poh W.T., Sim X., Ong R.T., Suo C., Tay W.T., Khor C.C., Seielstad M., Liu J., Aung T. SgD-CNV, a database for common and rare copy number variants in three Asian populations. Hum. Mutat. 2011;32:1341–1349. doi: 10.1002/humu.21601. [DOI] [PubMed] [Google Scholar]
- 9.Rafnar T., Gudbjartsson D.F., Sulem P., Jonasdottir A., Sigurdsson A., Jonasdottir A., Besenbacher S., Lundin P., Stacey S.N., Gudmundsson J. Mutations in BRIP1 confer high risk of ovarian cancer. Nat. Genet. 2011;43:1104–1107. doi: 10.1038/ng.955. [DOI] [PubMed] [Google Scholar]
- 10.Holm H., Gudbjartsson D.F., Sulem P., Masson G., Helgadottir H.T., Zanon C., Magnusson O.T., Helgason A., Saemundsdottir J., Gylfason A. A rare variant in MYH6 is associated with high risk of sick sinus syndrome. Nat. Genet. 2011;43:316–320. doi: 10.1038/ng.781. [DOI] [PMC free article] [PubMed] [Google Scholar]
- 11.Sulem P., Gudbjartsson D.F., Walters G.B., Helgadottir H.T., Helgason A., Gudjonsson S.A., Zanon C., Besenbacher S., Bjornsdottir G., Magnusson O.T. Identification of low-frequency variants associated with gout and serum uric acid levels. Nat. Genet. 2011;43:1127–1130. doi: 10.1038/ng.972. [DOI] [PubMed] [Google Scholar]
- 12.Bhangale T.R., Rieder M.J., Nickerson D.A. Estimating coverage and power for genetic association studies using near-complete variation data. Nat. Genet. 2008;40:841–843. doi: 10.1038/ng.180. [DOI] [PubMed] [Google Scholar]
- 13.Wall J.D., Cox M.P., Mendez F.L., Woerner A., Severson T., Hammer M.F. A novel DNA sequence database for analyzing human demographic history. Genome Res. 2008;18:1354–1361. doi: 10.1101/gr.075630.107. [DOI] [PMC free article] [PubMed] [Google Scholar]
- 14.Ng S.B., Turner E.H., Robertson P.D., Flygare S.D., Bigham A.W., Lee C., Shaffer T., Wong M., Bhattacharjee A., Eichler E.E. Targeted capture and massively parallel sequencing of 12 human exomes. Nature. 2009;461:272–276. doi: 10.1038/nature08250. [DOI] [PMC free article] [PubMed] [Google Scholar]
- 15.Bentley D.R., Balasubramanian S., Swerdlow H.P., Smith G.P., Milton J., Brown C.G., Hall K.P., Evers D.J., Barnes C.L., Bignell H.R. Accurate whole human genome sequencing using reversible terminator chemistry. Nature. 2008;456:53–59. doi: 10.1038/nature07517. [DOI] [PMC free article] [PubMed] [Google Scholar]
- 16.Kim J.I., Ju Y.S., Park H., Kim S., Lee S., Yi J.H., Mudge J., Miller N.A., Hong D., Bell C.J. A highly annotated whole-genome sequence of a Korean individual. Nature. 2009;460:1011–1015. doi: 10.1038/nature08211. [DOI] [PMC free article] [PubMed] [Google Scholar]
- 17.Schuster S.C., Miller W., Ratan A., Tomsho L.P., Giardine B., Kasson L.R., Harris R.S., Petersen D.C., Zhao F., Qi J. Complete Khoisan and Bantu genomes from southern Africa. Nature. 2010;463:943–947. doi: 10.1038/nature08795. [DOI] [PMC free article] [PubMed] [Google Scholar]
- 18.Wang J., Wang W., Li R., Li Y., Tian G., Goodman L., Fan W., Zhang J., Li J., Zhang J. The diploid genome sequence of an Asian individual. Nature. 2008;456:60–65. doi: 10.1038/nature07484. [DOI] [PMC free article] [PubMed] [Google Scholar]
- 19.Tong P., Prendergast J.G., Lohan A.J., Farrington S.M., Cronin S., Friel N., Bradley D.G., Hardiman O., Evans A., Wilson J.F., Loftus B. Sequencing and analysis of an Irish human genome. Genome Biol. 2010;11:R91. doi: 10.1186/gb-2010-11-9-r91. [DOI] [PMC free article] [PubMed] [Google Scholar]
- 20.Wheeler D.A., Srinivasan M., Egholm M., Shen Y., Chen L., McGuire A., He W., Chen Y.J., Makhijani V., Roth G.T. The complete genome of an individual by massively parallel DNA sequencing. Nature. 2008;452:872–876. doi: 10.1038/nature06884. [DOI] [PubMed] [Google Scholar]
- 21.Durbin R.M., Abecasis G.R., Altshuler D.L., Auton A., Brooks L.D., Gibbs R.A., Hurles M.E., McVean G.A., 1000 Genomes Project Consortium A map of human genome variation from population-scale sequencing. Nature. 2010;467:1061–1073. doi: 10.1038/nature09534. [DOI] [PMC free article] [PubMed] [Google Scholar]
- 22.Green P. 2x genomes—does depth matter? Genome Res. 2007;17:1547–1549. doi: 10.1101/gr.7050807. [DOI] [PubMed] [Google Scholar]
- 23.Abdulla M.A., Ahmed I., Assawamakin A., Bhak J., Brahmachari S.K., Calacal G.C., Chaurasia A., Chen C.H., Chen J., Chen Y.T., HUGO Pan-Asian SNP Consortium. Indian Genome Variation Consortium Mapping human genetic diversity in Asia. Science. 2009;326:1541–1545. doi: 10.1126/science.1177074. [DOI] [PubMed] [Google Scholar]
- 24.Hatin W.I., Nur-Shafawati A.R., Zahri M.K., Xu S., Jin L., Tan S.G., Rizman-Idid M., Zilfalil B.A., HUGO Pan-Asian SNP Consortium Population genetic structure of peninsular Malaysia Malay sub-ethnic groups. PLoS ONE. 2011;6:e18312. doi: 10.1371/journal.pone.0018312. [DOI] [PMC free article] [PubMed] [Google Scholar]
- 25.Edinur H.A., Zafarina Z., Spínola H., Nurhaslindawaty A.R., Panneerchelvam S., Norazmi M.N. HLA polymorphism in six Malay subethnic groups in Malaysia. Hum. Immunol. 2009;70:518–526. doi: 10.1016/j.humimm.2009.04.003. [DOI] [PubMed] [Google Scholar]
- 26.Li H., Handsaker B., Wysoker A., Fennell T., Ruan J., Homer N., Marth G., Abecasis G., Durbin R., 1000 Genome Project Data Processing Subgroup The Sequence Alignment/Map format and SAMtools. Bioinformatics. 2009;25:2078–2079. doi: 10.1093/bioinformatics/btp352. [DOI] [PMC free article] [PubMed] [Google Scholar]
- 27.Wang K., Li M., Hakonarson H. ANNOVAR: functional annotation of genetic variants from high-throughput sequencing data. Nucleic Acids Res. 2010;38:e164. doi: 10.1093/nar/gkq603. [DOI] [PMC free article] [PubMed] [Google Scholar]
- 28.Ng P.C., Levy S., Huang J., Stockwell T.B., Walenz B.P., Li K., Axelrod N., Busam D.A., Strausberg R.L., Venter J.C. Genetic variation in an individual human exome. PLoS Genet. 2008;4:e1000160. doi: 10.1371/journal.pgen.1000160. [DOI] [PMC free article] [PubMed] [Google Scholar]
- 29.Adzhubei I.A., Schmidt S., Peshkin L., Ramensky V.E., Gerasimova A., Bork P., Kondrashov A.S., Sunyaev S.R. A method and server for predicting damaging missense mutations. Nat. Methods. 2010;7:248–249. doi: 10.1038/nmeth0410-248. [DOI] [PMC free article] [PubMed] [Google Scholar]
- 30.Chen K., Wallis J.W., McLellan M.D., Larson D.E., Kalicki J.M., Pohl C.S., McGrath S.D., Wendl M.C., Zhang Q., Locke D.P. BreakDancer: an algorithm for high-resolution mapping of genomic structural variation. Nat. Methods. 2009;6:677–681. doi: 10.1038/nmeth.1363. [DOI] [PMC free article] [PubMed] [Google Scholar]
- 31.Hormozdiari F., Hajirasouliha I., Dao P., Hach F., Yorukoglu D., Alkan C., Eichler E.E., Sahinalp S.C. Next-generation VariationHunter: combinatorial algorithms for transposon insertion discovery. Bioinformatics. 2010;26:i350–i357. doi: 10.1093/bioinformatics/btq216. [DOI] [PMC free article] [PubMed] [Google Scholar]
- 32.Flicek P., Amode M.R., Barrell D., Beal K., Brent S., Chen Y., Clapham P., Coates G., Fairley S., Fitzgerald S. Ensembl 2011. Nucleic Acids Res. 2011;39(Database issue):D800–D806. doi: 10.1093/nar/gkq1064. [DOI] [PMC free article] [PubMed] [Google Scholar]
- 33.Stenson P.D., Ball E., Howells K., Phillips A., Mort M., Cooper D.N. Human Gene Mutation Database: towards a comprehensive central mutation database. J. Med. Genet. 2008;45:124–126. doi: 10.1136/jmg.2007.055210. [DOI] [PubMed] [Google Scholar]
- 34.Price A.L., Patterson N.J., Plenge R.M., Weinblatt M.E., Shadick N.A., Reich D. Principal components analysis corrects for stratification in genome-wide association studies. Nat. Genet. 2006;38:904–909. doi: 10.1038/ng1847. [DOI] [PubMed] [Google Scholar]
- 35.Vithana E.N., Khor C.C., Qiao C., Nongpiur M.E., George R., Chen L.J., Do T., Abu-Amero K., Huang C.K., Low S. Genome-wide association analyses identify three new susceptibility loci for primary angle closure glaucoma. Nat. Genet. 2012;44:1142–1146. doi: 10.1038/ng.2390. [DOI] [PMC free article] [PubMed] [Google Scholar]
- 36.Fan Q., Barathi V.A., Cheng C.Y., Zhou X., Meguro A., Nakata I., Khor C.C., Goh L.K., Li Y.J., Lim W. Genetic variants on chromosome 1q41 influence ocular axial length and high myopia. PLoS Genet. 2012;8:e1002753. doi: 10.1371/journal.pgen.1002753. [DOI] [PMC free article] [PubMed] [Google Scholar]
- 37.Han S., Chen P., Fan Q., Khor C.C., Sim X., Tay W.T., Ong R.T., Suo C., Goh L.K., Lavanya R. Association of variants in FRAP1 and PDGFRA with corneal curvature in Asian populations from Singapore. Hum. Mol. Genet. 2011;20:3693–3698. doi: 10.1093/hmg/ddr269. [DOI] [PubMed] [Google Scholar]
- 38.Khor C.C., Ramdas W.D., Vithana E.N., Cornes B.K., Sim X., Tay W.T., Saw S.M., Zheng Y., Lavanya R., Wu R. Genome-wide association studies in Asians confirm the involvement of ATOH7 and TGFBR3, and further identify CARD10 as a novel locus influencing optic disc area. Hum. Mol. Genet. 2011;20:1864–1872. doi: 10.1093/hmg/ddr060. [DOI] [PubMed] [Google Scholar]
- 39.Pelak K., Shianna K.V., Ge D., Maia J.M., Zhu M., Smith J.P., Cirulli E.T., Fellay J., Dickson S.P., Gumbs C.E. The characterization of twenty sequenced human genomes. PLoS Genet. 2010;6:6. doi: 10.1371/journal.pgen.1001111. [DOI] [PMC free article] [PubMed] [Google Scholar]
- 40.MacArthur D.G., Balasubramanian S., Frankish A., Huang N., Morris J., Walter K., Jostins L., Habegger L., Pickrell J.K., Montgomery S.B., 1000 Genomes Project Consortium A systematic survey of loss-of-function variants in human protein-coding genes. Science. 2012;335:823–828. doi: 10.1126/science.1215040. [DOI] [PMC free article] [PubMed] [Google Scholar]
- 41.Ju Y.S., Yoo Y.J., Kim J.-I., Seo J.-S. The first Irish genome and ways of improving sequence accuracy. Genome Biol. 2010;11:132. doi: 10.1186/gb-2010-11-9-132. [DOI] [PMC free article] [PubMed] [Google Scholar]
- 42.Jallow M., Teo Y.Y., Small K.S., Rockett K.A., Deloukas P., Clark T.G., Kivinen K., Bojang K.A., Conway D.J., Pinder M., Wellcome Trust Case Control Consortium. Malaria Genomic Epidemiology Network Genome-wide and fine-resolution association analysis of malaria in West Africa. Nat. Genet. 2009;41:657–665. doi: 10.1038/ng.388. [DOI] [PMC free article] [PubMed] [Google Scholar]
- 43.Cho Y.S., Chen C.H., Hu C., Long J., Ong R.T., Sim X., Takeuchi F., Wu Y., Go M.J., Yamauchi T., DIAGRAM Consortium. MuTHER Consortium Meta-analysis of genome-wide association studies identifies eight new loci for type 2 diabetes in east Asians. Nat. Genet. 2012;44:67–72. doi: 10.1038/ng.1019. [DOI] [PMC free article] [PubMed] [Google Scholar]
- 44.Okada Y., Sim X., Go M.J., Wu J.Y., Gu D., Takeuchi F., Takahashi A., Maeda S., Tsunoda T., Chen P., KidneyGen Consortium. CKDGen Consortium. GUGC consortium Meta-analysis identifies multiple loci associated with kidney function-related traits in east Asian populations. Nat. Genet. 2012;44:904–909. doi: 10.1038/ng.2352. [DOI] [PMC free article] [PubMed] [Google Scholar]
- 45.Kato N., Takeuchi F., Tabara Y., Kelly T.N., Go M.J., Sim X., Tay W.T., Chen C.H., Zhang Y., Yamamoto K. Meta-analysis of genome-wide association studies identifies common variants associated with blood pressure variation in east Asians. Nat. Genet. 2011;43:531–538. doi: 10.1038/ng.834. [DOI] [PMC free article] [PubMed] [Google Scholar]
- 46.Khor C.C., Chau T.N., Pang J., Davila S., Long H.T., Ong R.T., Dunstan S.J., Wills B., Farrar J., Van Tram T. Genome-wide association study identifies susceptibility loci for dengue shock syndrome at MICB and PLCE1. Nat. Genet. 2011;43:1139–1141. doi: 10.1038/ng.960. [DOI] [PMC free article] [PubMed] [Google Scholar]
Associated Data
This section collects any data citations, data availability statements, or supplementary materials included in this article.