Abstract
Background
The burden of chronic non-communicable diseases is on the rise in middle and low income countries on top of the existing infectious diseases. Moreover, the distributions of the specific risk factors are not systematically identified in those countries hampering the designing of appropriate preventive and control strategies. The objective of this component of the study was to describe the distribution of risk factors for chronic non-communicable diseases.
Methods
The cross sectional study was conducted from September 2008 to January 2009 at Gilgel Gibe Field Research Center of Jimma University. Data were collected using WHO steps instruments translated into the local languages. Individuals for the study were selected by stratified random sampling for interviewing, physical examination and biochemical tests from the study base. Data were analyzed using SPSS for Windows version 16.0 and STATA 11.
Results
The distribution of the various categories of risk factors is identified. Among the behavioral risk factors, the prevalence of smoking is 9.3%, alcohol consumption 7.3%, consumption of fruits and vegetables below adequate level 27.0%, low level physical activity (16.9%) and khat chewing (38.6%). The prevalence of physical risk factors is 9.3% for hypertension, 2.6% for overweight and 33.3% central obesity. The prevalence of metabolic disorders is 10.7% for high total cholesterol and 7.7% for raised triglyceride. Overall, 80.0% of the population had at least one of the risk factors.
Conclusion
The magnitude of risk factors for chronic non-communicable diseases is considerably high in the study population. Appropriate preventive measure and should be designed to prevent and control these risk factors.
Keywords: Risk factors, CNCD, southwest Ethiopia
Introduction
Chronic non-communicable diseases (CNCDs) such as cardiovascular diseases, cancer, chronic respiratory disease, mental illnesses and diabetes are leading causes of death and disability worldwide (1–3). The major identified risk factors for most CNCDs include tobacco use, alcoholism, high blood pressure, high blood glucose, serum lipid abnormalities, obesity, low fruit and vegetable intake, physical inactivity and biological factors (4, 5). Studies have indicated that these risk factors are widespread globally (5). On the other hand it is shown that level of education, occupation and income affect tobacco use, physical activity and dietary habit which further influence Body Mass Index (BMI), blood pressure, and cholesterol level (2). Khat chewing was shown to be associated with mental disorders, increased blood pressure, palpitation (6–8) and myocardial infarction (9,10) in Ethiopia.
CNCDs can be prevented if the community gets appropriate information, education and communication on possible risk factors. Most of the risks are attributable to lifestyle and behavioral patterns, and can be changed (2, 4). Therefore, determining the burden of risk factors for CNCDs in the population would help to design and implement promotive and preventive measures. In the developing world, wide gap exists between the reality of the chronic disease burden and the response to it. If the emergence and prevention of risk factors are left undirected, growth of the problem will continue accelerating (11–12). Therefore a balance in prevention and control intervention between the already prevalent infectious diseases and the rising burden of CNCDs would be the best way forward (3, 11).
In the last few years, life style of the Ethiopian population is changing due to urbanization and demographic transition (13, 14). As a result the burden of CNCDs could be on the rise. In view of the above context and recognizing the paucity of similar studies in the country, this study was conducted to determine the prevalence of known risk factors for CNCDs such as smoking, alcoholism, physical inactivity, suboptimal dietary habit, Khat chewing as well as metabolic disorders in community setting.
Subjects, Materials and Methods
This population-based cross-sectional survey of risk factors for CNCDs was conducted from September 2008 to January 2009 at Gilgel Gibe Field Research Center (GGFRC) of Jimma University. This study was part of the survey for determination of magnitude of CNCDs, risk factors of CNCDs and biochemical, immunological and hematological value determination for the community at GGFRC.
Individuals' aged 15 to 64 years from both sexes, who were residents of the 10 kebeles under surveillance by the research center were studied. The sample size was determined based on the WHO STEPS guideline (15), which has three steps for stepwise assessment of risk factors for CNCDs. Step one, two and three were used to assess the risk factors through interviewing, physical measurement and biochemical tests, respectively. The population was stratified by sex, age (15–24 years, 25–34 years, 35–44 years, 45–54 years and 55–64 years) and residential area (urban and rural) and such stratification was considered in the sample size calculation so as to be able to make analysis by those variables. For step one (interview) and two (physical measurement), 250 individuals from each sex and each age stratum were taken giving a sample size of 2500. However, due to further stratification by residential area, the sample size was doubled to 5,000. Taking 10% non-response rate, the total sample size became 5,500. The sample was allotted to each age, sex and residential area stratum proportional to its size. Individual study participants were then selected from each stratum by stratified random sampling.
For step three (biochemical testing), 60% (3,300) of the sampled individuals for step one and two were selected by simple random sampling and included for blood sample collection as per WHO STEPS manual recommendation.
Data collection instruments for the study were adapted from WHO STEPS instruments and translated to local languages (Amharic and Afan Oromo). The instruments were structured and contained questionnaire for Step one and recording formats for Step two and Step three. The questionnaire for Step 1 comprised questions about socioeconomic and demographic variables and questions for assessing behavioral risk factors for CNCDs including cigarette smoking, alcohol drinking, dietary habit, khat chewing, and level of physical activity. The recording formats were used to record physical measurement values of Step 2 such as blood pressure (BP), pulse rate, weight, height, waist and hip circumference; and values for biochemical markers of Step 3 such as fasting blood sugar level, total blood cholesterol level and blood triglycerides level (15).
Fifteen interviewers, six physical measurement recorders and three supervisors who completed at least high school and competent in local languages were recruited and trained on how to obtain consent, use equipments and how to perform and record the physical measurements. Two nurses and two laboratory technicians were recruited and trained to collect blood sample, determine blood sugar level, and transport blood sample. The blood sample was transported in icepack and stored in freezers until analyzed. Six trained laboratory technicians performed the laboratory analysis at Jimma University within 12 hours of blood sample collection.
Pre-test was conducted on the interview and measurement sections of the study instrument. After the pre-test, data collectors, supervisors and investigators discussed on experiences and identified gaps. Standardized measuring instruments were used for physical measurements and standard laboratory equipments and procedures were used to determine biomarkers. Daily supervision of the data collection was made. Detailed information on methods particularly sampling procedures, physical measurement and blood sample collection and processing methods are described in articles 1, 3 and 4 of this special issue.
Data were analyzed using SPSS for Windows version 16.0 after double data entry using EpiData version 2. Background of study participants was described and prevalence of risk factors of CNCDs were determined and presented in tables. The values for risk factors were classified based on the WHO STEPS manual recommendations. Accordingly, low serving of fruits and vegetables was defined as less than five serving of fruits and vegetables per day; low level of physical activity as less than 600MET (16); hypertension as systolic blood pressure 140mmHg or above and/or diastolic blood pressure 90mmHg or above; overweight as BMI 25Kg/m2 or higher, central obesity as Waist to Hip Ratio (WHR) greater than one for men and greater than 0.85 for women; high cholesterol as blood cholesterol level 5.22mmol/L or more; and raised triglyceride as blood triglyceride level 2.26mmol/L or more (15).
Ethical clearance was obtained from Jimma University's Research and Publication Office, and signed informed consent was obtained from study participants before interview, physical measurements and blood sample collection.
Detailed information on methods particularly sampling procedures, physical measurement and blood sample collection and processing methods are also described in the other articles in this issue.
Results
The overall response rate for the interview, physical measurement and biochemical testing was 81.3%, 64.7% and 55.5%, respectively. Seventy five percent of the interviewed, 81.8% of those physically measured and 91.9% of whose blood sample processed were from rural setting. Fifty three percent of the interviewed, 52.2% of those physically measured and 50.6% of whose blood sample processed were female. The socio-demographic characteristics of the study population are described in articles 1 of this special issue while for the physical measurement and biochemical testing are described in article 3, 4, and 5 of this special issues.
Behavioral risk factors for CNCDs assessed through interview were cigarette smoking, alcohol drinking, dietary habit, khat chewing, and level of physical activity. Accordingly, 9.3% of the respondents were smoking cigarette (all kinds) at the time of the study; more than eighteen percent males were smokers, and 10.6% were from rural and 5.3% form urban areas. Current alcohol consumption at the time of study was 7.1% which was higher among men (8.7%) than women (5.7%) and among urban (19.6%) than rural (2.9%) residents. Twenty seven percent of the study population ate less than five servings of fruit and vegetables a day. The proportion of those who consumed less than five serving ranged from 25.3% in urban men to 28.2% in rural women. Low level of physical activity was found in 722 (16.9%) of the population which peaked among urban women (24.8%). Current Khat chewing was reported by 1680(38.6%) of the population. The prevalence of chewing was higher for men reaching up to 49.9% among urban men (Table 1).
Table 1.
Prevalence of behavioral risk factors for CNCDs, GGFRC, Sept.2008–Jan. 2009.
| Risk factors | Urban | Rural | Total | ||||
| Men No(%) |
Women No(%) |
Men No(%) |
Women No(%) |
Men No(%) |
Women No(%) |
Total No(%) |
|
| Current smoker | |||||||
| n | 489 | 593 | 1604 | 1674 | 2093 | 2267 | 4360 |
| Yes | 53 (10.8) | 4 (0.7) | 331(21.6) | 18 (1.1) | 384 (18.3) | 22 (1.0) | 406 (9.3) |
| Alcohol consumption | |||||||
| n | 487 | 591 | 1602 | 1672 | 2089 | 2263 | 4352 |
| Yes | 115 (23.6) | 96 (16.2) | 62(3.9) | 34 (2.0) | 177(8.5) | 130(5.7) | 307(7.1) |
| Fruits and vegetables | |||||||
| n | 454 | 557 | 1544 | 1590 | 1998 | 2147 | 4145 |
| Yes (< 5 servings/d) | 115(25.3) | 156(28.0) | 399 (25.8) | 449(28.2) | 514(25.7) | 605(28.2) | 1119(27.0) |
| Low level of physical activity (MET- minute/wk) |
|||||||
| n | 471 | 573 | 1573 | 1649 | 2044 | 2222 | 4266 |
| Yes (< 600 MET) | 71 (15.1) | 142(24.8) | 147(9.3) | 362(22.0) | 218(10.7) | 504(22.7) | 722(16.9) |
| Khat chewing | |||||||
| n | 489 | 593 | 1598 | 1673 | 2087 | 2266 | 4353 |
| Yes | 244 (49.9) | 80 (13.5) | 1075(67.3) | 281(16.8) | 1319(63.2) | 361(15.9) | 1680(38.6) |
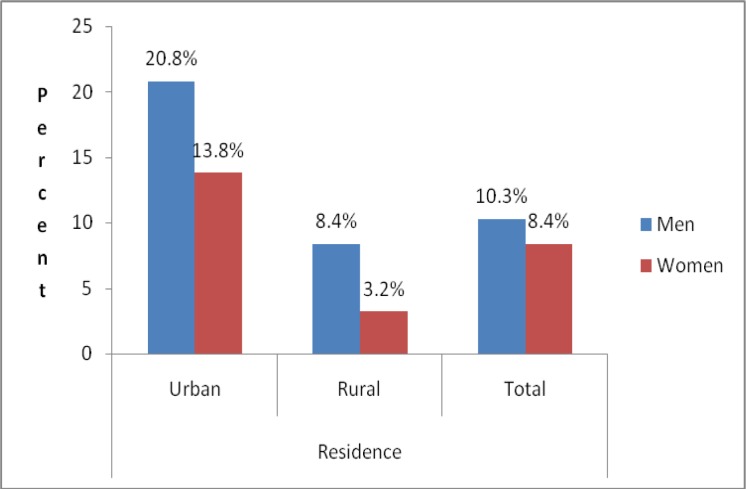
Physical measurements performed to assess risk factors were measurement of blood pressure level, weight, height, waist circumference and hip circumference. Three hundred (9.3%) of the study participants had raised blood pressure. The prevalence of raised blood pressure was higher among men than women and urban than rural area, with highest prevalence among urban men (20.8%) (Fig 1).
Figure 1.
Prevalence of hypertension rates by sex and place of residence, GGFRC, Sept 2008–Jan 2009.
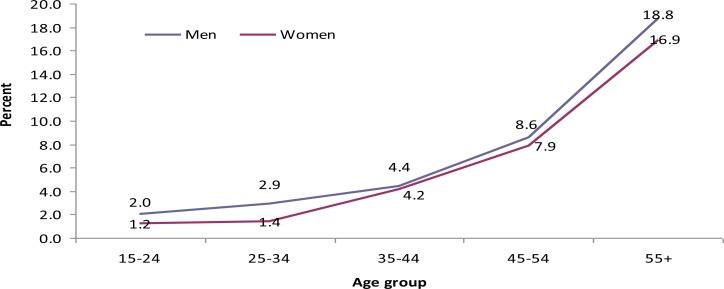
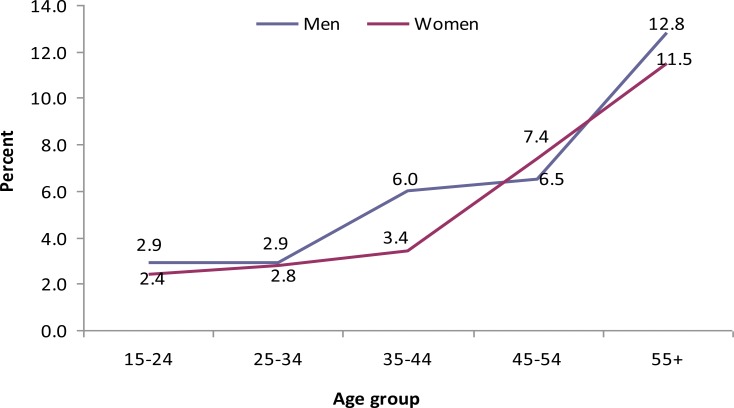
In both sexes, the magnitude of raised systolic and diastolic blood pressure increased with age (Fig 2 and 3). Eighty three (2.6%) (1.5% men and 3.5% women) of the study subjects had BMI ≥ 25 kg/m2. Overweight was more prevalent in urban than rural area. According to waist hip circumference ratio (WHC), the overall prevalence of central obesity was 33.3%. More than six percent males and 59.4% women had central obesity.
Figure 2.
Pattern of high systolic blood pressure rates by age group and sex, GGFRC, Sept 2008–Jan 2009.
Figure 3.
Pattern of high diastolic blood pressure rates by age group and sex, GGFRC, Sept 2008–Jan 2009.
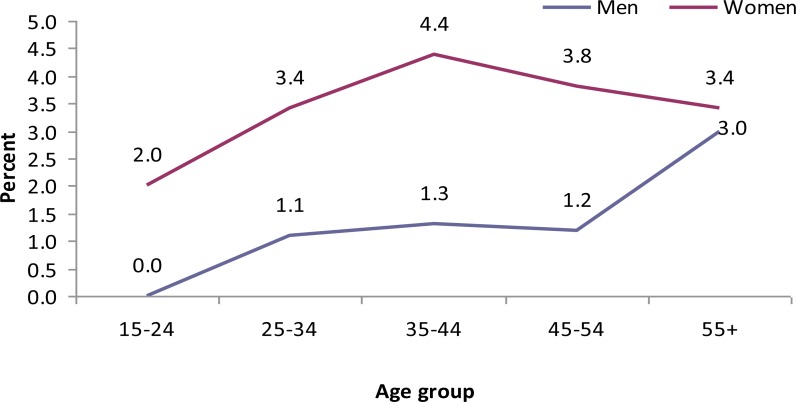
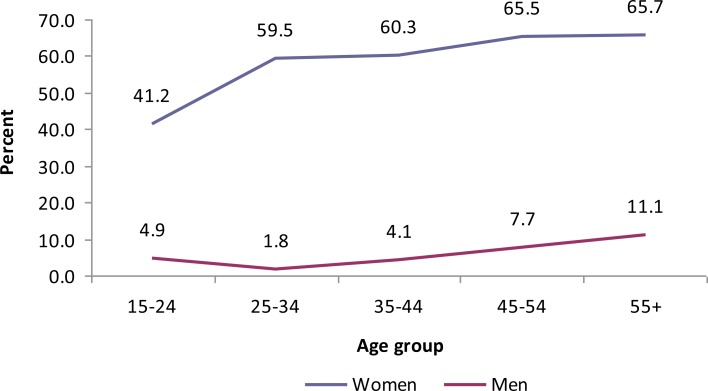
The highest prevalence of central obesity was found among urban women (60.6%) (Table 2). Body mass index increased with age (Fig 4), however, there was no significant change of the WHR with age (Fig 5).
Table 2.
Prevalence of physical and biochemical risk factors for CNCDs, GGFRC, Sept 2008–Jan 2009.
| Risk factors | Urban | Rural | Total | ||||
| Men No(%) |
Women No(%) |
Men No(%) |
Women No(%) |
Men No(%) |
Women No(%) |
Total No(%) |
|
| High blood pressure | |||||||
| n | 231 | 318 | 1309 | 1363 | 1548 | 1681 | 3221 |
| Yes | 48 (20.8) | 44 (13.8) | 110 (8.4) | 98(3.2) | 158(10.3) | 142 (8.4) | 300 (9.3) |
| High BMI | |||||||
| n | 232 | 320 | 1316 | 1379 | 1548 | 1699 | 3247 |
| Yes¥ | 17 (7.3) | 32 (10.0) | 6 (0.5) | 28 (2.0) | 23 (1.5) | 60 (3.5) | 83 (2.6) |
| High WHR ratio | |||||||
| n | 232 | 301 | 1311 | 1301 | 1543 | 1602 | 3145 |
| Yes⌖ | 21 (9.1) | 162 (53.8) | 75 (5.7) | 789(60.6) | 96(6.2) | 951(59.4) | 1047(33.3) |
| High cholesterol level |
|||||||
| n | 103 | 138 | 764 | 754 | 867 | 892 | 1759 |
| Yes£ | 18 (17.5) | 29(21.0) | 60(7.9) | 81(10.7) | 78(9.0) | 110(12.3) | 188(10.7) |
| Raised triglyceride level |
|||||||
| n | 102 | 138 | 743 | 735 | 845 | 873 | 1718 |
| Yes✠ | 15 (14.7) | 17(12.3) | 55(7.4) | 46(6.3) | 70(8.3) | 67(7.2) | 133(7.7) |
| Percentage with at least one risk |
|||||||
| n | 492 | 594 | 1622 | 1692 | 2114 | 2286 | 4400 |
| Yes | 395 (80.3) | 474(79.8) | 1315(81.1) | 1355(80.1) | 1710(80.9) | 1829(80.0) | 3539(80.4) |
WHC= Waist to hip circumference, BMI= Body mass index,
SBP ≥140 and/ or DBP ≥90 mmHg,
BMI≥25Kg/m2,
1 for males and ≥ 0.86 for females,
(≥ 5.22 mmol/L,
≥ 2.26 mmol/L
Figure 4.
Pattern of high BMI rates by age group and sex, GGFRC, Sept 2008–Jan 2009.
Figure 5.
Pattern of high waist to hip circumference ratio by age group and sex, GGFRC, Sept 2008–Jan 2009.
On biochemical analysis of blood samples the risk factors assessed were blood cholesterol and triglyceride level. One hundred eighty eight (10.7%) of the study participants (12.3% women and 9.0% men) had high total serum cholesterol level (given the cut of point). The prevalence of high cholesterol was higher in urban than rural areas. Regarding high triglyceride, it was detected in 133 of the study population giving overall prevalence of 7.7%. The prevalence was higher in urban than rural area with weak difference among men and women. Overall, 80% of the study population, with similar proportion within residence and sex, had at least one risk for CNCDs (Table 2).
Discussion
Risk factors distribution assessment is essential for prevention and control of CNCDs. This study focused on estimating prevalence of known behavioral, biophysical and biochemical risk factors for CNCDs. To assure validity of findings, the study has used standardized methods recommended by WHO STEPS guideline and sampling methods which involved simple random sampling technique. However, underreporting of smoking, khat chewing and alcohol consumption could have happened due to social desirability bias. This study is the first of its kind in the country to undertake all the three components of WHO STEPS in a community setting. Non-response for physical and biochemical measurement were discussed in article 3, 4, and 5 of this special issue. Low response rate perhaps affected the true distribution of the risk factors and results should be interpreted with cautions.
The prevalence of current smoking (9.3%) was higher than findings of a national study in Ethiopia (17), findings of community-based studies in Butajira, Ethiopia (18, 19), and findings among higher education communities in Ethiopia and elsewhere (20–22). The fact that considerable proportion of the community was smoking that puts them at higher risk for CNCDs (23) clearly demands prompt action. Current smoking was more prevalent among men (18.3%) compared to women (1.0%). This finding is consistent with findings of other studies (17–19, 24). The prevalence for rural community (10.6%) was twice higher than urban (5.3%). Similarly, though not as big, a slightly higher prevalence was observed in rural population in the national study in Ethiopia (17). The reasons for such difference need to be investigated further. This rural to urban difference could be due to social desirability bias for cigarette smoking in urbanized society.
The current prevalence of alcohol consumption in the population (7.3%) was much lower than the prevalence found in Butajira town, Ethiopia (25). The lower prevalence in our study population might be due to religion difference where most of our respondents were Muslim where alcohol consumption is prohibited. Alcohol consumption prevalence was higher among men (8.5%) compared to women (5.7%). Similarly, studies conducted at community settings in Ethiopia (18, 25) and among University students in Ethiopia (20) and South Africa (26) showed the same pattern. The prevalence of alcohol consumption was higher for urban (19.6%) population than rural (2.9%).
The current prevalence of khat chewing (38.6%) is lower than the finding in Butajira, Ethiopia (18) but higher than findings of other studies in Ethiopia (20, 21, 27, 28). The difference could be due to cultural and age differences among the study populations.
Concerning dietary pattern about a quarter (27.0%) of the population reported to consume fruits and vegetables below adequate level (below five servings per day). The proportion of the population who consumed fruits and vegetables below adequate level in this study is by far lower than the findings in all 52 countries taking part in the 2002–2003 world health survey including Ethiopia. The prevalence of low fruit and vegetable intake in pooled sample from all the 52 countries was 78.0% (29). One possible reason contributing for such a difference could be the fact that coverage of world health survey was national but this study was carried out in specific locality of the nation where the production of fruit and vegetable is better due to abundant rain fall. Population in the study area produced more of sorghum, maize and other cereals which could affect their consumption.
Low level of physical activity was reported by 16.9% of the population which is higher than findings of other studies in Ethiopia (17, 18). This puts the population at higher risk of cardiovascular, strokes and even cancer (23). The level of inactivity was higher in urban (20.4%) than rural (15.8%) and among women (22.7%) than men (10.7%). This is consistent with findings of other studies in Ethiopia (17, 18). The difference might be due to the fact that the occupation for rural population than urban and for men than women was farming which contributes for their physical activity. Despite the level of physical inactivity in rural was lower than urban, still higher than expected most people in rural areas are active and have significant amount of exertion which needs further studies using different tools that are more sensitive to rural population.
The prevalence of hypertension (9.3%) is similar with the finding in rural Butajira, Ethiopia (18) and most of the findings in systematic review of 25 studies conducted in 10 sub-Saharan African countries (30) but it is lower than the finding in Addis Ababa, Ethiopia (18) and systematic review of findings of studies in Europe and North America (31). The possible reasons for the difference could be variations of study populations in socio-demographic and economic characteristics. The observed prevalence of hypertension was more than two times higher in urban (17.0%) than rural (7.8%) areas. This is consistent with the findings in Ethiopia (18) and the systematic review of sub-Saharan studies (30). Hypertension was more prevalent among men (10.3%) than women (8.4%) in this study which is consistent with findings in Ethiopia (18) and review of European and North American studies (31). But the findings in review of sub-Saharan Africa didn't show consistent difference across countries (30).
The prevalence of overweight (BMI ≥ 25kg/m2) was 2.6%. The prevalence of overweight was lower than the findings in Addis Ababa, Ethiopia (18) and other countries like South Africa (32) Pakistan (33) and Germany (34). This difference could be explained by genetic, dietary, economic and socio-cultural differences between the study populations. The other reason could be the fact that more than three-fourth of the study participants were from the rural setting where they are physically more active. Our study participants were mainly from rural areas which could also explain their lower BMI. Women (3.5%) were more likely to be overweight compared to their men counterparts (1.5%). One possible reason for the difference might be due to the fact that men are involved more in farming activities which involves more physical exertion. Similar sex variation was found in the studies in South Africa (32) and Pakistan (35) but reversed in the German study (34). The distribution of overweight was higher among urban population (8.9%) compared to rural (1.3%) which is consistent with the findings in Pakistan (33). The variation between urban and rural could be due to dietary habit change and more sedentary lifestyle associated with urbanization (2).
Central obesity as measured by WHC was present in 33.3% of the study population showing huge difference between women (59.4%) and men (6.2%). There could be some pregnant women who could have affected the prevalence in women. Similar pattern of sex variation was reported in other studies (32, 34) and particularly the South African study found roughly comparable huge difference between women (42%) and men (9.2%) (32). Again like for overweight, the fact that men are engaged more in field farm activities could explain the low level of central obesity in men as compared to their women counterparts. The prevalence of central obesity in men is lower as compared to the findings of the other studies whereas the prevalence in women is higher (32, 34). Though this difference could be explained partially by the difference in genetic and lifestyle of the study population, the existence of such significant difference between the genders in this study needs further investigation. Like for overweight the prevalence of central obesity is higher in urban prevalence than in rural area.
Cholesterol level was high in 10.7% of the population. It was more common in urban (19.5%) than rural (9.3%) residents. This could be explained by higher prevalence of obesity and physical inactivity in the urban residents. The distribution was higher among women (12.3%) than men (9.0%). This observation is consistent with the above findings on obesity. The prevalence of raised triglyceride was 7.7%. Consistent with findings on obesity and high cholesterol, raised triglyceride was more common in urban (13.3%) than rural (6.8%) population.
In conclusion the distribution of risk factors for CNCDs is considerably high in the study population. In terms of residence alcohol consumption, low dietary intake of fruits and vegetables, and low level of physical activity were more common in urban area whereas smoking and khat chewing habits were more common in rural area. High BMI and central obesity as well as high cholesterol were common among women while hypertension was more common among men. These findings are crucial for evidence based decision making. It will help policy makers for planning of preventive and control measures of these modifiable risk factors. This study will also give baseline information that will enable researchers to conduct longitudinal studies.
References
- 1.Strong K, Mathers C, Leeder S, Beaglehole R. Preventing chronic diseases: how many lives can we save? Lancet. 2005;366:1578–1582. doi: 10.1016/S0140-6736(05)67341-2. [DOI] [PubMed] [Google Scholar]
- 2.Preventing Chronic Disease: a vital investment. Geneva: WHO; 2005. [December 2010]. WHO Global Report. Available at www.yearofmicrocredit.org. [Google Scholar]
- 3.WHO, author. The Global Burden of Diseases: 2004 update. Geneva: WHO; 2008. [Google Scholar]
- 4.public health action for healthier children and population. Copenhagen: World Health Organization; 2005. The European health report 2005. [Google Scholar]
- 5.Ezzati M, Hoorn S, Lopez A, et al. Comparative Quantification of Mortality and Burden of Disease Attributable to Selected Risk Factors. In: Lopez A, Mathers C, Ezzati M, Jamison D, Murray C, editors. Global Burden of Disease and Risk Factors. Washington: World Bank; 2006. [PubMed] [Google Scholar]
- 6.Wilder P, Mathys K, Brenneisen R, Kalix P, Fisch HU. Pharmacodynamics and pharmacokinetics of khat: a controlled study. Clin Pharmaco Ther. 1994;5595:556–562. doi: 10.1038/clpt.1994.69. [DOI] [PubMed] [Google Scholar]
- 7.Alem A, Kebede D, Kullgren G. The prevalence and socio-demographic correlates of khat chewing in Butajira, Ethiopia. Acta Psychiatrica Scand. 1999;100:840–891. doi: 10.1111/j.1600-0447.1999.tb10699.x. [DOI] [PubMed] [Google Scholar]
- 8.Ermias M, Samuel E. Correlates of mental distress in Jimma town, Ethiopia. Ethiopian Journal of Health Sciences. 2003;14(1):39–49. [Google Scholar]
- 9.Al-Motarreb A, Briancon S, Al-Adhi B, Salek M, Broadley K. Khat chewing is a risk factor for myocardial infarction: a case-control study. Bri J Clin Pharmacology. 2005;59(5):574–581. doi: 10.1111/j.1365-2125.2005.02358.x. [DOI] [PMC free article] [PubMed] [Google Scholar]
- 10.Westover A, Nakonezny P, Haley R. Acute myocardial infarction resulting in young adults who abuse Amphetamines. Drug Alcohol Depend. 2008;96(1–2):49–56. doi: 10.1016/j.drugalcdep.2008.01.027. [DOI] [PMC free article] [PubMed] [Google Scholar]
- 11.Jamison D, Breman J, Measham A. Priorities in Developing Countries. 2nd. Washington: Oxford University Press and The World Bank; 2006. [Google Scholar]
- 12.Unwin N, Setel P, Rashid S, et al. Non communicable disease in sub-Saharan Africa: where do they feature in the health research agenda? Bull World Health. 2001 [PMC free article] [PubMed] [Google Scholar]
- 13.Central Statistical Agency (CSA) [Ethiopia] and ORC Macro, author. Ethiopia Demographic and Health Survey 2005. Addis Ababa, Ethiopia and Calverton, Maryland, USA: CSA and ORC Macro; 2006. [Google Scholar]
- 14.Federal Democratic of Ethiopia Population Census Commission, author. Summary and Statistical report of the 2007 population and housing census. Addis Ababa: Central Statistics Authority; 2008. Dec, [Google Scholar]
- 15.World Health Organization, author. Chronic diseases and health promotion. STEPwise approach to surveillance (STEPS) STEPS Manual. [December 2005]. Available at: http://www..who.int/chp/steps.
- 16.Guidelines for Data Processing and Analysis of the International Physical Activity Questionnaire (IPAQ) 2005. Nov, Available at www.ipaq.ki.se.
- 17.WHO/Health Statistics and Information Systems, author. World Health Survey Results: Ethiopia 2003. Geneva: WHO; [February 17, 2011]. Available at: http://www.who.int/healthinfo/survey/whseth-ethiopia.pdf. [Google Scholar]
- 18.Tesfaye F. Epidemiology of Cardiovascular Risk Factors in Ethiopia: The Rural-Urban Gradient. Sweden: Umea University; 2008. [Google Scholar]
- 19.Schoenmaker N, Hermanides J, Davey G. Prevalence and Predictors of Smoking in Butajira Town, Ethiopia. Ethiop J Health Dev. 2005;19(3):182–187. [Google Scholar]
- 20.Eshetu E, Gedif T. Prevalence of Khat, cigarette and alcohol use among students of Technology and Pharmacy, Addis Ababa University. Ethioipian Pharmaceutical Journal. 2006;24(2):116–124. [Google Scholar]
- 21.Kebede Y. Cigarette smoking and khat chewing among college students in Northwest Ethiopia. Ethiopian Journal of Health Development. 2002;16(1):9–17. [Google Scholar]
- 22.Ghouth B, Salim A, Ali B. Prevalence and attitudes of smoking among secondary school teachers in Hadramout coastal districts, Yemen. Online Journal of Health and Allied Sciences. 2006;5(2):1–5. [Google Scholar]
- 23.Labarthe D. Epidemiology and Prevention of Cardiovascular Diseases: A Global Challenge. 2nd ed. UK: Jones and Bartlett; 2011. [Google Scholar]
- 24.Fotouhi A, Khabazkhoob M, Hashemi H, Mohammad K. The prevalence of cigarette smoking in residents of Tehran. Archives of Iranian medicine. 2009;12(4):358–364. [PubMed] [Google Scholar]
- 25.Alem A, Kebede D, Kullgren G. The Epidemiology of Problem of Drinking in Butajira, Ethiopia. Acta Psychiatr Scand Suppl. 1999;397:77–83. doi: 10.1111/j.1600-0447.1999.tb10698.x. [DOI] [PubMed] [Google Scholar]
- 26.Peltzer K, Phaswana N. Substance use among South African University students; a quantitative and qualitative study. 1999 [Google Scholar]
- 27.Gelaw Y, Haile-Amlak A. Khat Chewing and its Socio-demographic Correlates among the staff of Jimma University. Ethiopian Jouranl of Health Development. 2004;18(3):179–184. [Google Scholar]
- 28.Belew M, Kebede D, Kassaye M, Enquoselassie F. The Magnitude of Khat Use and its Association with Health, Nutrition and Socio-economic status. Ethiopian Medical Journal. 2000;38(1):11–26. [PubMed] [Google Scholar]
- 29.Hall J, Moore S, Harper S, Lynch J. Global Variability in Fruit and Vegetable Consumption. American Journal of Preventive Medicine. 2009;36(5):402–409. doi: 10.1016/j.amepre.2009.01.029. [DOI] [PubMed] [Google Scholar]
- 30.Addo J, Smeeth L, Leon D. Hypertension in Sub-Saharan Africa: A Systematic Review. Hypertension. 2007;50:1012–1018. doi: 10.1161/HYPERTENSIONAHA.107.093336. [DOI] [PubMed] [Google Scholar]
- 31.Wolf-Maier K, Cooper R, Banegas J, et al. Hypertension Prevalence and Blood Pressure Levels in 6 European Countries, Canada, and the United States. JAMA. 2003;289(18):2363–2369. doi: 10.1001/jama.289.18.2363. [DOI] [PubMed] [Google Scholar]
- 32.Puoane T, Steyn K, Bradshaw D. Obesity in South Africa: The South African Demographic and Health Survey. Obesity Research. 2002;10(10):1038–1048. doi: 10.1038/oby.2002.141. [DOI] [PubMed] [Google Scholar]
- 33.Jafar T, Chaturvedi N, Pappas G. Prevalence of overweight and obesity and their association with hypertension and diabetes mellitus in an Indo-Asian population. CMAJ. 2006;175(9) doi: 10.1503/cmaj.060464. [DOI] [PMC free article] [PubMed] [Google Scholar]
- 34.Hauner H, Bramlage P, Lösch C, et al. Prevalence of obesity in primary care using different anthropometric measures - Results of the German Metabolic and Cardiovascular Risk Project (GEMCAS) BMC Public Health. 2008;8:282. doi: 10.1186/1471-2458-8-282. [DOI] [PMC free article] [PubMed] [Google Scholar]


