

Abstract
Best disease (BD) is an inherited degenerative disease of the human macula that results in progressive and irreversible central vision loss. It is caused by mutations in the retinal pigment epithelium (RPE) gene BESTROPHIN1 (BEST1), which, through mechanism(s) that remain unclear, lead to the accumulation of subretinal fluid and autofluorescent waste products from shed photoreceptor outer segments (POSs). We employed human iPS cell (hiPSC) technology to generate RPE from BD patients and unaffected siblings in order to examine the cellular and molecular processes underlying this disease. Consistent with the clinical phenotype of BD, RPE from mutant hiPSCs displayed disrupted fluid flux and increased accrual of autofluorescent material after long-term POS feeding when compared with hiPSC-RPE from unaffected siblings. On a molecular level, RHODOPSIN degradation after POS feeding was delayed in BD hiPSC-RPE relative to unaffected sibling hiPSC-RPE, directly implicating impaired POS handling in the pathophysiology of the disease. In addition, stimulated calcium responses differed between BD and normal sibling hiPSC-RPE, as did oxidative stress levels after chronic POS feeding. Subcellular localization, fractionation and co-immunoprecipitation experiments in hiPSC-RPE and human prenatal RPE further linked BEST1 to the regulation and release of endoplasmic reticulum calcium stores. Since calcium signaling and oxidative stress are critical regulators of fluid flow and protein degradation, these findings likely contribute to the clinical picture of BD. In a larger context, this report demonstrates the potential to use patient-specific hiPSCs to model and study maculopathies, an important class of blinding disorders in humans.
INTRODUCTION
Human-induced pluripotent stem cells (hiPSCs) offer a relatively non-invasive means to study cell types targeted by disease from living patients, and therefore provide a bridge between clinical and bench research (1–4). Furthermore, hiPSC-derived models are renewable indefinitely, have the capacity to express genes and proteins at endogenous levels and can recapitulate cellular and molecular processes without the need for genetic manipulation. Given these strengths, it is not surprising that the list of hiPSC disease models has steadily grown in recent years (2,5–11). Among diseases to consider for hiPSC modeling, those involving the retina and the brain are especially intriguing, since these tissues are not amenable to routine biopsy, and methods already exist to isolate their progenitors from differentiating hiPSCs and coax them toward later stages of development (1,5,12–16). Within the spectrum of primary retinal disorders, genetic diseases of the retinal pigment epithelium (RPE) are perhaps the most promising candidates for hiPSC modeling at present, since RPE can be readily produced and purified from hiPSCs and re-seeded onto a variety of substrates (17). In addition, RPE cultured from multiple sources, including hiPSCs, has been shown to adopt a mature phenotype and exhibit key physiological functions in vitro (5,14,18–20). Indeed, RPE is one of only a few cell types derived from human pluripotent stem cells that have met standards for use in human clinical trials (21).
In this study, we sought to model Best disease (BD), an autosomal dominant disorder of the RPE that causes secondary photoreceptor degeneration within the macula and concomitant loss of central vision, usually beginning in the second to third decade of life (22,23). One of the earliest clinical manifestations of BD is the appearance of a yellowish ‘egg yolk’ (vitelliform) lesion localized to the subretinal space of the macula (24–26). This characteristic abnormality contains fluid and lipofuscin, an autoflourescent collection of breakdown products from ingested photoreceptor outer segments (POSs) that includes oxidized proteins, lipids, and various fluorophores (24,27). The accumulation of these waste products in BD has been postulated to result from a defect in POS handling by the RPE, although direct evidence for this theory is lacking (26,28).
BD is caused by over 100 different mutations in BEST1, a gene expressed in the RPE and respiratory epithelium, although clinical manifestations of the disease are restricted to the retina (29,30). BEST1 encodes BESTROPHIN1 (BEST1), a protein whose subcellular localization and functional role(s) in RPE have been the subject of considerable debate. In various animal models and in vitro heterologous overexpression systems, Best1 has been suspected of being (i) a calcium-activated chloride channel, bicarbonate transporter and/or volume-regulated anion channel in the basolateral plasma membrane, (ii) a regulator of plasma membrane calcium channels or calcium-activated chloride channels and/or (iii) a chloride channel or calcium sensor in the endoplasmic reticulum (ER) (28,31–38). The diversity of conclusions drawn from these studies underscores the need for a human RPE model system to further evaluate the function of endogenous BEST1 in normal subjects and those with BD.
Toward this end, we generated hiPSCs from two adult BD patients harboring mutations in different regions of BEST1 in an effort to gain further insight into the cellular mechanisms responsible for the common ophthalmological features of the disease. As controls, hiPSCs were also produced from one unaffected sibling from each patient's family. Differentiation of the subject-specific hiPSCs yielded extensive patches of RPE, which could be isolated and further expanded to yield uniform monolayer cultures. Subsequent testing revealed that BD and sibling control hiPSC-RPE have nearly identical physical and molecular properties, with comparable expression levels and localization of BEST1. Furthermore, all cultures were capable of performing key RPE functions, such as vectorial fluid transport and POS phagocytosis. However, when exposed to physiologically relevant stressors, BD hiPSC-RPE cultures exhibited phenotypes that paralleled the clinical features of BD, including reduced fluid flux and increased accumulation of autofluorescent material. Additional analyses of our BD hiPSC-RPE model system suggested that impaired POS degradation and oxidative stress are contributing factors to the pathophysiology of BD, and supported a role for BEST1 in the modulation of ER calcium transients.
RESULTS
Generation and characterization of BD and control hiPSCs
We obtained skin biopsies from two patients with genotype- and phenotype-confirmed BD who harbored A146K (patient 1) or N296H (patient 2) mutations in BEST1. At the time of their last comprehensive ophthalmological examinations by Dr Gerald Fishman at the University of Illinois-Chicago, both patients had visual acuities worse than 20/100, self-reported significant functional impairment and possessed characteristic bilateral macular findings of advanced BD on ophthalmoscopy (Fig. 1A). Fibroblast cell lines were established from the skin biopsies and reprogrammed via lentiviral delivery of the reprogramming genes OCT4, SOX2, c-MYC and KLF4. One unaffected sibling of each BD patient also submitted a skin biopsy, which was processed, cultured and reprogrammed in parallel with its respective BD patient biopsy to establish sibling-matched, control hiPSC lines (Ctr-1 and Ctr-2). We confirmed that all BD hiPSC lines carried the expected BEST1 mutations by sequencing analysis both at the beginning and the end of the study (Fig. 1B). Immunocytochemistry (ICC) analysis followed by confocal microscopy demonstrated that all undifferentiated hiPSC lines expressed the pluripotent markers OCT4, SSEA4, NANOG and TRA-1-81 (Fig. 1C), and teratoma studies confirmed the pluripotency of each hiPSC line (Supplementary Material, Fig. S1A). Furthermore, all hiPSC lines exhibited a normal karyotype (Supplementary Material, Fig. S1B).
Figure 1.

Generation and characterization of BD and control hiPSCs. (A) Fundus photograph of patients with BD harboring two distinct mutations in BEST1 (left: A146K, right: N296H). (B) DNA sequencing confirmed the respective mutation in hiPSC lines derived from patients but not unaffected siblings (Ctr-1: sibling of A146K; Ctr-2: sibling of N296H). (C) Immunocytochemistry demonstrated the expression of pluripotency markers (OCT4, SSEA4, NANOG and TRA-1-81) in undifferentiated hiPSC lines from patients and unaffected siblings (scale bar = 50 µm).
Differentiation of hiPSCs into functional RPE cells
To obtain hiPSC-RPE, embryoid bodies (EBs) were generated as previously described (16), adhered to laminin-coated plates and cultured in retinal differentiation medium (RDM). As early as Day 30–40 of differentiation, isolated patches of RPE were discernible by light microscopy by the virtue of their characteristic polygonal morphology and pigmentation. However, to maximize yield, we typically waited until approximately Day 60–90 of differentiation to microdissect, dissociate and passage larger areas of deeply pigmented hiPSC-RPE. After seeding onto transwell inserts and other surfaces, hiPSC-RPE monolayers would re-form and pigment within 30–60 days, depending on seeding density, at which time they were used in experiments (Fig. 2A). Transmission electron microscopy (Fig. 2B) revealed the presence of typical RPE features including apical microvilli, intracellular pigment granules and tight-junctional complexes across all hiPSC lines. For every experiment, patient-specific BD hiPSC-RPE cultures were grown and passaged in parallel with their corresponding sibling control hiPSC-RPE cultures for the same period of time using hiPSCs of the same passage. All hiPSC-RPE monolayer cultures produced in this manner were morphologically identical and appropriately polarized (Fig. 2C), and uniformly expressed the tight junction protein ZO-1 (Fig. 2D). We further analyzed hiPSC-RPE from each patient and sibling by RT–PCR and western blot, and found that they expressed characteristic RPE genes and proteins such as MERTK, MITF, PEDF, CRALBP, RPE65, OCCLUDIN, EZRIN, CLAUDIN-10 and BEST1 (Fig. 2E and F). Since establishment of functional tight junctions is essential for both the maintenance of epithelial integrity and the barrier role of RPE, we measured transepithelial resistance (TER) across hiPSC-RPE monolayers grown on transwell inserts. Three to four weeks after becoming confluent, BD and control hiPSC-RPE from both families exhibited TERs near or >400 Ω*cm2, similar to human fetal RPE (hfRPE) and well above the 150 Ω*cm2 found in vivo (Fig. 2G) (39). Taken together, our results suggest that RPE cultures established from BD and sibling control hiPSC lines are, at baseline, indistinguishable with regard to many key indices.
Figure 2.

Differentiation of BD and control hiPSCs into functional RPE cells. (A) Photographs and light microscopic images of RPE derived from BD and control hiPSCs plated on transwell inserts showed characteristic RPE morphology and pigmentation (Scale bars: upper panel = 1 mm, lower panel = 100 µm). (B) Transmission electron microscopic images of hiPSC-RPE showed the presence of apical microvilli, intracellular pigment and tight junctions. (C) Apical localization of EZRIN (red) by immunocytochemistry confirmed the proper polarization of hiPSC-RPE (blue: nuclei). (D) Immunocytochemistry for ZO-1 showed correct morphology and tight junction formation in hiPSC-RPE. (E) RT–PCR and (F) western blot analysis revealed the expression of characteristic RPE genes and proteins, respectively. (G) Transepithelial resistance (TER) measurements in hiPSC-RPE were comparable to that of human fetal RPE (hfRPE) (dotted red line demarcates proposed functional threshold) (39). Scale bars: B = 1 µm, C = 5 µm, D = 25µm.
Increased accumulation of autofluorescent material in BD hiPSC-RPE after long-term POS feeding
Early in the course of the BD, patients accumulate a yellowish, autofluorescent material termed lipofuscin in the RPE and subretinal spaces within the macula (22,24). Lipofuscin is composed of POS degradation products and may reflect the inability of RPE in BD patients to adequately process and dispose of POS tips, which are shed each day on a circadian basis. The fact that this striking clinical feature of BD may become evident years after birth suggests that it is a cumulative effect of POS mishandling over time. In an attempt to mimic this phenotype using our BD hiPSC lines, we physiologically stressed hiPSC-RPE from the affected and unaffected subjects by feeding them bovine POS (50/cell) daily for three and a half months, followed by daily washes without feedings for 2 weeks (Fig. 3A). Subsequently, hiPSC-RPE cultures were fixed and immunostained for the tight junction protein ZO-1 (visualized in the far red channel) to outline the cells. The measurement of signal intensity in the red (546 nm) and green (488 nm) channels demonstrated significantly higher autoflourescence levels in BD hiPSC-RPE relative to matched control hiPSC-RPE (Ctr-1: 1.00 ± 0.19 versus A146K: 3.56 ± 1.03, P < 0.05; Ctr-2: 1.00 ± 0.17 versus N296H: 2.22 ± 0.24, P < 0.0005) (Fig. 3B and C). These results demonstrate for the first time the ability to model a critical clinical feature of a macular degenerative disease in vitro using hiPSC-RPE.
Figure 3.

BD hiPSC-RPE displays a clinically relevant cellular phenotype. (A) Schematic depicting the protocol utilized to determine the response of hiPSC-RPE to chronic feeding of unlabeled photoreceptor outer segments (POS). (B) Confocal microscopic images showed an increased accumulation of autofluorescent waste products in BD versus control hiPSC-RPE (red: autofluorescence, far red (pseudo-colored green): ZO-1; scale bar = 10 µm). (C) The quantification of autofluorescence levels in BD hiPSC-RPE normalized to their respective controls. (D) Representative image of a fluid dome from a control hiPSC-RPE culture at two different focal planes. (E) The quantification of baseline apical to basal net fluid movement in BD and control hiPSC-RPE and hfRPE. (F) The quantification of apical to basal net fluid movement in BD and control hiPSC-RPE and hfRPE after ATP stimulation. *P < 0.05, ***P < 0.001.
BD hiPSC-RPE displays decreased net fluid transport
Another characteristic hallmark of BD is the presence of fluid in the subretinal space, which may reflect reduced apical to basal fluid transport by the RPE. To determine whether this clinical finding could also be modeled in vitro, we grew BD and control hiPSC-RPE on non-porous plastic surfaces and transwell inserts. Cultured, polarized RPE monolayers are known to support vectorial ion and fluid transport, which results in the formation of fluid-filled domes when the cells are grown on non-porous supports (40). Under these conditions, control hiPSC-RPE cultures consistently generated numerous fluid-filled domes, as opposed to BD hiPSC-RPE cultures, which displayed them infrequently (Fig. 3D). To quantify vectorial fluid transport in these cultures, we measured the rate of fluid flow across hiPSC-RPE monolayers on transwell inserts. At baseline, BD hiPSC-RPE cultures demonstrated decreased rates of fluid flow compared with matched control hiPSC-RPE, but this difference reached significance only for the N296H BD versus control pair (Ctrl-1: 1.46 ± 0.10 versus A146K: 1.29 ± 0.10, P = 0.23; Ctr-2: 2.19 ± 0.10 versus N296H: 1.09 ± 0.13, P < 0.0001) (Fig. 3E). However, upon stimulation with exogenous ATP, a molecule known to stimulate fluid flow (41,42) that is also endogenously secreted at low levels by hiPSC-RPE (Supplementary Material, Fig. S2), the differences in fluid transport rates between both pairs of BD and control hiPSC-RPE cultures achieved statistical significance (Ctrl-1: 20.58 ± 1.60 versus A146K: 7.96 ± 1.14, P < 0.0005; Ctr-2: 20.29 ± 3.06 versus N296H: 11.26 ± 2.67, P < 0.05) (Fig. 3F). hfRPE served as an additional reference for both the baseline (1.73 ± 0.12; Fig. 3E) and ATP-stimulated (24.58 ± 3.90; Fig. 3F) fluid transport measurements. Since TER measurements were equivalent among all cultures, these results reveal a defect in transcellular fluid flow in BD hiPSC-RPE, consistent with the buildup of fluid between the neural retina and RPE that is observed in BD patients.
Delayed degradation of POS by BD hiPSC-RPE
After establishing a clinically relevant phenotype for the BD hiPSC-RPE model system, we utilized it to investigate disease mechanism. An excessive accumulation of autoflourescent POS waste products in the macula of BD patients and BD hiPSC-RPE implicates defective POS processing by RPE, although direct evidence for such a defect is missing. Therefore, we compared the capacity of BD hiPSC-RPE to phagocytose and degrade POS with that of matched control hiPSC-RPE. Mature hiPSC-RPE monolayers with robust TERs were fed unlabeled POS and analyzed via western blot to determine the time course of RHODOPSIN degradation (Fig. 4A and B). In the absence of POS, RHODOPSIN was not detected in BD or control hiPSC-RPE cultures. No consistent difference in the uptake of POS was seen between BD and control hiPSC-RPE cultures (Fig. 4B). However, RHODOPSIN degradation was always delayed in BD hiPSC-RPE compared with matched control cultures both at standard levels of POS feeding (20/cell) and when cells were overfed (50 POS/cell).
Figure 4.

Delayed POS degradation by BD hiPSC-RPE. (A) Schematic depicting the protocol utilized to evaluate RHODOPSIN degradation in hiPSC-RPE after unlabeled POS feeding. Measurements were made at 0, 4, 24, 48 and 120 h after washing. (B) Western blot analysis showed that RHODOPSIN degradation was delayed in BD versus matched control hiPSC-RPE after incubation with either 20 or 50 POS/RPE cell. (C) Schematic showing the protocol used to monitor the elimination of FITC-labeled POS in hiPSC-RPE cultures. Measurements were made at 4 and 24 h after washing. (D) The quantification of FACS analysis for FITC-labeled hiPSC-RPE cells in BD cultures at 4 h or 24 h after feeding 20 POS/RPE cell. (E) The quantification of FACS analysis for FITC-labeled hiPSC-RPE cells in BD cultures at 4 h or 24 h after feeding 50 POS/RPE cell. Data in D and E are expressed relative to matched sibling controls, and red dotted lines indicate normalized control levels. *P < 0.05, **P < 0.01.
To investigate POS handling using a second, independent method, hiPSC-RPE cultures were fed FITC-POS, followed by the quantification of FITC cell labeling by FACS (Fig. 4C–E). Under standard (20 POS/cell) feeding conditions, significantly more FITC-labeled cells were present in BD hiPSC-RPE cultures relative to control cultures at the 4 h time point (A146K: 1.44 ± 0.11, P < 0.01; N296H: 1.80 ± 0.18, P < 0.01) (Fig. 4D). However, this difference dissipated by the 24 h time point (A146K: 1.30 ± 0.24, P = 0.24; N296H: 0.98 ± 0.16 P = 0.92), suggesting that although BD hiPSC-RPE cultures degraded POS slower than controls, they ultimately could handle a 20 POS/cell load within a 24 h time window. In contrast, when hiPSC-RPE cultures were overfed with 50 POS/cell, a greater number of FITC-labeled cells were present in BD hiPSC-RPE cultures relative to control cultures at 24 h (A146K: 2.56 ± 0.61, P < 0.05; N296H: 2.27 ± 0.45, P < 0.05), but not 4 h (A146K: 0.97 ± 0.06, P = 0.63; N296H: 1.37 ± 0.45, P = 0.46) (Fig. 4E). Thus, control hiPSC-RPE was more efficient at degrading excess POS than matched BD hiPSC-RPE, confirming a relative deficiency in POS degradation by BD hiPSC-RPE. Altogether, these experiments provide the first evidence that BEST1 mutations in RPE lead to reduced clearance of POS.
Similar expression and localization of BEST1 protein in BD and control hiPSC-RPE
The pathophysiological effects of BEST1 mutations could result from the loss of BEST1 protein expression, mislocalization of expressed BEST1 or dysfunction of correctly localized BEST1. To examine BEST1 expression in our hiPSC model, we cultured BD and control hiPSC-RPE on transwell inserts until all monolayers displayed characteristic morphology and pigmentation and robust TER measurements (≥2 months). Overall levels of BEST1 mRNA and protein were similar in BD and control cultures (Fig. 2E and F). Furthermore, protein localization and cellular polarization were indistinguishable between BD and control hiPSC-RPE, with BEST1 found predominantly near the basolateral membrane, MITF within the nucleus and EZRIN at the apical membrane (Fig. 5A). We also evaluated the localization of overexpressed wild-type (WT) and N296H mutant BEST1 in hfRPE cultures using lentiviral constructs. Similar to endogenous WT and mutant BEST1 in hiPSC-RPE, localization of equivalently overexpressed WT and N296H BEST1 did not differ in hfRPE cultures (Fig. 5B and C). Given the comparable expression levels and localization patterns of WT and mutant BEST1 in all of these RPE culture systems, we concluded that BD most likely results from BEST1 dysfunction, rather than disrupted BEST1 protein translation and/or trafficking.
Figure 5.

BEST1 expression and localization are similar between BD and control hiPSC-RPE. (A) Immunocytochemistry for BEST1 (green) and MITF (red, upper panels) or EZRIN (red, lower panels) in a matched pair of BD and control hiPSC-RPE. (B) Western analysis for BEST1 in hfRPE cultures overexpressing wild-type (Lenti-WT) or mutant (Lenti-N296H) BEST1 compared with BEST1 levels in uninfected hfRPE. ACTIN was used as a loading control. (C) Immunocytochemistry demonstrating similar localization of overexpressed WT and N296H BEST1 in hfRPE and endogenous BEST1 in uninfected control hfRPE. (D) Subcellular fractionation of hfRPE and BD and control hiPSC-RPE after 40 000 g centrifugation, followed by western analysis for BEST1, the ER protein STIM1 and the plasma membrane protein Na+/K+ ATPase. P, pellet fraction; S, supernatant fraction. (E) Differential centrifugation followed by western analysis for BEST1. P, pellet fraction after 3000g centrifugation; P1, pellet fraction after 12 000 g centrifugation; P2: pellet and S2: supernatant fractions after 100 000 g centrifugation. (F) Immunocytochemistry for BEST1 (green) or the ER marker CALNEXIN (red) in both BD and control hiPSC-RPE (blue: nuclei). (G) Immunocytochemistry for BEST1 (green), CALNEXIN (red), or nuclei (blue) in control uninfected hfRPE (left panel), hfRPE overexpressing WT (Lenti-WT) BEST1 (center panel) or hfRPE overexpressing mutant (Lenti-N296H) BEST1 (right panel). Scale bars: A, C, F, G = 10 µm.
BEST1 is present in the microsomal and cytoplasmic fractions of hiPSC-RPE and hfRPE
The function of BEST1, and therefore the dysfunction caused by BEST1 mutations, can be inferred in part by its subcellular compartmentalization. Based largely on information obtained from heterologous overexpression systems, BEST1 has been postulated to play a number of different roles, including a chloride transporter in the basolateral membrane and a calcium sensor in the ER (28,31–38). However, overexpression of BEST1, particularly in cell lines where it is not normally found, can lead to spurious protein interactions and mislocalization. To narrow the list of possible functions of BEST1, we sought to determine the subcellular compartment(s) containing endogenously expressed BEST1 in hiPSC-RPE and hfRPE. Using differential centrifugation, we predominantly observed BEST1 in fractions containing microsomal (i.e. ER) and cytoplasmic proteins, as opposed to fractions containing proteins from the plasma membrane or other subcellular compartments (Fig. 5D and E). In addition, the ER protein STIM1, but not the plasma membrane protein Na+/K+ ATPase, co-partitioned with BEST1 (Fig. 5D). Combined with our ICC data (Fig. 5A), these results suggest that BEST1 is localized near, but not within, the basolateral RPE membrane. The presence of BEST1 in the ER was further supported by partial co-localization of BEST1 with the ER marker CALNEXIN in both BD and control hiPSC-RPE (Fig. 5F), as well as in uninfected and lenti-BEST1 expressing hfRPE (Fig. 5G). Thus, multiple lines of evidence from this study point toward a role for BEST1 in ER physiology.
Altered calcium homeostasis in BD hiPSC-RPE
Localization of BEST1 to the ER in hiPSC-RPE and hfRPE, as well as evidence from previous reports suggesting a role for BEST1 in ER-mediated calcium release and/or uptake (35,36), prompted us to evaluate cellular calcium homeostasis in BD and control hiPSC-RPE. Fura-2 ratiometric calcium imaging did not demonstrate differences in baseline [Ca2+]i between BD and control cultures or hfRPE (Ctr-1: 98.46 ± 19.64, A146K: 92.15 ± 13.39, P = 0.79; Ctr-2: 96.20 ± 19.64, N296H: 100.39 ± 18.63, P = 0.89; hfRPE: 98.34 ± 17.40) (Fig. 6A). However, when ER calcium release was stimulated with ATP, a ligand for the apical RPE G-protein coupled receptor (GPCR) P2Y (41), transient [Ca2+]i in BD hiPSC-RPE was significantly higher than in control hiPSC-RPE (A146K: 3.51 ± 0.47 fold, P < 0.01; N296H: 1.71 ± 0.33 fold, P < 0.05) (Fig. 6B and C). In addition, time required to reach peak [Ca2+]i was accelerated, whereas time required to return to baseline [Ca2+]i was delayed, following ATP stimulation in BD versus control hiPSC-RPE (normalized time to peak [Ca2+]i: Ctr-1: 1.00 ± 0.01 versus A146K: 0.67 ± 0.06, P < 0.0001; Ctr-2: 1.00 ± 0.06 versus N296H: 0.52 ± 0.04, P < 0.0001; normalized time to return to baseline from peak [Ca2+]i: Ctr-1: 1.00 ± 0.06 versus A146K: 1.76 ± 0.31, P < 0.05; Ctr-2: 1.00 ± 0.04 versus N296H: 3.70 ± 0.31, P < 0.0001) (Fig. 6D and E). Interestingly, overexpression of WT BEST1 in hfRPE also increased peak [Ca2+]i levels after ATP stimulation relative to uninfected hfRPE (1.53 ± 0.25, P = 0.08), although this increase was significantly more pronounced in hfRPE cultures overexpressing N296H mutant BEST1 (2.24 ± 0.36, P < 0.05) (Fig. 6F and G). These results are consistent with a gain-of-function mechanism for mutant BEST1 in BD.
Figure 6.

Altered calcium homeostasis in BD hiPSC-RPE. (A) Baseline [Ca2+]i in paired control and BD hiPSC-RPE, with hfRPE levels included as a reference. (B) Representative traces from ATP-stimulated cultures of control hiPSC-RPE cell (black trace) or A146K BD hiPSC-RPE cell (red trace). (C) Peak ATP-induced calcium responses for A146K and N296H hiPSC-RPE, normalized to their respective control hiPSC-RPE (average of 15–20 cells per line). (D and E) After ATP stimulation, peak [Ca2+]i was reached faster in BD versus control hiPSC-RPE (D), whereas the time to return to baseline [Ca2+]i was delayed in BD versus control cultures (E). (F and G) Overexpression of WT or N296H BEST1 in hfRPE resulted in an increase in ATP-induced Ca2+ release, although the increase was greater in cultures overexpressing N296H BEST1. *P < 0.05, **P < 0.01, ***P < 0.001.
To further investigate the potential for BEST1 to modulate ER calcium release and reuptake, we looked for interactions between BEST1 and STIM1, a protein involved in the regulation of ER calcium stores. STIM1 was present in the microsomal fraction of all hiPSC-RPE cultures (Fig. 5D) and co-immunoprecipitated with BEST1 (Supplementary Material, Fig. S3), consistent with previous data obtained using a heterologous expression system (35). Therefore, multiple lines of evidence link BEST1 to ER-mediated calcium homeostasis in cultured human RPE. Furthermore, since calcium signaling plays a key role in numerous RPE functions, including fluid transport and protein degradation, perturbation of [Ca2+]i transients due to BEST1 dysfunction is a potential contributor to the pathogenesis of BD.
Increased oxidative stress in BD hiPSC-RPE after long-term POS feeding
Cellular oxidative stress is a common and highly detrimental component of many diseases, including those affecting the retina (42,43). Based on our observations of defective POS handling and altered calcium homeostasis in BD hiPSC-RPE cultures, we suspected that BEST1 dysfunction might predispose RPE to enhanced oxidative stress. BD and control hiPSC-RPE monolayer cultures were fed 50 POS/cell for 2 weeks, followed by quantitative RT–PCR analysis to determine expression levels of genes involved in modulating cellular reactive oxygen species (GPX1, SOD2) and iron homeostasis (TRF, TRFR). Prior to POS feeding, no significant differences in the expression levels of these genes were present between BD and control hiPSC-RPE, with the exception of an increase in GPX1 expression seen in A146K versus Ctr-1 cultures (Supplementary Material, Table S1 and Fig. 7A). However, after long-term POS feeding, the expression of nearly all of these genes was substantially reduced in A146K and N296H BD hiPSC-RPE (Supplementary Material, Table S1 and Fig. 7B), indicative of increased oxidative stress in the BD cultures. In contrast, expression levels of genes known specifically to mediate ER stress were not altered with POS feeding (Supplementary Material, Fig. S4A and B). Thus, BEST1 mutations lead to increased oxidative, but not ER, stress in hiPSC-RPE following long-term POS challenge, in keeping with the deficiencies in POS degradation and the subsequent build-up of autoflourescent waste products described earlier in this report.
Figure 7.
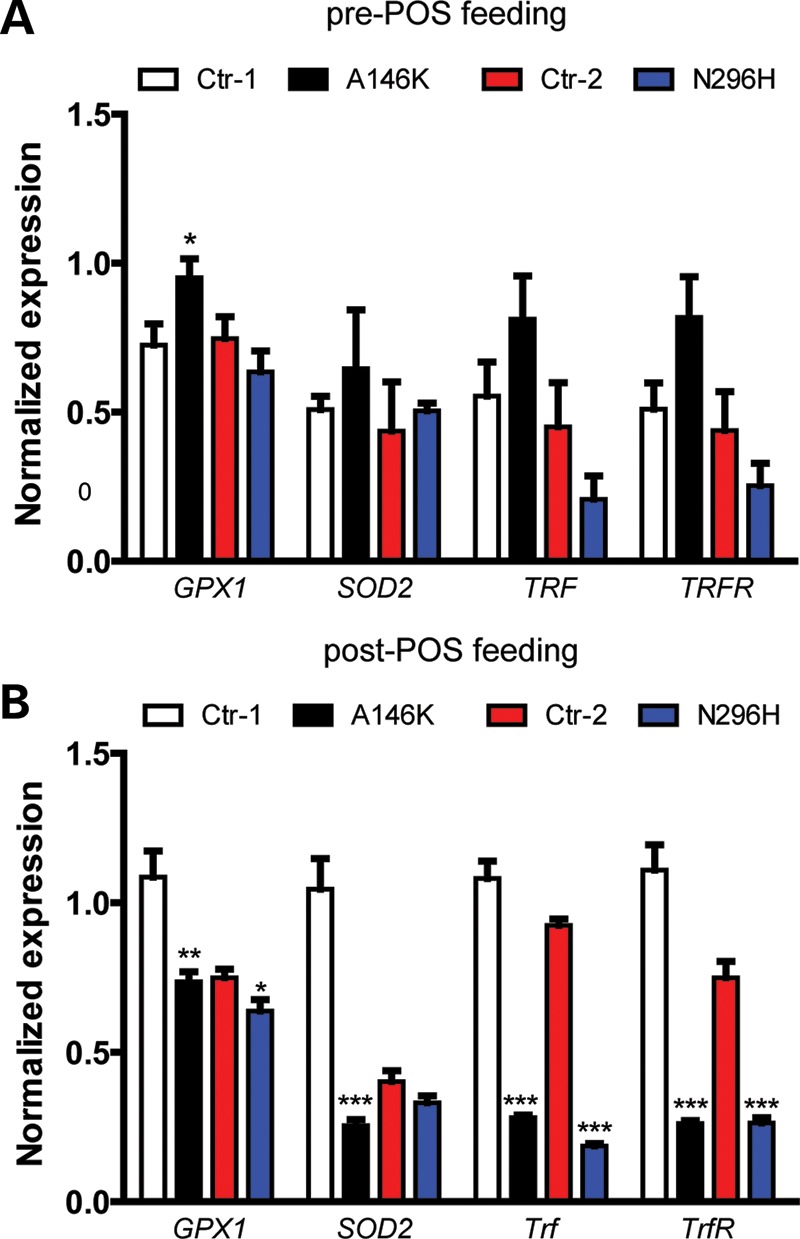
Chronic POS feeding leads to increased oxidative stress in BD hiPSC-RPE. Relative expression of oxidative stress genes (normalized to GAPDH) in control or BD hiPSC-RPE as determined by RT–qPCR before (A) and after (B) 1 month of chronic POS feeding (50 POS/RPE cell). *P < 0.05, **P < 0.01, ***P < 0.001.
DISCUSSION
hiPSC technology offers a potentially useful tool to evaluate the cellular effects of gene mutations, provided an appropriate phenotype can be recapitulated in vitro. In this study, we describe a hiPSC model of BD that possesses functional deficiencies consistent with the clinical features of the disease, and in turn provides a platform to investigate its pathophysiological mechanism. We chose to focus on an RPE-based disorder since hiPSC-RPE can be isolated, expanded, re-seeded and closely monitored both morphologically and functionally prior to testing (14,44). As such, concerns regarding variability in efficiency and timing of differentiation between hiPSC lines were minimized. In addition, unlike many human cell types, RPE has a well-described culture standard (hfRPE), which served as an experimental control. We also used patient:sibling pairs from families with different BEST1 mutations, and grew each pair in parallel from identically passaged lines. Finally, for select experiments, we transduced hfRPE with mutant or WT lenti-BEST1, providing an identical background upon which to evaluate the effects of protein overexpression.
Relative to hiPSC-RPE from unaffected siblings, BD hiPSC-RPE displayed impaired fluid transport and delayed degradation of POS, both of which could contribute to the increase in autofluorescent material and oxidative stress levels found in BD cultures after long-term POS feeding. Cellular fractionation, co-localization and co-immunoprecipitation experiments in hiPSC-RPE and hfRPE subsequently pointed toward a role for BEST1 in ER physiology as a regulator of calcium release and/or uptake, a theory that has recently gained support (35,36). Indeed, when compared with their respective controls, BD hiPSC-RPE (and hfRPE transduced with mutant lenti-BEST1) exhibited altered ER-dependent calcium transients in response to ATP-induced GPCR activation. Given that GPCR-responsive ER calcium signaling influences numerous processes that occur in RPE, including fluid transport and phagosome formation (41,45), it is plausible that disturbed calcium homeostasis plays a key role in the pathogenesis of BD, although other physiological effects of BEST1 mutations are possible that could contribute to the disease mechanism as well. Of additional note, overexpression of WT BEST1 in hfRPE yielded similar, albeit much less dramatic, effects on calcium transients as mutant BEST1, in accordance with a gain of function mechanism for BD (46).
Interestingly, BD and control hiPSC-RPE did not differ significantly in the majority of the baseline functional parameters we measured; rather, a physiological challenge such as long-term POS feeding or GPCR activation was necessary to reveal dissimilarities. This is not surprising given the natural course of the disease and its clinical and histological findings. The vitelliform lesion in patients with BD often takes years to develop, and even then, affected individuals can retain decent visual function until late in life (47,48). In addition, examination of post-mortem eyes has demonstrated relatively preserved macular RPE in cases of late stage disease (49,50). Thus, BEST1 mutations are not immediately catastrophic to RPE cells or to the photoreceptors they subserve, suggesting that BD is caused by the cumulative effects of one or more subtle disruptions in RPE physiology.
Further insight into the capacity for RPE cells to withstand the presence of dysfunctional BEST1 can be drawn from the frequent lack of peripheral retinal findings in BD. Despite the fact that mutant BEST1 is expressed in every RPE cell in BD, with few exceptions only those within the macula display pathology over time. Therefore, for the majority of RPE cells in the retina, autosomal dominant mutations in BEST1 are of little or no consequence. Potential explanations for this contrast in phenotype between the central and peripheral retina in BD include regional differences in the RPE itself or unique environmental stresses imposed upon macular RPE. Although there is some evidence to suggest that human pluripotent stem cell-derived RPE cells possess features more akin to macular than peripheral retina (51), it is unlikely that our hiPSC-RPE cultures mimic the macula per se. Even so, our results show that a clinical phenotype associated with an inherited maculopathy can be modeled with hiPSC-RPE. Whether hiPSCs can also be used to model acquired RPE-based maculopathies such as age-related macular degeneration (AMD) remains to be determined. However, AMD and BD are both associated with the accumulation of autofluorescent material (52,53) and altered expression of genes involved in iron-mediated oxidative stress (Trf and TrfR) (54,55). Therefore, the methods we employed to elicit a disease phenotype in BD hiPSC-RPE may well be useful in the development of AMD culture models.
An anticipated benefit of hiPSC modeling is the opportunity to examine the biological effects of human gene mutations in a relatively expeditious manner. This is particularly important for inherited RDDs, which are caused by defects in over 180 different genes, and whose disease mechanisms are largely unknown or unclear (https://sph.uth.tmc.edu/retnet/disease.htm). In addition, many RDDs, including BD, can result from a host of distinct mutations in the same gene, further contributing to their genotypic and phenotypic heterogeneity (56,57). While the present study utilized hiPSCs from two families carrying mutations in separate regions of BEST1, our aim was to uncover shared differences in BD hiPSC-RPE cultures relative to their sibling controls. Therefore, no conclusions were drawn between the A146K and N296H BEST1 hiPSC lines. Future studies are necessary to determine whether hiPSCs will be useful for investigating genotype–phenotype differences observed in BD and other inherited diseases.
Ultimately, knowledge of the molecular pathways affected by BEST1 mutations in hiPSC-RPE should aid the development and assessment of pharmacological and gene therapies to slow, halt or reverse BD. For example, mechanistic evidence from this study, combined with that of others (35,36), points toward modulators of intracellular calcium signaling as a promising category of compounds to treat BD. In addition, the consistency, purity and expandability of hiPSC-RPE make it a valuable tool to screen and test drugs and other therapeutics. Once a promising therapy is identified, the relatively slow clinical course of BD and preservation of RPE until late stages of disease offers ample opportunity to intervene before cell replacement becomes necessary. In this manner, hiPSC-RPE model systems can aid efforts to improve the visual health of BD patients.
MATERIALS AND METHODS
Maintenance and differentiation of hiPSC lines
hiPSC lines derived from two patients with BD and one unaffected sibling per patient were maintained in hiPSC medium using previously established methods (5,13,16). Briefly, hiPSCs were grown on MEF feeder layers in iPS cell medium containing DMEM/F12 (1:1), 20% KOSR, 1% MEM non-essential amino acids, 100 ng/ml bFGF, 1 mm l-glutamine and 0.1 mm β-ME. Morphologically identifiable differentiated cells were mechanically removed, and cells were passaged every 5–6 days. hiPSCs were differentiated to RPE according to our previously established protocol (5,16). Briefly, hiPSC colonies were lifted from MEF feeder layers with dispase (1 mg/ml) and grown as EBs for 4 days in EB medium containing DMEM/F12 (1:1), 20% KOSR, 1% MEM non-essential amino acids, 1 mm l-glutamine and 0.1 mm β-ME. At Day 5, EB medium was switched to neural induction medium (NIM) containing DMEM/F12 (1:1), 1% N2 supplement, MEM non-essential amino acids and 2 µg/ml heparin. At Day 7, suspended EB aggregates were plated onto laminin-coated culture plates to allow them to reattach to the culture plate, whereupon they were grown for an additional 10 days in NIM. At Day 16, NIM medium was replaced with RDM containing DMEM/F12 (3:1), 2% B27 supplement (without retinoic acid), MEM non-essential amino acids and penicillin/streptomycin. The cells were maintained as adherent cultures in RDM until the appearance of pigmented RPE cells. Large patches of pigmented RPE cells were micro-dissected, dissociated with trypsin-EDTA (0.05%) and plated onto laminin-coated transwell inserts (Corning Costar, 3460-Clear, 0.4 mm pores, 12 mm inner diameter, polyester membranes). RPE cells on transwells were cultured with RDM + 10% FBS for 2 days and then switched to RDM + 2% FBS until the cells became confluent. Thereafter, RPE cells were maintained in RDM to allow them to form compact monolayers and re-pigment, typically 60–90 days.
Measurement of transepithelial resistance
TERs of confluent, pigmented RPE monolayers cultured on permeable transwell filters were measured using an epithelial voltohmmeter (EVOM2) (World Precision Instruments, Sarasota, USA) according to manufacturer's instructions (39). Briefly, electrodes were sterilized with 70% ethanol and rinsed in Hank's balanced salt solution prior to placement in the transwell inserts. Net TER was calculated by subtracting the background measurement obtained from cell-free, laminin-coated transwell filters and then multiplying the difference by the area of the transwell filter to obtain values in Ω*cm2.
Immunocytochemistry
Cells were washed in ice-cold PBS and fixed in 2–4% paraformaldehyde at 4°C for 30 min. Fixed cells were washed twice in PBS and placed in blocking solution (10% normal donkey or goat serum and 0.01–0.05% Triton-X100 in PBS) for 1 h at room temperature. Cells were then incubated overnight at 4°C with one of the following primary antibodies: goat anti-NANOG (1:100, R&D systems), goat anti-OCT4 (1:1000, Santa Cruz), mouse anti-SSEA4 (1:500, Chemicon), mouse anti-TRA-1-81 (1:1000, Chemicon), mouse anti-BEST1 (1:100, Chemicon), rabbit anti-EZRIN (1:100, Cell Signaling), rabbit anti-ZO1 (1:100 Zymed) or rabbit anti-CALNEXIN (1:200, Abcam). The following day, cells were washed three to five times in PBS with 0.01% Triton-X100 and incubated with an appropriate Alexa-labeled secondary antibody (1:500, Invitrogen). After secondary antibody incubation, cells were stained with DAPI (1:500), washed three times in PBS with 0.2% Triton-X100, mounted using prolong gold (Invitrogen) and imaged on a confocal microscope (Nikon C1, Nikon Instruments, Inc., NY, USA).
Transmission electron microscopy
RPE cells were fixed with 2% glutaraldehyde and 4% formaldehyde in 0.1 M cacodylate buffer (pH 7.4), rinsed with 0.1 M cacodylate buffer, osmicated (1% osmium tetroxide) for 1 h, dehydrated through an ascending series of ethanol and propylene oxide washes and then embedded in Epon [25 g Epon 812, 13 g dodecenyl succinic anhydride, 12 g nadic methyl anhydride and 1 ml 2,4,6-tris (dimethylaminomethyl) phenol (DMP-30), electron microscopy sciences]. Ultra-thin sections were cut and stained with uranyl acetate and lead citrate at the electron microscopy facility of the University of Wisconsin-Madison. Sections were imaged on a Philips CM120 Scanning Transmission Electron Microscope.
RT–PCR and quantitative RT–PCR
Total RNA was extracted using the RNeasy Mini Plus Kit (Qiagen) and treated with DNase1 to remove any genomic DNA contamination. cDNA was synthesized using the iScript cDNA Synthesis Kit (Bio-Rad, Hercules, CA, USA), and PCR (30 cycles) was performed using gene-specific primers (Supplementary Material, Table S2 and S3) and GoTaq PCR master mix (Promega). Thereafter, PCR products were analyzed on 2% agarose gels. Quantitative RT–PCR (qPCR) experiments (40 cycles) were carried out using SsoAdvanced™ SYBR® Green Supermix (Bio-Rad) and a Bio-Rad C1000 thermal cycler, and results were analyzed using Bio-Rad CFX software and Microsoft Excel.
Preparation of bovine photoreceptor outer segments (POS)
Bovine retina was dissected under dim red light from fresh bovine eyes. Bovine POSs were isolated by placing bovine retina over a 25–60% continuous sucrose gradient prepared in buffer containing 20 mm tris acetate, 5 mm taurine and 10 mm glucose, followed by centrifugation at 100 000 g for 50 min at 4°C. The layer containing POS was collected and washed in buffer containing 20 mm tris acetate and 5 mm taurine, suspended in 5 ml DMEM, aliquoted and stored at −80°C. To label POS with FITC, POSs were suspended in solution containing 10% sucrose, 20 mm sodium phosphate, and 5 mm taurine, and incubated at 4°C overnight with FITC isomer 1 (0.4 mg/ml, F-1907, Invitrogen). The next day, FITC-labeled POS were washed in buffer containing 10% sucrose, 20 mm sodium phosphate and 5 mm taurine, suspended in DMEM, aliquoted and stored at −80°C until further use.
Phagocytosis assays
RPE cells grown as monolayers on 96-well plates or transwell inserts that had attained proper morphology, pigmentation and TER measurements were used for phagocytosis assays. Two different assays were employed to evaluate phagocytosis and degradation of POS by hiPSC-RPE. In the first assay, RPE cells were fed either 20 or 50 unlabeled POS per RPE cell for 2 h, whereupon RPE cells were washed four to five times with PBS by vigorous pipetting to remove any POS that had not been phagocytosed by the RPE (designated as the 0 h time point). RPE cells were then collected at 0, 4, 24, 48 and 120 h post-POS feeding, each collection being preceded by two additional washes with PBS. Protein isolated from harvested RPE at these time points was analyzed via western blot to determine the time course of RHODOPSIN degradation. Unfed RPE cultures served as controls for these experiments. In the second phagocytosis assay, RPE cells were fed FITC-labeled POS (20 or 50 POS/RPE cell) for 2 h and then washed vigorously four times with PBS. Thereafter, RPE cells were collected 4 and 24 h post-POS feeding and subjected to FACS analysis to determine the number FITC-labeled RPE cells remaining. To evaluate autofluorescence after long-term POS feeding, RPE cells were incubated daily with unlabeled POS (50/RPE cell) for 3.5 months, followed by a 2-week post-feeding period where the cells were washed daily with culture medium in the absence of POS. RPE cells were then fixed with 4% paraformaldehyde and imaged with a Nikon 80i laser scanning confocal microscope (Nikon Corp., Tokyo, Japan). The total amount of retained autofluorescent material was determined in both the red (546) and green (488) channels (58) by quantifying the pixel area (Adobe Photoshop/Image J software), and data for BD hiPSC-RPE were expressed as normalized autofluorescence relative to sibling control hiPSC-RPE.
Measurement of fluid flux
Confluent BD and control hiPSC-RPE monolayers grown on transwell inserts that had attained appropriate morphology, pigmentation and TER were used for fluid flux measurements. The protocol used for the quantification of active apical to basal fluid transport in RPE was previously described (59). For baseline measurements, a fixed amount of medium was placed in the apical (150 µl) and basal (400 µl) chambers of each transwell. The amount of fluid remaining in the apical chamber was measured 20 h later using an analytical balance, and the rate of fluid transport was calculated (µl/h/cm2). To measure fluid flux after ATP stimulation, RPE cells were incubated for 2 h with RDM in the basal chamber and RDM + 100 µm ATP in the apical chamber; thereafter, the amount of fluid remaining in the apical chamber was quantified as described above.
FACS analysis
RPE cells fed with FITC-labeled POS were gently dissociated with trypsin, suspended in FACS buffer (PBS + 2% FBS) and sorted using a FACSCaliber machine (Beckton Dickenson, Franklin Lakes, NJ, USA). Cells that were not fed FITC-labeled POS were used as a negative control. Data obtained after cell sorting were analyzed with the CellQuest Pro software (Becton Dickinson).
Subcellular fractionation
RPE cells were collected after trypsinization, washed twice in ice-cold PBS, centrifuged at 600g to remove any cellular debris and placed in hypotonic extraction buffer (Cat # H8412, Sigma, St Louis, MO, USA) for 20 min at 4°C. Thereafter, cells were briefly centrifuged and the hypotonic extraction buffer was removed. Cells were then washed once in PBS, suspended in an isotonic buffer (I3533, Sigma) and homogenized by passing them through a 4-inch, 20-gauge syringe 15–20 times. In one set of experiments, the resulting lysate was centrifuged at 40 000g for 30 min using a TL-100 ultracentrifuge (Beckman Coulter, Indianapolis, IN, USA). The resulting pellet (P) fraction contained plasma membrane, mitochondrial, lysosomal and nuclear proteins, whereas the supernatant (S) fraction contained cytosolic and microsomal (i.e. ER) proteins.
For a second set of experiments, the initial lysate was centrifuged for 10 min at 3000g to obtain a pellet fraction (P) containing nuclear components and plasma membrane sheets. The supernatant was then centrifuged an additional 15 min at 12 000 g to obtain the P1 pellet fraction containing lysosomal and mitochondrial proteins, as well as any remaining plasma membrane proteins. The supernatant obtained following this step was further ultracentrifuged for 60 min at 100 000 g to obtain the P2 pellet fraction that mainly contained microsomal proteins. All pellet fractions were lysed in isotonic buffer to extract protein. The S2 supernatant fraction obtained following this final centrifugation step contained cytoplasmic vesicles and cytosolic proteins. Prior to western analysis, proteins present in all pellet fractions were extracted in isotonic buffer, whereas those contained in the S2 fraction were concentrated using Amicon 10 kDa concentrators (EMD Millipore, Billerica, MA, USA).
Immunoprecipitation
RPE cells were lysed in IP lysis buffer (Cat# 87787, Pierce) containing protease inhibitor (PI; 1:1000, P8340, Sigma). Protein A/G agarose beads (Cat#20421, Pierce, Rockford, IL, USA) were added to protein lysates followed by incubation on ice for 15–45 min. This mixture was then briefly centrifuged and the resulting supernatant (pre-cleared lysate) was transferred to a fresh Eppendorf tube. Primary antibody against BEST1 or STIM1 (2.5–10 µg) was added to the cold pre-cleared lysate and placed on a shaker overnight at 4°C. The antibody-lysate mixture was then incubated with protein A/G beads for 1–2 h at room temperature on a shaker. Thereafter, the mixture was spun at 10 000g for 30 s, the supernatant was removed and the beads were washed four times in immunprecipitation buffer. 50 µl of 1 × Laemelli buffer (Cat# 161–0737, Bio-Rad) containing 5% β-mercaptoethanol (Sigma) was then added to the bead pellet and the sample was vortexed and heated at 99°C for 10 min, followed by centrifugation at 10 000g for 5 min. The supernatant was collected in a fresh Eppendorf tube and used for western blotting.
Western blot analysis
RPE cells were lysed in RIPA buffer (Cat# 89900, Pierce) containing a protease inhibitor cocktail (Sigma), and total protein was quantified using a Bio-Rad DC protein assay (Cat # 500–0116). Protein lysates were denatured by adding 1× Laemelli + 5% β-mercaptoethanol buffer. Depending on the protein being analyzed, the resulting sample was either kept at room temperature for 10 min or incubated at 99°C for 10 min. Protein samples (10–30 µg) were then separated on a 4–20% Tris–Cl gradient gel (Bio-Rad), electroblotted onto a PVDF-licor membrane (Millipore) and stained with Ponceau red to confirm transfer. Membranes were incubated in blocking buffer (Cat# 927–40000, Licor Biosciences, Lincoln, Nebraska) for 45 min to 1 h at room temperature, washed twice in PBS + 0.1% Tween for 5 min and incubated with primary antibody in blocking buffer overnight at 4°C. Thereafter, blots were washed four times in PBS + 0.1% Tween and incubated with secondary antibody in blocking buffer for 1 h at room temperature. Blots were washed another four times and protein bands were visualized using the Odyssey Infrared Imager (Licor). Primary antibodies against the following proteins were used for western blots: RPE65 (mouse monoclonal, 1:2000; Chemicon), BEST1 (mouse monoclonal, 1:500; Chemicon), CRALBP (mouse monoclonal, 1:50 000, gift of John Saari, University of Washington, Seattle), EZRIN (rabbit polyclonal, 1:1000; Cell Signaling Technologies, Danvers, MA, USA), OCCLUDIN (rabbit polyclonal, 1:250; Zymed, Carlsbad, CA, USA), CLAUDIN-10 (rabbit polyclonal, 1:250; Zymed), RHODOPSIN (mouse monoclonal, 1:500; Millipore), STIM1 (mouse monoclonal, 1:200; BD biosciences, Sparks, MD, USA) and ACTIN (goat polyclonal, 1:750, Santa Cruz Biotechnology, Santa Cruz, CA, USA). Mouse, rabbit and goat secondary antibodies were obtained from Licor and used at a concentration of 1:15000.
Calcium imaging
RPE cells grown on coverslips were incubated with 10 µm Fura-2-AM (Calbiochem, San Diego, CA, USA) and 0.02% Pluronic F127 (BASF, Mount Olive, NJ, USA) for 1 h at 37°C. Cells were subsequently washed for 30 min and placed in a recording chamber on an inverted microscope (Nikon Eclipse Ti, Nikon). The cell loading and recording solution contained 1 mm probenecid to prevent dye leakage and 500 µm glutathione to reduce the level of cellular stress. Fura-2-AM emission ratios at 510 nm were obtained with alternating exposures at 340 and 380 nm, and fluorescence images were acquired every 2 s using a Photometrics Cascade 512B camera. Calcium imaging data were analyzed using Metamorph software (Indec; Santa Clara, CA, USA) and intracellular calcium concentrations were calculated using in vitro calibration curves generated with Fura-2 standards (Life Technologies, Grand Island, NY, USA).
Measurement of ATP release
RDM was placed in the apical and basal chambers of transwell inserts containing mature, confluent RPE monolayers and 24 h later the medium from each chamber was collected separately. ATP levels within the media samples were determined using a luciferase-based assay (Cat # FF2000, Promega, Madison, WI, USA) following the manufacturer's instructions.
Viral production
WT or N296H mutant coding DNA sequence for the human BEST1 gene was subcloned into pSIN-W-PGK vector (60). Lentiviruses were produced using transient transfection of HEK 293T cells according to a previously described protocol (60).
Statistical analysis
Data were expressed as mean ± standard error and compared using the unpaired Student's t-test. Significance was preset at P < 0.05.
SUPPLEMENTARY MATERIAL
FUNDING
This work was supported by the Macula Vision Research Foundation, the Foundation Fighting Blindness Wynn-Gund Translational Research Award, NIH R01 EY021218, NIH P30 HD03352, the Lincy Foundation, and the Retina Research Foundation.
Supplementary Material
ACKNOWLEDGEMENTS
We thank the patients and their families for donating fibroblasts cells, Roxanne Alvarez and Dr Ian Bird for their help with calcium-imaging experiments. We also thank Dr Shyamanga Borooah (MRC Centre for Regenerative Medicine, University of Edinburgh, Edinburgh, UK) for helping with the preparation of bovine photoreceptor outer segment (POS) and Dr Aparna Lakkaraju (University of Wisconsin, Madison) for her input and advice on POS degradation assays.
Conflict of Interest statement. None declared.
REFERENCES
- 1.Ebert A.D., Yu J., Rose F.F., Jr, Mattis V.B., Lorson C.L., Thomson J.A., Svendsen C.N. Induced pluripotent stem cells from a spinal muscular atrophy patient. Nature. 2009;457:277–280. doi: 10.1038/nature07677. [DOI] [PMC free article] [PubMed] [Google Scholar]
- 2.Gamm D.M., Meyer J.S. Directed differentiation of human induced pluripotent stem cells: a retina perspective. Regen. Med. 2010;5:315–317. doi: 10.2217/rme.10.28. [DOI] [PubMed] [Google Scholar]
- 3.Park I.H., Lerou P.H., Zhao R., Huo H., Daley G.Q. Generation of human-induced pluripotent stem cells. Nat. Protoc. 2008;3:1180–1186. doi: 10.1038/nprot.2008.92. [DOI] [PubMed] [Google Scholar]
- 4.Marchetto M.C., Gage F.H. Modeling brain disease in a dish: really? Cell Stem Cell. 10:642–645. doi: 10.1016/j.stem.2012.05.008. [DOI] [PubMed] [Google Scholar]
- 5.Meyer J.S., Howden S.E., Wallace K.A., Verhoeven A.D., Wright L.S., Capowski E.E., Pinilla I., Martin J.M., Tian S., Stewart R., et al. Optic vesicle-like structures derived from human pluripotent stem cells facilitate a customized approach to retinal disease treatment. Stem Cells. 2011;29:1206–1218. doi: 10.1002/stem.674. [DOI] [PMC free article] [PubMed] [Google Scholar]
- 6.Tiscornia G., Vivas E.L., Izpisua Belmonte J.C. Diseases in a dish: modeling human genetic disorders using induced pluripotent cells. Nat. Med. 17:1570–1576. doi: 10.1038/nm.2504. [DOI] [PubMed] [Google Scholar]
- 7.Israel M.A., Yuan S.H., Bardy C., Reyna S.M., Mu Y., Herrera C., Hefferan M.P., Van Gorp S., Nazor K.L., Boscolo F.S., et al. Probing sporadic and familial Alzheimer's disease using induced pluripotent stem cells. Nature. 2012;482:216–220. doi: 10.1038/nature10821. [DOI] [PMC free article] [PubMed] [Google Scholar]
- 8.Itzhaki I., Maizels L., Huber I., Zwi-Dantsis L., Caspi O., Winterstern A., Feldman O., Gepstein A., Arbel G., Hammerman H., et al. Modelling the long QT syndrome with induced pluripotent stem cells. Nature. 2011;471:225–229. doi: 10.1038/nature09747. [DOI] [PubMed] [Google Scholar]
- 9.Maehr R., Chen S., Snitow M., Ludwig T., Yagasaki L., Goland R., Leibel R.L., Melton D.A. Generation of pluripotent stem cells from patients with type 1 diabetes. Proc. Natl Acad. Sci. U S A. 2009;106:15768–15773. doi: 10.1073/pnas.0906894106. [DOI] [PMC free article] [PubMed] [Google Scholar]
- 10.Park I.H., Arora N., Huo H., Maherali N., Ahfeldt T., Shimamura A., Lensch M.W., Cowan C., Hochedlinger K., Daley G.Q. Disease-specific induced pluripotent stem cells. Cell. 2008;134:877–886. doi: 10.1016/j.cell.2008.07.041. [DOI] [PMC free article] [PubMed] [Google Scholar]
- 11.Howden S.E., Gore A., Li Z., Fung H.L., Nisler B.S., Nie J., Chen G., McIntosh B.E., Gulbranson D.R., Diol N.R., et al. Genetic correction and analysis of induced pluripotent stem cells from a patient with gyrate atrophy. Proc. Natl Acad. Sci. U S A. 108:6537–6542. doi: 10.1073/pnas.1103388108. [DOI] [PMC free article] [PubMed] [Google Scholar]
- 12.Kokkinaki M., Sahibzada N., Golestaneh N. Human induced pluripotent stem-derived retinal pigment epithelium (RPE) cells exhibit ion transport, membrane potential, polarized vascular endothelial growth factor secretion, and gene expression pattern similar to native RPE. Stem Cells. 2011;29:825–835. doi: 10.1002/stem.635. [DOI] [PMC free article] [PubMed] [Google Scholar]
- 13.Phillips M.J., Wallace K.A., Dickerson S.J., Miller M.J., Verhoeven A.D., Martin J.M., Wright L.S., Shen W., Capowski E.E., Percin E.F., et al. Blood-derived human iPS cells generate optic vesicle-like structures with the capacity to form retinal laminae and develop synapses. Invest. Ophthalmol. Vis. Sci. 2012;53:2007–2019. doi: 10.1167/iovs.11-9313. [DOI] [PMC free article] [PubMed] [Google Scholar]
- 14.Carr A.J., Vugler A.A., Hikita S.T., Lawrence J.M., Gias C., Chen L.L., Buchholz D.E., Ahmado A., Semo M., Smart M.J., et al. Protective effects of human iPS-derived retinal pigment epithelium cell transplantation in the retinal dystrophic rat. PLoS ONE. 2009;4:e8152. doi: 10.1371/journal.pone.0008152. [DOI] [PMC free article] [PubMed] [Google Scholar]
- 15.Brennand K.J., Simone A., Jou J., Gelboin-Burkhart C., Tran N., Sangar S., Li Y., Mu Y., Chen G., Yu D., et al. Modelling schizophrenia using human induced pluripotent stem cells. Nature. 2011;473:221–225. doi: 10.1038/nature09915. [DOI] [PMC free article] [PubMed] [Google Scholar]
- 16.Meyer J.S., Shearer R.L., Capowski E.E., Wright L.S., Wallace K.A., McMillan E.L., Zhang S.C., Gamm D.M. Modeling early retinal development with human embryonic and induced pluripotent stem cells. Proc. Natl Acad. Sci. U S A. 2009;106:16698–16703. doi: 10.1073/pnas.0905245106. [DOI] [PMC free article] [PubMed] [Google Scholar]
- 17.Rowland T.J., Blaschke A.J., Buchholz D.E., Hikita S.T., Johnson L.V., Clegg D.O. Differentiation of human pluripotent stem cells to retinal pigmented epithelium in defined conditions using purified extracellular matrix proteins. J. Tissue Eng. Regen. Med. 2012 doi: 10.1002/term.1458. [Epub ahead of print] [DOI] [PubMed] [Google Scholar]
- 18.Liao J.L., Yu J., Huang K., Hu J., Diemer T., Ma Z., Dvash T., Yang X.J., Travis G.H., Williams D.S., et al. Molecular signature of primary retinal pigment epithelium and stem-cell-derived RPE cells. Hum. Mol. Genet. 19:4229–4238. doi: 10.1093/hmg/ddq341. [DOI] [PMC free article] [PubMed] [Google Scholar]
- 19.Buchholz D.E., Hikita S.T., Rowland T.J., Friedrich A.M., Hinman C.R., Johnson L.V., Clegg D.O. Derivation of functional retinal pigmented epithelium from induced pluripotent stem cells. Stem Cells. 2009;27:2427–2434. doi: 10.1002/stem.189. [DOI] [PubMed] [Google Scholar]
- 20.Maminishkis A., Chen S., Jalickee S., Banzon T., Shi G., Wang F.E., Ehalt T., Hammer J.A., Miller S.S. Confluent monolayers of cultured human fetal retinal pigment epithelium exhibit morphology and physiology of native tissue. Invest. Ophthalmol. Vis. Sci. 2006;47:3612–3624. doi: 10.1167/iovs.05-1622. [DOI] [PMC free article] [PubMed] [Google Scholar]
- 21.Schwartz S.D., Hubschman J.P., Heilwell G., Franco-Cardenas V., Pan C.K., Ostrick R.M., Mickunas E., Gay R., Klimanskaya I., Lanza R. Embryonic stem cell trials for macular degeneration: a preliminary report. Lancet. 2012;379:713–720. doi: 10.1016/S0140-6736(12)60028-2. [DOI] [PubMed] [Google Scholar]
- 22.Blodi C.F., Stone E.M. Best's vitelliform dystrophy. Ophthalmic Paediatr. Genet. 1990;11:49–59. [PubMed] [Google Scholar]
- 23.Nordstrom S., Barkman Y. Hereditary maculardegeneration (HMD) in 246 cases traced to one gene-source in central Sweden. Hereditas. 1977;84:163–176. doi: 10.1111/j.1601-5223.1977.tb01394.x. [DOI] [PubMed] [Google Scholar]
- 24.Boon C.J., Klevering B.J., Leroy B.P., Hoyng C.B., Keunen J.E., den Hollander A.I. The spectrum of ocular phenotypes caused by mutations in the BEST1 gene. Prog. Retin. Eye Res. 2009;28:187–205. doi: 10.1016/j.preteyeres.2009.04.002. [DOI] [PubMed] [Google Scholar]
- 25.Mohler C.W., Fine S.L. Long-term evaluation of patients with Best's vitelliform dystrophy. Ophthalmology. 1981;88:688–692. doi: 10.1016/s0161-6420(81)34965-3. [DOI] [PubMed] [Google Scholar]
- 26.Xiao Q., Hartzell H.C., Yu K. Bestrophins and retinopathies. Pflugers. Arch. 2010;460:559–569. doi: 10.1007/s00424-010-0821-5. [DOI] [PMC free article] [PubMed] [Google Scholar]
- 27.Bakall B., Radu R.A., Stanton J.B., Burke J.M., McKay B.S., Wadelius C., Mullins R.F., Stone E.M., Travis G.H., Marmorstein A.D. Enhanced accumulation of A2E in individuals homozygous or heterozygous for mutations in BEST1 (VMD2) Exp. Eye Res. 2007;85:34–43. doi: 10.1016/j.exer.2007.02.018. [DOI] [PubMed] [Google Scholar]
- 28.Fischmeister R., Hartzell H.C. Volume sensitivity of the bestrophin family of chloride channels. J. Physiol. 2005;562:477–491. doi: 10.1113/jphysiol.2004.075622. [DOI] [PMC free article] [PubMed] [Google Scholar]
- 29.Petrukhin K., Koisti M.J., Bakall B., Li W., Xie G., Marknell T., Sandgren O., Forsman K., Holmgren G., Andreasson S., et al. Identification of the gene responsible for Best macular dystrophy. Nat. Genet. 1998;19:241–247. doi: 10.1038/915. [DOI] [PubMed] [Google Scholar]
- 30.Hartzell H.C., Qu Z., Yu K., Xiao Q., Chien L.T. Molecular physiology of bestrophins: multifunctional membrane proteins linked to best disease and other retinopathies. Physiol. Rev. 2008;88:639–672. doi: 10.1152/physrev.00022.2007. [DOI] [PubMed] [Google Scholar]
- 31.Marmorstein A.D., Marmorstein L.Y., Rayborn M., Wang X., Hollyfield J.G., Petrukhin K. Bestrophin, the product of the Best vitelliform macular dystrophy gene (VMD2), localizes to the basolateral plasma membrane of the retinal pigment epithelium. Proc. Natl Acad. Sci. U S A. 2000;97:12758–12763. doi: 10.1073/pnas.220402097. [DOI] [PMC free article] [PubMed] [Google Scholar]
- 32.Rosenthal R., Bakall B., Kinnick T., Peachey N., Wimmers S., Wadelius C., Marmorstein A., Strauss O. Expression of bestrophin-1, the product of the VMD2 gene, modulates voltage-dependent Ca2+ channels in retinal pigment epithelial cells. FASEB J. 2006;20:178–180. doi: 10.1096/fj.05-4495fje. [DOI] [PubMed] [Google Scholar]
- 33.Sun H., Tsunenari T., Yau K.W., Nathans J. The vitelliform macular dystrophy protein defines a new family of chloride channels. Proc. Natl Acad. Sci. U S A. 2002;99:4008–4013. doi: 10.1073/pnas.052692999. [DOI] [PMC free article] [PubMed] [Google Scholar]
- 34.Qu Z., Hartzell H.C. Bestrophin Cl- channels are highly permeable to HCO3. Am. J. Physiol. Cell Physiol. 2008;294:C1371–C1377. doi: 10.1152/ajpcell.00398.2007. [DOI] [PMC free article] [PubMed] [Google Scholar]
- 35.Barro-Soria R., Aldehni F., Almaca J., Witzgall R., Schreiber R., Kunzelmann K. ER-localized bestrophin 1 activates Ca2+-dependent ion channels TMEM16A and SK4 possibly by acting as a counterion channel. Pflugers Arch. 2010;459:485–497. doi: 10.1007/s00424-009-0745-0. [DOI] [PubMed] [Google Scholar]
- 36.Neussert R., Muller C., Milenkovic V.M., Strauss O. The presence of bestrophin-1 modulates the Ca2+ recruitment from Ca2+ stores in the ER. Pflugers Arch. 2010;460:163–175. doi: 10.1007/s00424-010-0840-2. [DOI] [PubMed] [Google Scholar]
- 37.Marmorstein A.D., Cross H.E., Peachey N.S. Functional roles of bestrophins in ocular epithelia. Prog. Retin. Eye. Res. 2009;28:206–226. doi: 10.1016/j.preteyeres.2009.04.004. [DOI] [PMC free article] [PubMed] [Google Scholar]
- 38.Guziewicz K.E., Zangerl B., Lindauer S.J., Mullins R.F., Sandmeyer L.S., Grahn B.H., Stone E.M., Acland G.M., Aguirre G.D. Bestrophin gene mutations cause canine multifocal retinopathy: a novel animal model for best disease. Invest. Ophthalmol. Vis. Sci. 2007;48:1959–1967. doi: 10.1167/iovs.06-1374. [DOI] [PMC free article] [PubMed] [Google Scholar]
- 39.Sonoda S., Spee C., Barron E., Ryan S.J., Kannan R., Hinton D.R. A protocol for the culture and differentiation of highly polarized human retinal pigment epithelial cells. Nat. Protoc. 2009;4:662–673. doi: 10.1038/nprot.2009.33. [DOI] [PMC free article] [PubMed] [Google Scholar]
- 40.Mircheff A.K., Miller S.S., Farber D.B., Bradley M.E., O'Day W.T., Bok D. Isolation and provisional identification of plasma membrane populations from cultured human retinal pigment epithelium. Invest. Ophthalmol. Vis. Sci. 1990;31:863–878. [PubMed] [Google Scholar]
- 41.Peterson W.M., Meggyesy C., Yu K., Miller S.S. Extracellular ATP activates calcium signaling, ion, and fluid transport in retinal pigment epithelium. J. Neurosci. 1997;17:2324–2337. doi: 10.1523/JNEUROSCI.17-07-02324.1997. [DOI] [PMC free article] [PubMed] [Google Scholar]
- 42.Plafker S.M. Oxidative stress and the ubiquitin proteolytic system in age-related macular degeneration. Adv. Exp. Med. Biol. 2010;664:447–456. doi: 10.1007/978-1-4419-1399-9_51. [DOI] [PMC free article] [PubMed] [Google Scholar]
- 43.Barot M., Gokulgandhi M.R., Mitra A.K. Mitochondrial dysfunction in retinal diseases. Curr. Eye Res. 2011;36:1069–1077. doi: 10.3109/02713683.2011.607536. [DOI] [PMC free article] [PubMed] [Google Scholar]
- 44.Okamoto S., Takahashi M. Induction of retinal pigment epithelial cells from monkey iPS cells. Invest. Ophthalmol Vis. Sci. 2011;52:8785–8790. doi: 10.1167/iovs.11-8129. [DOI] [PubMed] [Google Scholar]
- 45.Nunes P., Demaurex N. The role of calcium signaling in phagocytosis. J. Leukoc. Biol. 2010;88:57–68. doi: 10.1189/jlb.0110028. [DOI] [PubMed] [Google Scholar]
- 46.Marmorstein L.Y., Wu J., McLaughlin P., Yocom J., Karl M.O., Neussert R., Wimmers S., Stanton J.B., Gregg R.G., Strauss O., et al. The light peak of the electroretinogram is dependent on voltage-gated calcium channels and antagonized by bestrophin (best-1) J. Gen. Physiol. 2006;127:577–589. doi: 10.1085/jgp.200509473. [DOI] [PMC free article] [PubMed] [Google Scholar]
- 47.Fishman G.A., Baca W., Alexander K.R., Derlacki D.J., Glenn A.M., Viana M. Visual acuity in patients with best vitelliform macular dystrophy. Ophthalmology. 1993;100:1665–1670. doi: 10.1016/s0161-6420(93)31420-x. [DOI] [PubMed] [Google Scholar]
- 48.Ponjavic V., Eksandh L., Andreasson S., Sjostrom K., Bakall B., Ingvast S., Wadelius C., Ehinger B. Clinical expression of Best's vitelliform macular dystrophy in Swedish families with mutations in the bestrophin gene. Ophthalmic. Genet. 1999;20:251–257. doi: 10.1076/opge.20.4.251.2270. [DOI] [PubMed] [Google Scholar]
- 49.Mullins R.F., Oh K.T., Heffron E., Hageman G.S., Stone E.M. Late development of vitelliform lesions and flecks in a patient with best disease: clinicopathologic correlation. Arch. Ophthalmol. 2005;123:1588–1594. doi: 10.1001/archopht.123.11.1588. [DOI] [PubMed] [Google Scholar]
- 50.Frangieh G.T., Green W.R., Fine S.L. A histopathologic study of Best's macular dystrophy. Arch. Ophthalmol. 1982;100:1115–1121. doi: 10.1001/archopht.1982.01030040093017. [DOI] [PubMed] [Google Scholar]
- 51.Vugler A., Carr A.J., Lawrence J., Chen L.L., Burrell K., Wright A., Lundh P., Semo M., Ahmado A., Gias C., et al. Elucidating the phenomenon of HESC-derived RPE: anatomy of cell genesis, expansion and retinal transplantation. Exp. Neurol. 2008;214:347–361. doi: 10.1016/j.expneurol.2008.09.007. [DOI] [PubMed] [Google Scholar]
- 52.Smith R.T., Chan J.K., Busuoic M., Sivagnanavel V., Bird A.C., Chong N.V. Autofluorescence characteristics of early, atrophic, and high-risk fellow eyes in age-related macular degeneration. Invest. Ophthalmol. Vis. Sci. 2006;47:5495–5504. doi: 10.1167/iovs.05-1318. [DOI] [PMC free article] [PubMed] [Google Scholar]
- 53.Schmitz-Valckenberg S., Bultmann S., Dreyhaupt J., Bindewald A., Holz F.G., Rohrschneider K. Fundus autofluorescence and fundus perimetry in the junctional zone of geographic atrophy in patients with age-related macular degeneration. Invest. Ophthalmol. Vis. Sci. 2004;45:4470–4476. doi: 10.1167/iovs.03-1311. [DOI] [PubMed] [Google Scholar]
- 54.Chen H., Lukas T.J., Du N., Suyeoka G., Neufeld A.H. Dysfunction of the retinal pigment epithelium with age: increased iron decreases phagocytosis and lysosomal activity. Invest. Ophthalmol. Vis. Sci. 2009;50:1895–1902. doi: 10.1167/iovs.08-2850. [DOI] [PubMed] [Google Scholar]
- 55.Chowers I., Wong R., Dentchev T., Farkas R.H., Iacovelli J., Gunatilaka T.L., Medeiros N.E., Presley J.B., Campochiaro P.A., Curcio C.A., et al. The iron carrier transferrin is upregulated in retinas from patients with age-related macular degeneration. Invest. Ophthalmol. Vis. Sci. 2006;47:2135–2140. doi: 10.1167/iovs.05-1135. [DOI] [PubMed] [Google Scholar]
- 56.Weleber R.G., Carr R.E., Murphey W.H., Sheffield V.C., Stone E.M. Phenotypic variation including retinitis pigmentosa, pattern dystrophy, and fundus flavimaculatus in a single family with a deletion of codon 153 or 154 of the peripherin/RDS gene. Arch. Ophthalmol. 1993;111:1531–1542. doi: 10.1001/archopht.1993.01090110097033. [DOI] [PubMed] [Google Scholar]
- 57.Nakazawa M., Naoi N., Wada Y., Nakazaki S., Maruiwa F., Sawada A., Tamai M. Autosomal dominant cone-rod dystrophy associated with a Val200Glu mutation of the peripherin/RDS gene. Retina. 1996;16:405–410. doi: 10.1097/00006982-199616050-00007. [DOI] [PubMed] [Google Scholar]
- 58.Sparrow J.R., Boulton M. RPE lipofuscin and its role in retinal pathobiology. Exp. Eye Res. 2005;80:595–606. doi: 10.1016/j.exer.2005.01.007. [DOI] [PubMed] [Google Scholar]
- 59.Stamer W.D., Bok D., Hu J., Jaffe G.J., McKay B.S. Aquaporin-1 channels in human retinal pigment epithelium: role in transepithelial water movement. Invest. Ophthalmol. Vis. Sci. 2003;44:2803–2808. doi: 10.1167/iovs.03-0001. [DOI] [PubMed] [Google Scholar]
- 60.Capowski E.E., Schneider B.L., Ebert A.D., Seehus C.R., Szulc J., Zufferey R., Aebischer P., Svendsen C.N. Lentiviral vector-mediated genetic modification of human neural progenitor cells for ex vivo gene therapy. J. Neurosci. Methods. 2007;163:338–349. doi: 10.1016/j.jneumeth.2007.02.022. [DOI] [PubMed] [Google Scholar]
Associated Data
This section collects any data citations, data availability statements, or supplementary materials included in this article.