Abstract
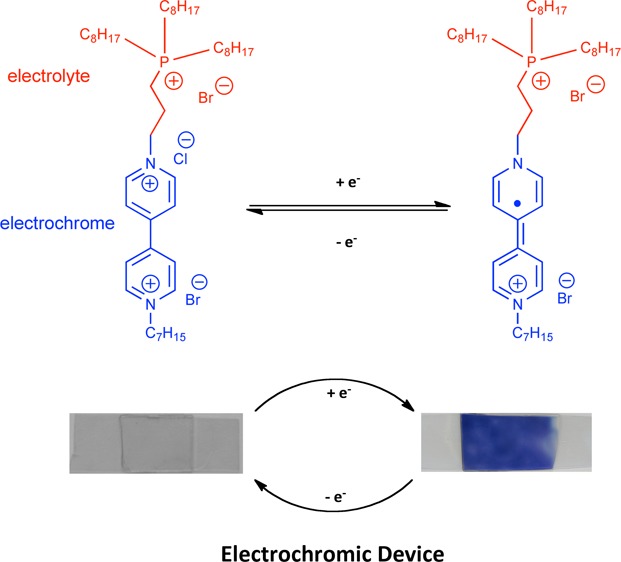
This work describes the synthesis and characteristics of a novel electrochromic ionic liquid (IL) based on a phosphonium core tethered to a viologen moiety. When integrated into a solid-state electrochromic platform, the viologen modified IL behaved as both the electrolyte and the electrochromic material. Platform fabrication was achieved through in situ photo-polymerization and encapsulation of this novel IL within a hybrid sol–gel. Important parameters of the platform performance, including its coloration efficiency, switching kinetics, and optical properties were characterised using UV–vis spectroscopy and cyclic voltammetry in tandem. The electrochromic platform exhibits a coloration efficiency of 10.72 cm2 C–1 and a varied optical output as a function of the incident current. Despite the rather viscous nature of the material, the platform exhibited approximately 2 orders of magnitude faster switching kinetics (221 s to reach 95 % absorbance) when compared to previously reported electrochromic ILs (18 000 s).
Keywords: Ionic liquids, electrochromic materials, electrochromic devices, solid-state electrolytes, viologens
Introduction
Electrochromic materials have the ability to switch between a colored and a transparent state as a function of the voltage applied.1,2 This has led to their use in so called “smart” windows, where the colored or “darkened” state is used to selectively attenuate or even reflect incoming sunlight.3 In order to create a electrochromic device, a popular mode of fabrication involves adding the electrochromic material as a dopant to a monomeric solution.4 Polymerization is then initiated between two electrodes, thus facilitating the electrochromic chemistry in the solid state.5 Typically, the polymer requires a plasticizer to produce a flexible film and a suitable electrolyte in the form of a lipophilic salt in order to facilitate charge transport.6 In fact, some devices can contain complementary (anodically vs cathodically) electrochromes, where coloration occurs via migration to their respective electrodes.7,8 In their most complex form therefore, these devices can contain up to six individual molecular components.
There has been previous literature dealing with simplifying device composition, where the electrochrome has been covalently anchored to the polymer backbone9 or to the electrode itself.10 Other approaches have focused on π-conjugated conducting polymers, which can conduct current and exhibit electrochromic traits.11 Examples of these polymers with negligible residual absorbance in the visible region are rare, however.12−14
Arguably the most popular choice of organic electrochromic materials are the viologens.15 These bipyridinium ions undergo a reversible one-electron reduction to switch from a dicationic to a monocationic radical state, promoting a high transmittance contrast in the visible region as the redox chemistry occurs.16 The energy required to obtain the appropriate excited molecular orbital of the latter is low, and as a result, coloration kinetics has been shown to be in the order of seconds.17 The optical properties of the monocationic form18 and the particular potential at which the redox chemistry occurs19 can be altered by quaternizing the pyridine center with differing electrophiles.
Ionic liquids (ILs) are liquids that are comprised entirely of cations and anions.20 In contrast to conventional organic liquids/solvents, important physical properties of ILs such as viscosity, density, and melting point can be tuned to some degree to suit a particular need by the appropriate choice of the cation/anion combination.21,22 ILs exhibit good thermal stability,23 are intrinsically conductive,24 and have been shown to have electrochemical windows as high as 5 V in some cases.25 The ability to tailor the properties of an IL to suit a particular need offers fascinating possibilities for materials science. This is achieved by incorporation of a specific functional group into the liquid state through chemical functionalization or ion-exchange metathesis of the ionic constituents. Therefore, liquids can be designed that exhibit all of the favorable properties of ILs and inherit the previous chemistries of the functional group. To this end, recent publications describing the syntheses of photo,26,27 magneto, and electrochromic28 ILs have been described. For the latter case involving electrochromic ILs, coloration switching kinetics were reported to be as long as 300 min, with a change in transmittance of ∼90 % at 540 nm reported.28 If ILs are to be used as efficient coloration materials for electrochromic devices, the coloration response time clearly must be improved upon.
ILs encapsulated within a polymer gel type network are known as ionogels,29,30 and have been described as “a solid interconnected network spreading throughout a liquid phase”.31 They are promoted as promising solid-state electrolytes with high thermal stability32 and have found application in polymer actuator systems.33 Ionogels are most commonly prepared by in situ polymerization if the IL is miscible with the monomer solution34 or by swelling of the polymer surface by the IL itself.35 Indeed, the onset of ionogels as popular materials of choice has stimulated investigations of their use in electrochromic systems. In these studies the inherent conductivity of the solid state is used to facilitate the charge transport needed for the electrochromic chemistry to occur.4,36
The goal of this work is to simplify the composition of an electrochromic platform by combining the properties of the viologen molecule with that of a phosphonium based IL. The dual functionality of the synthesised IL sees it employed both as the electrolyte and the electrochrome in the presence of an electrode sandwiched ionogel. The optoelectrical performance of this platform has been scrutinized according to a range of electrochemical conditions, i.e., the nature of incident current, potential window, and the scanning rate of cyclic potential. As a comparative, the optoelectronic properties of a classical formulation (one where the viologen is a dopant) are also scrutinized and presented.
Experimental Section
Electrochromic IL Synthesis
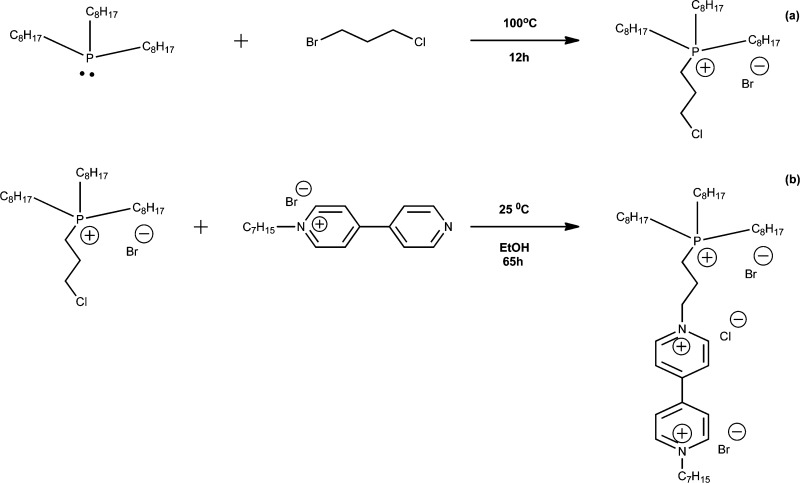
The synthesis of the electrochromic IL was performed according to Scheme 1a,b. Initially, all glassware was acid washed and dried, followed by N2 purging for a further 20 minutes in order to create an inert atmosphere. In total, 8.25 g (2.22 × 10⁻² mol) of trioctylphosphine was added to the reaction chamber using a glass syringe and allowed to equilibriate to 100 °C for 20 min. A mass of 3.85 g (2.44 × 10⁻² mol) of 1-bromo-3-chloropropane was added slowly over 4 h to the reaction flask using a pressure funnel. The inert atmosphere was maintained within the reaction chamber for a further 8 h as the reaction completed. Once completed, the volatile dihaloalkane (which was added in excess) was removed under high vacuum for 60 min. (3-Chloropropyl) trioctylphosphonium bromide [P3Cl,8,8,8][Br] (where 3Cl represents the 3-chloropropyl group and 8 the octyl chains) was obtained as a colorless oily liquid (8.15 g, 67.35 wt % yield).
Scheme 1. (i) Synthesis of (a) [P3Cl,8,8,8][Br] via Quaternization of Trioctylphosphine with a Dihaloalkane, (ii) Subsequent Secondary Quaternization with MAV to Form [PV,8,8,8][3X] (b).
1H NMR: δH (400 MHz, CDCl3) 0.88 ppm (9H), 1.2 ppm (24H), 1.51 ppm (12H), 2.17 ppm (2H), 2.43 ppm (6H), 2.8 ppm (2H), 3.7 ppm (2H). 31P NMR: (400 MHz, CDCl3) 33.2 ppm.
The second synthetic step involved further SN2 addition of [P3Cl,8,8,8][Br] with MAV. A mass of 2 g (3.8 × 10⁻³ mol) of [P3Cl,8,8,8][Br] was dissolved in 15 mL of ethanol, to which 1.4 g (4.1 × 10⁻³ mol) of MAV was added and the reaction left for 65 h at 25 °C. As [P3Cl,8,8,8][Br] was used as the limiting reagent, redissolving in dichloromethane precipitated out the excess MAV. The electrochromic IL [PV,8,8,8][3X] (where 8 again represents the octyl chains, V represents the tethered viologen moiety, and X represents the halide counter ions) was filtered, dried by rotary evaporation, and left under high vacuum overnight. The final product obtained was a yellow, highly viscous liquid (2.5 g, 73.5 wt % yield).
1H NMR: δH (400 MHz, CDCl3) 0.82 ppm (12H), 1.23 ppm (44H), 2.02 ppm (5H), 2.3 ppm (5H), 2.37 ppm (2H), 7.69 ppm (2H), 8.36 ppm (2H), 8.8 ppm (2H), 9.61 ppm (2H). 31P NMR: (400 MHz, CDCl3) 32.28 ppm.
Sol–Gel Hydrolysis
The synthesis of the polymeric phase of the ionogel is based on a procedure from previous works.4 MAPTMS was first allowed to undergo a controlled acid hydrolysis using HCl (pH 1) for 40 min. In order to control the reactivity of AlO, a complexation reaction with MAAH in the appropriate stoichiometric ratio was performed for 45 minutes in parallel. The hydrolyzed MAPTMS solution was then added dropwise to the AlO/MAAH complex, followed by further addition of H2O (pH 7), to allow complete condensation of all alkoxy groups. The final sol of stoichiometric ratio 10:0.5:0.5 (MAPTMS–AlO–MAAH) was then allowed to stir at room temperature for 24 h before use.
Electrochromic Platform Fabrication
In total, 40 mg of [PV,8,8,8][3X] was added to 60 mg of the synthesised sol–gel solution containing 3 mg (3 wt %) of DMPA (platform I). Platform II was prepared by adding 500 mg (40 wt %) of [P6,6,6,14][Cl] to 750 mg (60 wt %) of the sol–gel, followed by 38 mg (3 wt %) of DMPA and 22 mg of MAV (5 × 10⁻² M). The final ionogel monomeric solutions were sonicated for 10 min to ensure a complete homogenous liquid mixture.
The solid-state electrochromic platform was prepared by dropcasting 50 μL of the relevant ionogel mixture onto an ITO coated PET electrode. In order to generate an electrical seal a second ITO layer was then placed on top of the ionogel layer. Ultraviolet light exposure for 5 minutes initiated polymerisation within the electrodes, generating the electrical seal in tandem (Scheme 2).
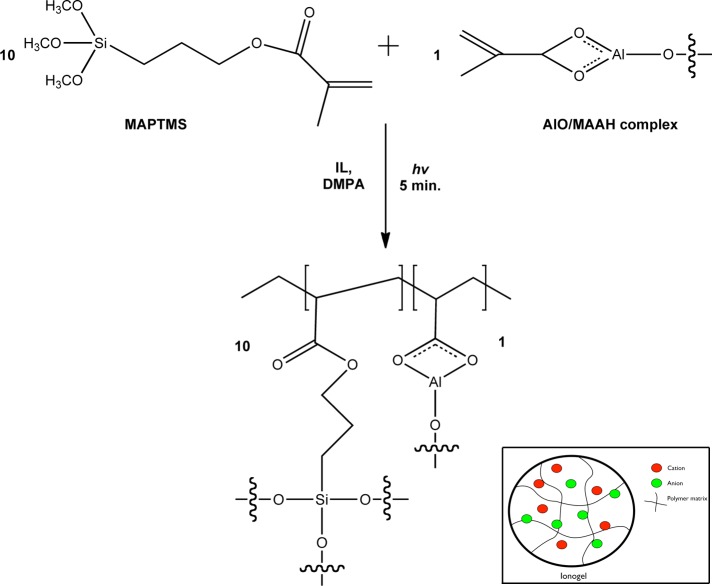
Scheme 2. Synthesis and Photo-Polymerization of the Ionogels Used in This Work.
The inset is a graphical illustration of the resulting ionogel, i.e., a polymer network with an encapsulated IL (represented by colored circles). In platform I, the viologen is covalently attached to the phosphonium cation (Scheme 1), whereas in Platform II the viologen is a dopant.
Results and Discussion
Synthesis of the Electrochromic Ionic Liquid
The first step in the synthesis of the electrochromic ionic liquid was achieved by allowing trioctylphosphine to undergo direct nucleophilic addition with a dihaloalkane. As bromine is the better leaving group in this case, the controlled temperature of the reaction resulted in it becoming the counter ion of the new IL formed. The synthesized IL therefore contains a terminal chloro-group free to undergo further SN2 addition if required. NMR analysis identified the ∼60 ppm shift from −30.78 ppm (phosphine) to 33.2 ppm (phosphonium) in the 31P spectra, indicating the quaternization reaction had occurred. The temperature dependent phase transitions of [P3Cl,8,8,8][Br] were investigated by performing a DSC ramp (Table 1 and Figure S2a in the Supporting Information) from −80 to 100 °C. [P3Cl,8,8,8][Br] showed a glass transition only at −61 °C, a behavior typical of amorphous materials and is characteristic of tetralkylated phosphonium ILs.22,37 The high thermal decomposition temperature of the IL is also in line with phosphonium based ILs, the salt being stable up to 420 °C37 (Figure S2b in the Supporting Information).
Table 1. Thermal Data Obtained for [P3Cl,8,8,8][Br] (Top) and [PV,8,8,8][3X] (Bottom)a.
| IL | Tg(°C) | Tdec (°C) |
|---|---|---|
| [P3Cl,8,8,8][Br] | –61 | 420 |
| [PV,8,8,8][3X] | –57 | 218, 418 |
Tg refers to the glass transition temperature and Tdec is the decomposition temperature (calculated using onset).
The second step of the synthesis involved a secondary quaternization of [P3Cl,8,8,8][Br] with MAV, via the electron rich and deficient moieties of the reaction constituents (Scheme 1b). Subsequent 1H NMR analysis of the product yielded revealed the aromatic upfield signals characteristic of the dipyridinium ions and the extensive alkylation of the phosphonium core. 31P analysis showed no shift in the previous signal, confirming the phosphonium center remained unreacted. A complete summary of the NMR analyses can be viewed in Figures S1i–viii in the Supporting Information.
DSC ramp analysis (Table 1 and Figure S2a in the Supporting Information) revealed that [PV,8,8,8][3X] exhibits the same thermal features as the parent IL compound. A glass transition was observed at −57 °C, whilst the thermal decomposition profile showed that [PV,8,8,8][3X] degraded in two steps, at 218 °C and 418 °C (Figure S2b in the Supporting Information). This may be due to the cleavage and degradation of the viologen component, followed by degradation of the phosphonium component at higher temperatures. This degradation behavior has also been reported previously for some ILs.38
Fabrication and Spectroelectrochemistry of Electrochromic Platforms
For solid-state platform experiments, direct photopolymerization of a hybrid sol–gel was employed, as it is miscible with the ILs used and produces a transparent flexible film. A summary of the ionogel preparation can be seen in Scheme 2. MAPTMS contains a silane center tethered to an acrylate moiety, which permits polymerization through radical transfer. The metal alkoxide–acrylate complex is introduced in order to improve heat and mechanical stability when used in previous applications.39 For the purposes of this work, it is used solely as the inert polymer matrix, which facilitates the encapsulated liquid chemistry when photopolymerized between two electrodes. Placing the generated electrochemical cell directly in the light path of a UV–vis spectrometer allows the individual electrical and optical features of both platforms to be documented in tandem (Figures 1 and 2a,b).
Figure 1.
(a) Cyclic voltammogram (scan rate, 100 mV/s) obtained for [PV,8,8,8][3X] as part of the electrochromic ionogel. (b) UV–vis absorbance spectra obtained for both oxidized and reduced states of [PV,8,8,8][3X] as part of the electrochromic ionogel.
Figure 2.
(a) Cyclic voltammogram obtained for MAV physically entrapped within a [P6,6,6,14][Cl] based ionogel, (b) the absorbance spectra obtained for both oxidized (V2+) and reduced states (V•+) of MAV as part of [P6,6,6,14][Cl] ionogel.
The individual optical and electrochemical phenomena for platform I are presented in Figure 1a,b. From the resultant voltammogram, the expected redox chemistry of a system containing di-quaternized pyridinium ions is observed (i.e., two reduction potentials observed at −0.84 and −1.21 V, respectively). As the sol–gel matrix can be viewed as an insulating material, ion movement typical of a solid-state electrolyte must then facilitate the current needed for these redox processes. However in this case, the electrolyte is also the electrochrome. When the applied potential to the electrochromic platform is maintained at the first reduction potential (−0.84 V), the monocationic radical is generated and a distinct change in absorbance at 610 nm is observed (Figure 1b).
As the MAV starting material exhibits electrochromic traits, we prepared platforms (platform II) based on an ionogel comprising the unmodified IL. This platform allows the viologen moiety (MAV) to act as a dopant within the ionogel rather than covalently attached to the phosphonium cation. The resultant voltammogram for platform II can be seen in Figure 2a and exhibited only one redox couple in the potential window applied. When the platform potential is held at the reduction potential (−0.91 V), a purple color with a λmax at 550 nm is generated (Figure 2b), which has previously been attributed to a mixture of the monocationic (blue) and radical dimers (red).40 In this case however, the IL encapsulated within the polymeric medium independently facilitates the redox chemistry of MAV. An overview of the optical redox properties of both platforms is presented in Scheme 3.
Scheme 3. Summary of the Optical Properties of Solid-State Platforms I and II.
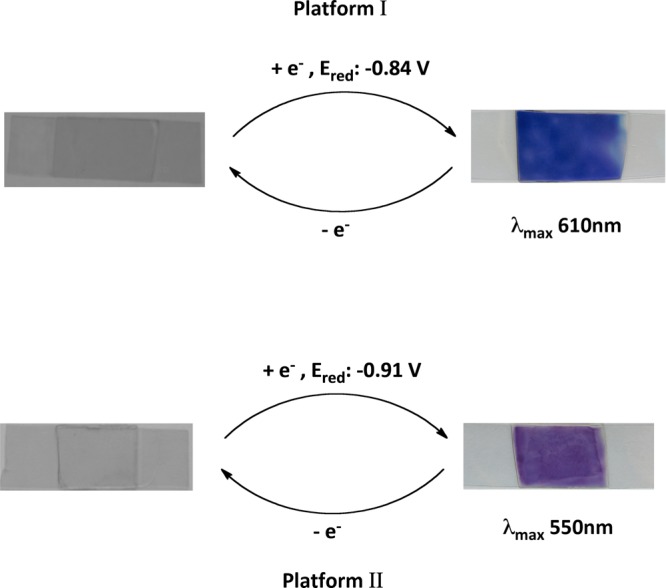
Top: platform I (λmax, 610 nm; Ered, −0.84 V), with viologen chromophore bound to the phosphonium cation of the IL and encapsulated in the sol–gel. Platform dimensions: L, 4 cm; B, 1.5 cm; and thickness, 0.32 ± 0.004 mm (average of four platforms). Bottom: platform II (λmax, 550 nm; Ered, −0.91 V) with viologen chromophore is physically entrapped in the sol–gel along with a conventional phosphonium based IL ([P6,6,6,14][Cl]). Platform dimensions: L, 4 cm; B, 1.5 cm; and thickness, 0.30 ± 0.002 mm (average of four platforms).
Figure 3 gives an indication of the dynamic response of platform I in terms of the absorbance rise and the current profile. The time required to achieve 95% of the maximum absorbance was relatively fast, at ∼221 s, compared to previous results obtained with electrochromic ILs (18 000 s).28 Here we attribute the accelerated kinetic response to the inherent redox dynamics of employing viologens within electrochromic devices, as previously reported.41
Figure 3.
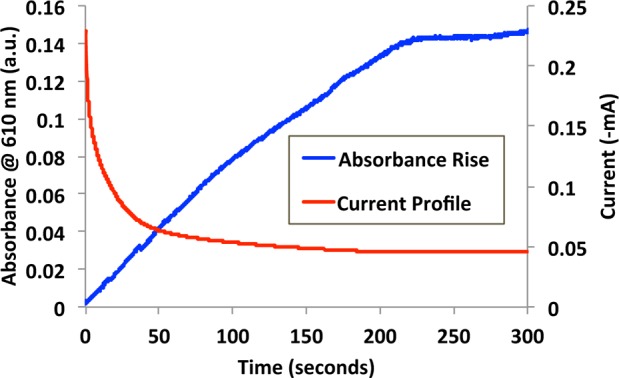
(Blue) Coloration response curve obtained for platform I (−0.84 V) and the current profile within the platform during coloration (red).
A key performance characteristic of all electrochromic devices is the coloration efficiency, which relates the change in its absorbance to the charge required to induce the change,42,43 according to the equation
| 1 |
where η is the coloration efficiency at a given wavelength, ΔOD is the change in the optical density, Tc and Tt are the transmission levels of the colored and transparent states, respectively, and ΔQ is the charge density needed to induce this change.
Inputting the data from Figure 3 into eq 1 yields a coloration efficiency of 10.72 cm2 C–1 for platform I. Considering the very viscous nature of [PV,8,8,8][3X], ion mobility is low and a low coloration efficiency is to be expected. In a similar study, electrochromic devices based on viologen functionalized nanoparticles exhibit a coloration efficiency of 205 cm2 C–1.44 Here the contrast in coloration efficiency is due to the large surface area of the nanoparticles and the porosity of the thin films employed.
The conductivity of platform I was investigated using electrochemical impedance spectroscopy and yielded a value of 4.08 × 10⁻⁷ S/cm2 in its oxidized state (Figures S4 and S5 in the Supporting Information). For comparative purposes, our previous work described the conductivity of a viologen physically entrapped in an ionogel based on a low viscosity IL to be 1.54 × 10⁻⁴ S/cm2.4 Analogous to the coloration efficiency value, the large difference obtained can be attributed to the viscosity of the IL in question. [PV,8,8,8][3X] is a highly viscous yellow waxlike liquid, meaning its ability to carry current through ion flow is greatly reduced compared to that of a less viscous liquid in which the ions are more mobile.24,45
Platform Calibration and Optical Memory
Experiments were performed to calibrate the color generated as a function of the potential applied (dc in this case). To do this, a series of platforms were exposed to increasing applied voltages for 60 s, and the absorbance at 610 nm was measured. It can be seen from Figure 4a that the optical response of platform I is linearly correlated with the applied potential. Throughout the course of the these experiments, it was noted that the platforms exhibited a prolonged optical memory, meaning the color generated is significantly maintained under open circuit conditions.42 To investigate this behaviour, platforms were first brought to a colored state by polarizing at 2.5 V and 3 V (60 s) and monitoring the decoloration process for a period of over 100 min under open circuit conditions.
Figure 4.
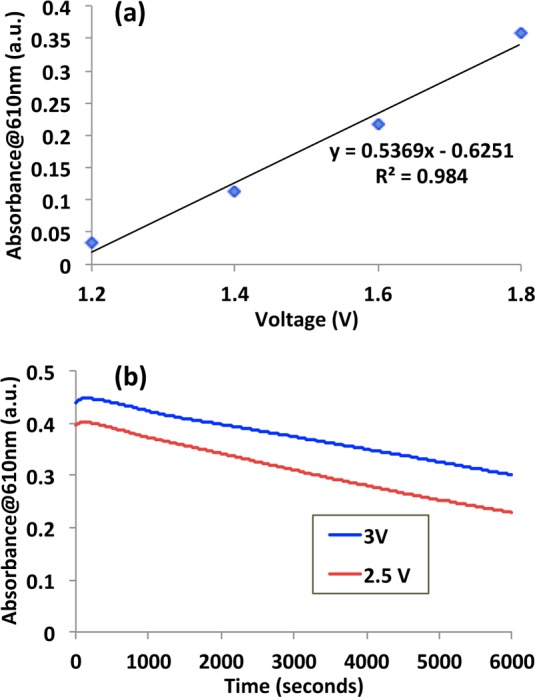
(a) Correlation of the coloration growth and (b) the decrease in coloration over a period of ∼100 min under open circuit conditions.
Figure 4b shows when the applied voltage is 2.5 V, the absorbance at 610 nm increases to 0.396 a.u., 57.7% of which is maintained after 100 min. Similarly at 3 V, the absorbance at 610 nm increases to 0.438 a.u., 68.5% of which is retained after 100 min. It is interesting that the rate of decrease in absorbance is relatively constant with time for both experiments at ∼1.5 × 10⁻³ a.u./s. This is related to the leakage current of the platform, which suggests it can be increased or reduced by either improving the platform insulation or providing a more effective discharge pathway (see discussion below).
By amperometrically maintaining a current at the first reduction potential for 160 s, the impedance of the reduced monocationic radical form of the ionogel was estimated (Figures S4 and S5 in the Supporting Information). The resultant Nyquist plot exhibits an increase in impedance due to the loss of a cationic site. Furthermore, the shape of the semicircle arc also expands, indicative of a capacitance effect. The change in spectral features explains the prolonged optical memory, as the nature of the direct current preserves the relatively unstable monocationic radical, due to an increased capacitance within the gel. This effect could be used to exploit a prolonged darkened state in electrochromic applications should the need arise.
Platform Switching
A general overview of the redox-governed equilibria for viologen compounds is presented in Scheme 4. Viologens can be reduced from a colorless divalent state (V2+) to a colored monovalent radical (V•+), while further reduction yields the colorless quinoid (V) state.11 This behavior was investigated in the platform configuration to examine how effective the redox switching would be in the IL medium, using a potentiostat to repeatedly switch between the various forms of the viologen moiety. In order to take advantage of the stable electrochemical window endowed on the system by the IL, a wide range of potential windows were examined (from +/– 3 V to +/– 2 V and +/– 1.75 V), whilst the scan rate was also varied (from 100 to 10 mV/s), with the absorbance at 610 nm simultaneously monitored over time.
Scheme 4. Two Step Redox Equilibria of the Viologen Species.
“R” is used to represent the quaternizing agent, and X– denotes the counterion.
Figure 5a–c shows the changes in absorbance as the cell was cycled repeatedly from (a) 0 V (initial voltage) through −3 V to +3 V and back to 0 V at a scan rate of 100 mV/s; (b) 0 V (initial voltage) through −2 V to +2 V and back to 0 V at a scan rate of 100 mV/s; and (c) 0 V (initial voltage) through −1.75 V to +1.75 V and back to 0 V at a scan rate of 10 mV/s. The labelled absorbance features from 1–5 for each kinetic profile can be interpreted in terms of the dynamics of switching between the three redox states of the viologen moiety (Figure 1a).
Figure 5.
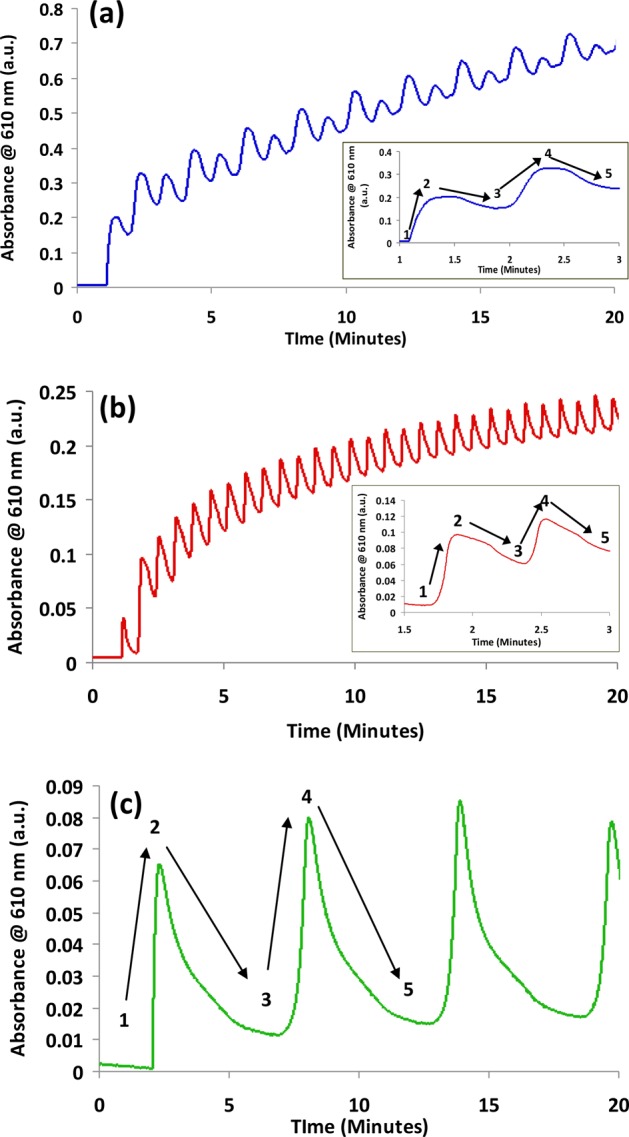
(a–c) Changes in absorbance at 610 nm for platform I as a function of potential window and the incident scan rate ((a) voltage window, +/– 3 V; scan rate, 100 mV/s; (b) +/– 2 V, 100 mV/s; and (c) +/– 1.75 V, 10 mV/s.) The insets in parts a and b show magnified portions of the scans for the time sections indicated on the axis.
In each case, at the initial point in the voltammogram, the viologen moiety exists in the colorless V2+ form and the absorbance is low. As the voltage approaches and passes through −0.85 V, the absorbance increases as the V2+ ion is reduced to the blue colored V•+ radical (steps 1 and 2, Figure 5a–c). However, as the voltage passes through ∼−1.25 V, the colored V•+ radical is converted to the colorless V form (quinoid), and the absorbance decreases (steps 2 and 3). The voltage continues through −1.35 V to −3.0 V and then sweeps back in the positive direction. At ∼−1.0 V, oxidation of V to the V•+ radical occurs and the absorbance increases again (steps 3 and 4). At −0.45 V, oxidation of V•+ to V2+ occurs and the color decreases again as voltage increases through 0 V to +3.0 V (steps 4 and 5).
At a sweep rate of 100 mV/s and a voltage range of +/– 3 V, each cycle in Figure 5a takes 2 min, and the repeating pattern for each of the nine indicated cycles, in which the two colored regions caused by formation of V•+ are clearly visible. It is notable that the absorbance does not return to baseline after each cycle, indicating that residual V•+ remains in place and gradually builds up over time. This is probably due to the rather sluggish kinetics of the redox chemistry within the cell, which also manifests as a dampened absorbance/time signal, with considerable broadening of the absorbance peaks. The secondary absorbance cycle seen in the kinetic profile is assigned to subsequent oxidation of V back to V•+ as the potential cycles back to −0.95 V and the absorbance again increases. The final redox transition occurs at −0.46 V (V•+ to V2+) and the absorbance again decreases. The effects of the individual redox equilibria on the absorbance are reproducible over time and a gradual staircase effect is seen in the overall kinetic profile.
Figure 5b shows the kinetic profile obtained while scanning over the potential range of +/–2 V, at a scan rate of 100 mV/s. Under these conditions, each absorbance cycle takes approximately 84 s, and the absorbance features appear sharper (inset), most likely due to the reduced time scale of the experiment. Each absorbance cycle is again fully reproducible, whilst the gradual build-up in absorbance over the same time scale as part a is reduced (maximum absorbance at t = 20 min is ∼0.25 in part b, compared to ∼0.7 in part a).
Figure 5c shows the profile obtained when the scan range is +/–1.75 V, and the scan rate reduced to 10 mV/s in parallel. Under these experimental conditions the first absorbance cycle now takes approximately 12 min to complete. The reaction kinetics are now much more reversible, as there is a much smaller build up in absorbance over the 20 min period, with the absorbance baseline returning to ∼0.02 a.u. between the peaks caused by V•+ radical generation. The V•+ radical (steps 1 and 2) forms very rapidly (within 18 s) once the voltage passes through −0.85 V, whilst further reduction to the quinoid isomer (step 2 and 3) occurs over the following 280 s. As the voltage sweeps back towards more oxidizing potentials, the V•+ radical is regenerated at ∼−0.85 V (step 3 and 4) and subsequently is further oxidized to the colorless V2+ ion at ∼−1.25 V (steps 4 and 5). From these results it appears that despite the rather viscous nature of the IL, charge mobility is sufficient to enable more or less complete reversibility. The staircase-like kinetic increase in absorbance arising from a build up of the colored V•+ radical observed under previous conditions is almost completely absent.
Figure 6 was constructed by taking individual segments from the decay response under both open circuit and positive anodic conditions (600–1600 s under open circuit conditions, between 150 and 175 s for the 100 mV/s experiment, and between 70 and 355 s for the 10 mV/s experiment). The initial time of each segment was then redefined as t0. This not only allows the effects of the absorbance decay under open circuit and anodic perturbations to be seen but also the effects of the potentiostatically controlled scan rate. Under open circuit conditions, the absorbance is stable in the time scale shown (24 s), and the slope of the decay is relatively constant at ∼5.78 × 10⁻⁵ a.u./s.
Figure 6.
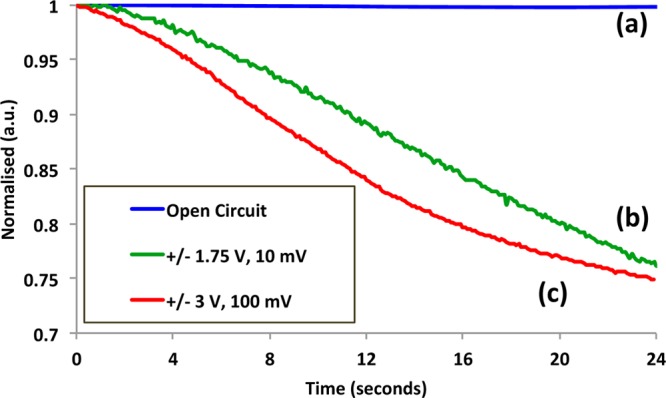
Normalized response decay obtained under (a) open circuit (absorbance 0.44 at 610 nm, t = 0) and positive biased voltage conditions: (b) +1.75 V, absorbance 0.06 at 610 nm and (c) +3 V, absorbance 0.32 at 610 nm, t = 0).
Under anodic conditions, re-oxidation of the chromophore is induced and the decay is obviously more rapid. Furthermore, the initial rate of decay of the oxidation reaction is directly influenced by the voltage scan rate. At a scan rate of 100 mV/s, the slope of the decay was calculated to be 1.43 × 10 –2 a.u./s, whilst the slower scan rate (10 mV/s) induced a lower value of 1.01 × 10 –2 a.u./s, with consistently higher absorbance values in parallel over the same time scale. This shows that the rate of decoloration for platform I can be controlled to a significant degree (∼1000 times quicker using a 100 mV/s scan rate).
Coloration control can be achieved by changing from open circuit (in which leakage current from the capacitive charge is the decoloration process) to a polarizing voltage in which the redox chemistry of the colored viologen monocationic radical is actively driven back to the colorless V2+ form. In addition, if the platform is considered as a capacitor, improving the insulation would further reduce the leakage current, enabling the colored state to be maintained for longer durations. The decoloration process (as it is actively driven) should remain unaffected under these conditions, meaning that one could maintain the colored state until a pre-set time. Applying a polarizing voltage, decolorizing the platform, can reverse the effects.
Conclusions
In conclusion, this article presents a new approach to the design of prototype viologen based electrochromic devices, in which an IL acts as the electrolyte and the electrochromic material. The synthesis of a novel phosphonium electrochromic IL has been described and the resulting material successfully incorporated into a solid-state electrochromic platform. One major advantage of the electrochromic platform is the fact that the viologen is inherently part of the IL and therefore no leaching occurs. The ease of its encapsulation within the inert polymer matrix and subsequent photo-polymerization between two ITO electrodes formed the basis of a simple electrochromic platform.
The inherent electrochromic nature of one of the starting materials employed provided the ideal control and validation experiment to authenticate the synthesis. The resultant ionogel (platform II) exhibited electro-optical properties significantly different than the [PV,8,8,]][3X] IL (platform I). Platform I exhibited coloration kinetics close to 2 orders of magnitude faster (221 s for 95 % absorbance) compared to a previously reported electrochromic IL, and its optoelectronic outputs varied depending on the nature of the incident current. Under a direct incident current, the platform exhibited a defined optical memory, maintaining ∼69% of its coloration after 100 min. Under an alternating current, the platform proved capable of cycling between its transparent and colored forms over a defined time period. The dynamics of color change are determined by the ability to get charge into and out of the platform, as this drives the redox chemistry of the coloration.
Therefore coloration can be controlled by alternatively insulating the platform to prevent leakage current (which maintains the color) or actively driving current into or out of the platform, which gives much faster changes (1000 times quicker). Thus if the charge is central to device performance, so too are the physical properties of the liquid electrolyte. Therefore, the molecular design of the IL is crucial to the future optimization of key electrochromic device parameters. In this instance, features such as the use of halide counterions and the close proximity of both charge centers (phosphonium and pyridinium) promote a liquid exhibiting a high viscosity. As counterions exhibiting mere electrostatic attractions have been shown to dramatically decrease the viscosity of ILs,46 future derivatives can be produced which should exhibit increased ion mobility, in turn enhancing the applicability of electrochrome functionalised ILs.
Acknowledgments
A.K. would like to thank Dr. Al Robertson from Cytec Industries for the generous donation of the phosphorous based materials used and helpful discussions throughout the duration of this work. A.K. would also like to thank Prof. Robert Forster and Dr. Andreas Heise from the school of chemistry, DCU, for the kind use of instruments used in the duration of this work. K.J.F acknowledges the European Commission for financial support through a Marie Curie Actions re-integration grant (IRG) (Grant PIRG07-GA-2010-268365) and the Irish Research Council for Science, Engineering and Technology. This work is supported by Science Foundation Ireland under Grant 07/CE/I1147 including the SFI-funded National Access Programme (NAP) Grant NAP210 and by Enterprise Ireland Grant 07/RFP/MASF812, which is part of the EU-MATERA initiative.
Supporting Information Available
Complete list of the materials and instrumentation used throughout this work; 1H and 31P NMR spectra of all starting and intermediate materials and the final synthesised IL; DSC and TGA thermal analyses of intermediate and final synthesised ILs; electrochromic device thickness analysis; and electrochemical impedance spectroscopy of oxidized and reduced forms of the electrochromic IL. This material is available free of charge via the Internet at http://pubs.acs.org.
The authors declare no competing financial interest.
This paper was published on the Web on December 14, 2012, with an error in the last author's name. In addition, additional text corrections were made throughout the paper, and the corrected version was reposted on December 17, 2012.
Supplementary Material
References
- Coleman J. P.; Freeman J. J.; Madhukar P.; Wagenknecht J. H. Displays 1999, 20, 145. [Google Scholar]
- Rosseinsky D. R.; Mortimer R. J. Adv. Mater. 2001, 13, 783. [Google Scholar]
- Tracy C. E.; Zhang J. G.; Benson D. K.; Czanderna A. W.; Deb S. K. Electrochim. Acta 1999, 44, 3195. [Google Scholar]
- Kavanagh A.; Copperwhite R.; Oubaha M.; Owens J.; McDonagh C.; Diamond D.; Byrne R. J. Mater. Chem. 2011, 21, 8687. [Google Scholar]
- Vergaz R.; Barrios D.; Sanchez-Pena J. M.; Pozo-Gonzalo C.; Salsamendi M.; Pomposo J. Displays 2008, 29, 401. [Google Scholar]
- Chidichimo G.; De Benedittis M.; Lanzo J.; De Simone B. C.; Imbardelli D.; Gabriele B.; Veltri L.; Salerno G. Chem. Mater. 2007, 19, 353. [Google Scholar]
- Ho K. C.; Fang Y. W.; Hsu Y. C.; Chen L. C. Solid State Ionics 2003, 165, 279. [Google Scholar]
- Tu X.; Fu X.; Jiang Q.; Liu Z.; Chen G. Dyes Pigm. 2011, 88, 39. [Google Scholar]
- Godinez L. A.; Castro R.; Kaifer A. E. Langmuir 1996, 12, 5087. [Google Scholar]
- Campus F.; Bonhote P.; Gratzel M.; Heinen S.; Walder L. Sol. Energy Mater. Sol. Cells 1999, 56, 281. [Google Scholar]
- Mortimer R. J.; Dyer A. L.; Reynolds J. R. Displays 2006, 27, 2. [Google Scholar]
- Sapp S. A.; Sotzing G. A.; Reynolds J. R. Chem. Mater. 1998, 10, 2101. [Google Scholar]
- Kumar A.; Welsh D. M.; Morvant M. C.; Piroux F.; Abboud K. A.; Reynolds J. R. Chem. Mater. 1998, 10, 896. [Google Scholar]
- Sakano T.; Ito F.; Ono T.; Hirata O.; Ozawa M.; Nagamura T. Thin Solid Films 2010, 519, 1458. [Google Scholar]
- Bird C. L.; Kuhn A. T. Chem. Soc. Rev. 1981, 10, 49. [Google Scholar]
- Melendres C. A.; Lee P. C.; Meisel D. J. Electrochem. Soc. 1983, 130, 1523. [Google Scholar]
- Cinnsealach R.; Boschloo G.; Rao S. N.; Fitzmaurice D. Sol. Energy Mater. Sol. Cells 1999, 57, 107. [Google Scholar]
- Barltrop J. A.; Jackson A. C. J. Chem. Soc., Perkin Trans. 2 1984, 367. [Google Scholar]
- Dorman S. C.; O’Brien R. A.; Lewis A. T.; Salter E. A.; Wierzbicki A.; Hixon P. W.; Sykora R. E.; Mirjafari A.; Davis J. H. Jr. Chem. Commun. 2011, 47, 9072. [Google Scholar]
- Armand M.; Endres F.; MacFarlane D. R.; Ohno H.; Scrosati B. Nat. Mater. 2009, 8, 621. [DOI] [PubMed] [Google Scholar]
- Murray S. M.; O’Brien R. A.; Mattson K. M.; Ceccarelli C.; Sykora R. E.; West K. N.; Davis J. H. Angew. Chem., Int. Ed. 2010, 49, 2755. [DOI] [PubMed] [Google Scholar]
- Fraser K. J.; MacFarlane D. R. Aust. J. Chem. 2009, 62, 309. [Google Scholar]
- Xue H.; Gao Y.; Twamley B.; Shreeve J. M. Chem. Mater. 2005, 17, 191. [Google Scholar]
- MacFarlane D. R.; Forsyth M.; Izgorodina E. I.; Abbott A. P.; Annat G.; Fraser K. Phys. Chem. Chem. Phys. 2009, 11, 4962. [DOI] [PubMed] [Google Scholar]
- Zhao C.; Burrell G.; Torriero A. A. J.; Separovic F.; Dunlop N. F.; MacFarlane D. R.; Bond A. M. J. Phys. Chem. B 2008, 112, 6923. [DOI] [PubMed] [Google Scholar]
- Zhang S. G.; Liu S. M.; Zhang Q. H.; Deng Y. Q. Chem. Commun. 2011, 47, 6641. [DOI] [PubMed] [Google Scholar]
- Branco L. C.; Pina F. Chem. Commun. 2009, 6204. [DOI] [PubMed] [Google Scholar]
- Branco A.; Branco L. C.; Pina F. Chem. Commun. 2011, 47, 2300. [DOI] [PubMed] [Google Scholar]
- Le Bideau J.; Viau L.; Vioux A. Chem. Soc. Rev. 2011, 40, 907. [DOI] [PubMed] [Google Scholar]
- Ueki T.; Watanabe M. Macromolecules 2008, 41, 3739. [Google Scholar]
- Neouze M. A.; Le Bideau J.; Gaveau P.; Bellayer S.; Vioux A. Chem. Mater. 2006, 18, 3931. [DOI] [PubMed] [Google Scholar]
- Gayet F.; Viau L.; Leroux F.; Monge S.; Robin J. J.; Vioux A. J. Mater. Chem. 2010, 20, 9456. [Google Scholar]
- Benito-Lopez F.; Byrne R.; Raduta A. M.; Vrana N. E.; McGuinness G.; Diamond D. Lab Chip 2010, 10, 195. [DOI] [PubMed] [Google Scholar]
- Byrne R.; Ventura C.; Lopez F. B.; Walther A.; Heise A.; Diamond D. Biosens. Bioelectron. 2010, 26, 1392. [DOI] [PubMed] [Google Scholar]
- Izak P.; Hovorka S.; Bartovsky T.; Bartovska L.; Crespo J. G. J. Membr. Sci. 2007, 296, 131. [Google Scholar]
- Ahmad S.; Deepa M. Electrochem. Commun. 2007, 9, 1635. [Google Scholar]
- Del Sesto R. E.; Corley C.; Robertson A.; Wilkes J. S. J. Organomet. Chem. 2005, 690, 2536. [Google Scholar]
- Fraser K. J.; Izgorodina E. I.; Forsyth M.; Scott J. L.; MacFarlane D. R. Chem. Commun. 2007, 3817. [DOI] [PubMed] [Google Scholar]
- Soppera O.; Croutxe-Barghorn C.; Lougnot D. J. N. J. Chem. 2001, 25, 1006. [Google Scholar]
- Monk P. M. S.; Fairweather R. D.; Ingram M. D.; Duffy J. A. J. Chem. Soc., Perkin Trans. 2 1992, 2039. [Google Scholar]
- Mortimer R. J. Electrochim. Acta 1999, 44, 2971. [Google Scholar]
- Cummins D.; Boschloo G.; Ryan M.; Corr D.; Rao S. N.; Fitzmaurice D. J. Phys. Chem. B 2000, 104, 11449. [Google Scholar]
- Argun A. A.; Aubert P. H.; Thompson B. C.; Schwendeman I.; Gaupp C. L.; Hwang J.; Pinto N. J.; Tanner D. B.; MacDiarmid A. G.; Reynolds J. R. Chem. Mater. 2004, 16, 4401. [Google Scholar]
- Jain V.; Khiterer M.; Montazami R.; Yochum H. M.; Shea K. J.; Heflin J. R. ACS Appl. Mater. Interfaces 2009, 1, 83. [DOI] [PubMed] [Google Scholar]
- Hapiot P.; Lagrost C. Chem. Soc. Rev. 2008, 108, 2238. [DOI] [PubMed] [Google Scholar]
- MacFarlane D. R.; Golding J.; Forsyth S.; Forsyth M.; Deacon G. B. Chem. Commun. 2001, 1430. [Google Scholar]
Associated Data
This section collects any data citations, data availability statements, or supplementary materials included in this article.


