Abstract
Sorafenib, which is approved for treatment of HCC, has also shown promising antifibrotic activity, and therefore refinement of its dosing requirements and window of efficacy are important goals prior to antifibrotic clinical trials.
Aim
To determine the minimal effective dose and optimal timing of sorafenib therapy in cultured human stellate cells and in rats with experimental hepatic fibrosis.
Methods
Effects of sorafenib were assessed in a human stellate cell line (LX-2). In vivo, rats were treated for 8 wks with TAA three times pre week (150 mg/kg IP), and with either PBS, or sorafenib administered daily at doses of 1.25, 5 or 7 mg/kg/day gavage either at the beginning of TAA adminstration for 8 wks, during weeks 4–8, or from weeks 8–12.
Results
Sorafenib treatment significantly inhibited LX-2 proliferation by > 75% (7.5 or 15 µM). Treatment with 7.5 µM sorafenib for 12 hours markedly inhibited expression of TGFβ1, TIMP-1, collagen I, and MMP2 mRNAs, but not of β-PDGFR or type I TGFβR. In vivo, sorafenib significantly inhibited liver fibrosis when started concurrently with TAA and during weeks 4–8 with TAA. In contrast, there was no significant effect of sorafenib on fibrogenic gene expression or fibrosis when begun after cirrhosis was already established.
Conclusion
Sorafenib is anti-proliferative and antifibrotic towards human HSCs in culture, and is a potent antifibrotic agent in TAA-induced hepatic fibrosis in rats. The drug is effective at relatively low doses at the early stage of liver fibrosis, but is not effective when cirrhosis is already established.
Introduction
Liver fibrosis is a reversible wound healing response that is a result from accumulation of extracellular matrix (ECM) in response to acute or chronic liver injury [1]. Hepatic stellate cells (HSC) are resident perisinusoidal cells in the sub-endothelial space between hepatocytes and sinusoidal endothelial cells that are the primary effector cells of liver fibrosis. During liver injury, HSCs are activated and produce most of the matrix components of fibrotic liver, including collagen. Platelet-derived growth factor (PDGF) is a potent mitogen of HSCs and is amongst one of the bestcharacterized pathways of HSC activation[2]. Induction of β-PDGF receptor during early HSC activation activates its downstream effectors, which include ERK/MAP kinase pathways[3, 4]. Anti-fibrotic drugs antagonizing β-PDGF receptors and related tyrosine kinase receptors are appealing prospects for antifibrotic therapies.
Sorafenib is a widely used multi-tyrosine kinase inhibitor that is FDA approved drug for treatment of hepatocellular and renal cell carcinomas [5–7]. Its mechanism of action is primarily to inhibit the RAF/MEK/ERK pathways, and in vivo it decreases tumor cell proliferation and angiogenesis, while increasing tumor cell apoptosis[8]. Previous studies demonstrate an antifibrotic activity of sorafenib in attenuating matrix accumulation and vascular remodeling in bile duct ligation (BDL) model of liver fibrosis [9]. However, these studies have not established until what point during the natural progression of fibrosis sorafenib remains effective, and have not examined models of parenchymal cell injury and fibrosis, which is far more common pattern of injury in human disease.
Development of antifibrotic therapies suitable for human use remains an elusive goal. In this study, we have examined the dosing requirement and window of efficacy of sorafenib treatment in animal models, as a prelude to contemplating anti-fibrotic clinical trials in patients with fibrotic liver disease. Specifically, we have established the minimal effective dose and optimal timing of sorafenib therapy in cultured human HSCs and in the thioacetamide (TAA)-induced model of liver fibrosis in rats, a well-established model that most closely mimics human liver fibrosis.
Materials and methods
Culture studies
LX-2 cells and primary human stellate cells were maintained in Dulbecco’s Modified Eagle Medium with High Glucose containing 10% fetal bovine serum and 1% Penicillinstreptomycin antibiotics (Gibco, Invitrogen). Cells were treated with sorafenib (Bayer Onyx) for 12, 24, 48 or 72 hours at concentrations of 7.5 µM and 15 µM in medium with 0.2% BSA or 10% fetal bovine serum.
AlamarBlue® cell viability assay
Cell viability was assessed using alamarBlue® (Invitrogen). A 96-well plate containing approximately 5,000 LX-2 cells per well were treated with 7.5 and 15 µM at 12 and 24 hours. AlamarBlue® reagent is added directly to each well, the plates are incubated at 37°C to allow cells to convert resazurin to resorufin, and the fluorescence signal is measured.
Isolation of Primary Human HSCs
Primary HSCs were isolated from wedge sections of normal human livers in patients undergoing hepatic resection for primary benign tumors or single metastasis from colon cancer as previously described [10]. HSCs were activated by culturing on plastic for 7–14 days and subcultured to passage 3 for the following experiments. In addition to primary HSCs, we also utilized a well-validated immortalized human HSC line, LX-2, whose features closely resemble those of primary activated HSCs[11].
Cell proliferation assay
DNA synthesis was assayed using 3H-thymidine incorporation as previously described[11]. LX-2 cells were seeded at a density of 20,000 cells per well in 24-well plates. After 24 hours, the medium was changed to Dulbecco’s Modified Eagle’s medium containing 0.2% fetal bovine serum for 12 hours, and the cells were then treated with sorafenib at 7.5 µM and 15 µM for an additional 24 or 48 hours, and 1 Ci/mL 3H-thymidine was added for 4 hours before harvesting. Cells were then washed three times with ice-cold PBS and fixed in methanol for 30 minutes at 4°C. Cells were solubilized in 0.25% sodium hydroxide/ 0.25% sodium dodecyl sulfate. After neutralization with hydrochloric acid (1N), radioactivity was measured using a scintillation counter (Beckman Coulter).
DNA Isolation and Electrophoresis
To detect fragmented or apoptotic DNA (small DNA fragments) in LX-2 cells, DNA was isolated from LX-2 cells treated with 10 µg/ml of sorafenib and vehicle for 12 and 48 hours using the Apoptotic DNA Ladder Extraction Kit (BioVision, Mountain View, USA) according to the manufacturer's guidelines. Samples were run in 2% agarose gels, stained with ethidium bromide, and visualized by transillumination with UV light.
Reverse Transcription and Real-time Quantitative PCR
RNA from LX-2 cells, primary stellate cells or 100 mg of rat whole liver tissues were extracted and purified using an RNeasy Mini kit (Qiagen, Valencia, CA) and 1 µg of total mRNA was reverse transcribed into complementary DNA (cDNA) using SprintTM RT Complete-RNA to cDNA EcoDry™ Premix (Double Primed) tubes (Clontech, Mountain View, CA), and analyzed by quantitative PCR using SYBR green qPCR Master Mix (Roche) on the LightCycler®480 RealTime PCR System (Roche). Data are represented as the relative expression of fibrogenic genes after normalizing to GAPDH.
Western Blot
Total protein was extracted from cells using RIPA lysis buffer (50 mM Tris-HCl pH=8, 150 mM NaCl, 1% IGEPAL, 0.5% sodium deoxycholate and 0.1% SDS) with complemented protease inhibitor mixture and protein phosphatase inhibitor mixtures (Roche). Proteins from rat liver tissues were extracted by homogenizing. Protein concentration was determined with a Bio- Rad DC kit (Bio-Rad). Antibodies used were as follows: rabbit anti-collagen type I (1:2000) (Rockland), mouse anti-aSMA (1:500) (Millipore), and rabbit anti-GAPDH (1:2000)(Santa Cruz).
In vivo studies in TAA-treated rats
Male Sprague-Dawley rats between 280–300 grams or 8–10 week old (Jackson Laboratory) were maintained according to NIH guidelines and approved by the Mount Sinai IACUC Committee. Rats were kept in the animal Care Facility of the Mount Sinai Medical Center with a 12 hour light-dark cycle at constant temperature. Rats had free access to tap water during the study period.
In vivo studies employed ‘prophylactic’ (Group 2), ‘therapeutic’ (Group 3) and ‘reversal’ (Group 4) treatment schedules and a control group (Group 1) (Supplemental Figure 1). Each group contained 4 different subgroups, each of which contained 7 rats. In Group 1, rats were administered phosphate buffer saline (PBS) intraperitoneally (IP) weekly with no TAA injection. In Group 2, 3 and 4, rats were administered 150 mg/kg of TAA (Sigma Chemical Co., St. Louis, MO) by IP, three times weekly for 8 weeks to induce cirrhosis. Rats were administered sorafenib by gavage daily at doses of 1.25 mg/kg/day (Subgroup A), 5 mg/kg/day (Subgroup B), 7 mg/kg/day (Subgroup C) and vehicle control (12.5% Cremaphor (Sigma), 12.5% ethanol and 75% water) (Subgroup D); beginning either concurrently with TAA for 8 weeks (Group 2), during weeks 4–8 (Group 3), or from weeks 8–12 after TAA was discontinued (Group 4).
At the time of sacrifice, portal pressure was measured using a 16G angiocatheter introduced into the portal vein to measure the height of a water column. Blood was collected in EDTA containing microfuge tubes, pelleted at 5,000 rpm for 10 minutes, and plasma samples were obtained for AST, ALT, creatinine and bilirubin, and the liver was removed, weighed and processed. Spleen was also removed and weighed before being discarded.
Liver histology and fibrosis quantification
Livers were fixed in 3.7% formalin, embedded in paraffin and sectioned. Liver sections were stained with 0.1% Sirius red in saturated picric acid (both from Sigma Chemical Co.). Four picrosirius red-stained slides per animal were taken, with nine images taken randomly per slide for a total of 36 images per animal for collagen quantification using computerized BIOQUANT Life Science morphometry α system.
Statistical analysis
Data are presented as means ± SD from at least three independent determinations. Comparisons were performed by two-tailed Student’s t-test. Data were considered to be statistically significant with p < 0.05.
Results
Effects of sorafenib on the human stellate cell line, LX-2
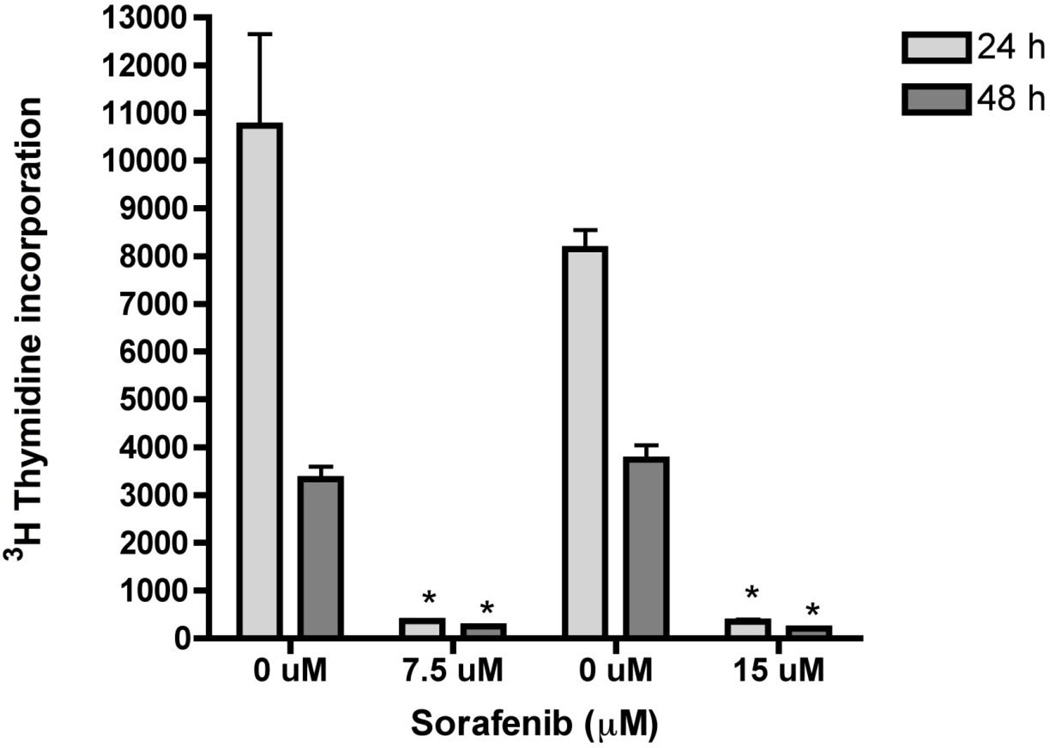
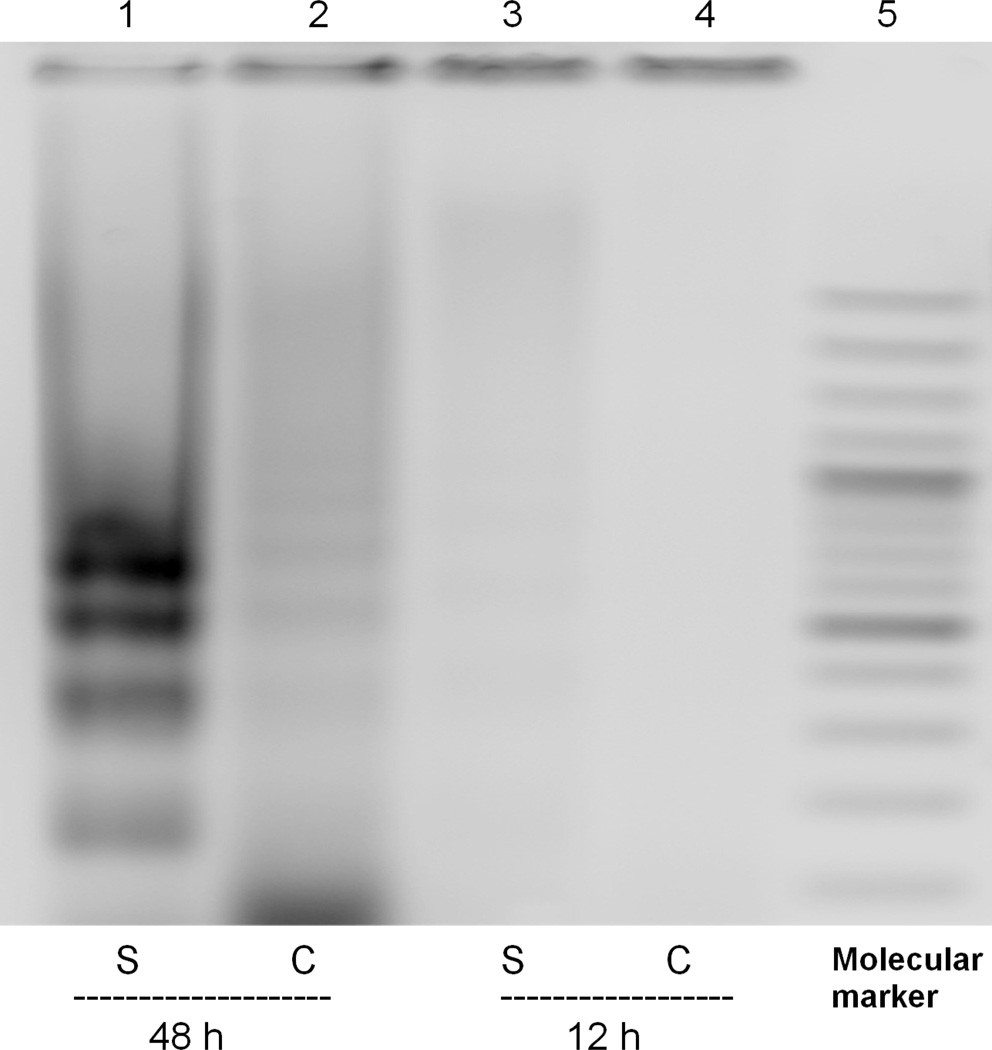
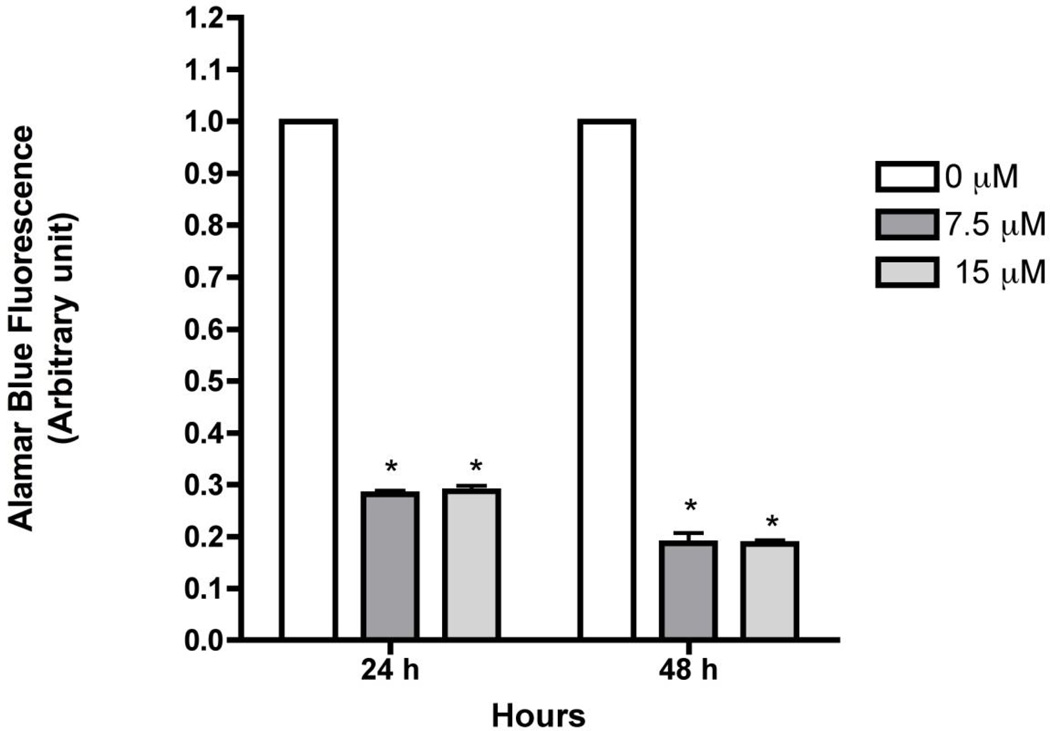
Previous studies demonstrated that sorafenib inhibits cell proliferation and viability in a dose-dependent matter and induces apoptosis in HSCs [12]. Consistent with these results, concentrations of 7.5 µM and 15 µM, sorafenib significantly inhibited LX-2 proliferation by more than 75% at both doses and time points examined (Figure 1). Toxicity was observed as low as 3.5 µM (data not shown). To confirm apoptosis and oxidant stress in presence of sorafenib, DNA fragmentation was detected (Figure 2) at 48 hours, with a significant reduction of mitochondrial activity of up to 80% at 48 hours was also observed (Figure 3).
Figure 1. Sorafenib inhibits HSC proliferation.
LX-2 cells were incubated with 7.5 or 15 µM of sorafenib for 24 and 48 hours. Cell proliferation was assessed via 3H-thymidine was added 4 hour prior to assessment of incorporation. Sorafenib significantly inhibited DNA synthesis at both concentrations for 12 and 24 hours. Values are means ± SD (n=3). *p<0.001 in comparison with control group.
Figure 2. Sorafenib induces apoptosis in LX-2 cells.
LX-2 cells were treated with 15 µM of sorafenib- or vehicle-treated and DNA was isolated. At 48 hours, DNA fragments of ~150 kb were observed in cells treated with sorafenib.
Figure 3. Sorafenib affects cell viability in LX-2 cells.
LX-2 cells were treated with 7.5 and 15 µM for 12 and 24 hours. Cell viability was assessed using alamarBlue® and fluorescence was measured. Cell viability was reduced up to 70% at 24 hours and up to 80% at 48 hours at both concentrations.
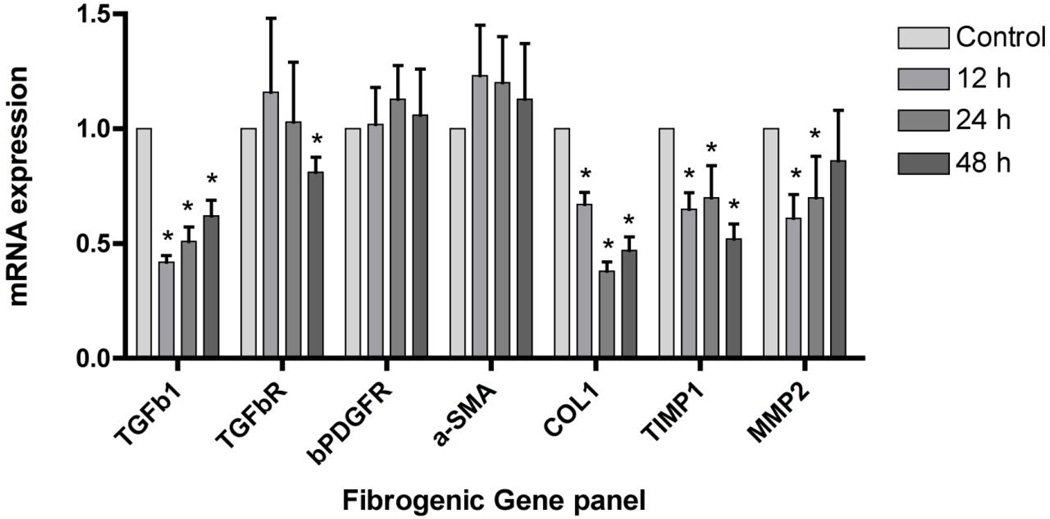
We next assessed the impact of sorafenib on a panel of fibrogenic mRNAs assessed by real time PCR (Figure 4). In cells treated with sorafenib at concentration of 7.5 µM for 12, 24 and 48 hours, there was a consistent down-regulation of mRNAs encoding collagen α1 (I) (Collα1(1)), tissue inhibitor of metalloproteinase type 1 (TIMP1), and matrix metalloproteinase 2 (MMP2). Expression of alpha smooth muscle actin (α-SMA), platelet-derived growth factor receptor-β (β-PDGFR) and transforming growth factor β receptor 1 (TGFβR1) were not affected to the same extent. At 48 hours, there was a slight but significant decrease in mRNA expression for TGFβR1.
Figure 4. Sorafenib down-regulates expression of fibrogenic genes in LX-2 cells.
LX-2 cells were incubated with 7.5 µM of sorafenib for 12, 24, and 48 hours. Sorafenib reduced fibrogenic mRNA expression of Collα1, TIMP1, MMP2. Expression of α-SMA, β-PDGFR and TGFβR1 mRNA were not affected to some extent. At 48 hours, there was a slight but significant decrease in mRNA expression for TGFβR1. n=3. *p<0.001.
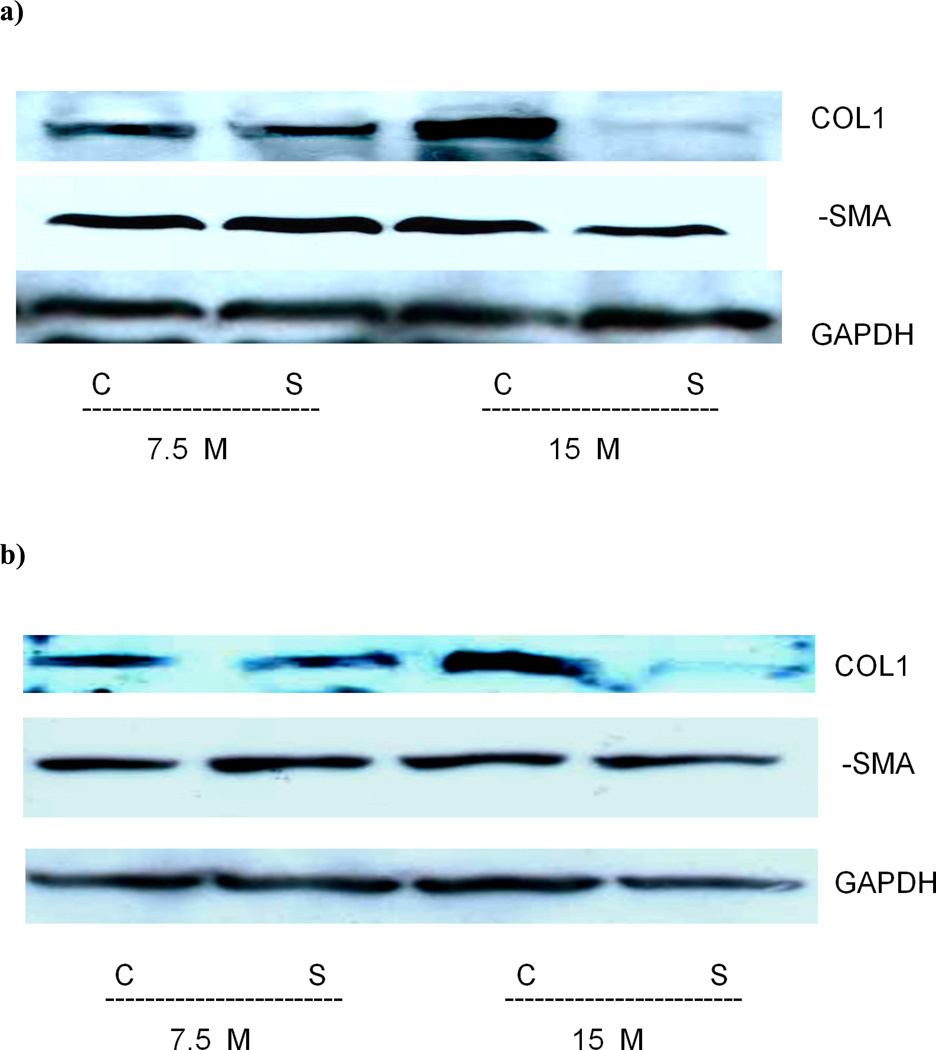
Assessment of Collα1(I) and α-SMA protein expression in LX-2 cells with Western blotting confirmed that sorafenib inhibited Collα1(I) protein expression at 15 µM but not 7.5 µM, while α-SMA expression was slightly inhibited at 24 hours (Figure 5a). This was also shown in primary human stellate cells (HSC) however the α-SMA level was not affected (Figure 5b).
Figure 5. Collagen 1 but not alpha smooth muscle actin protein expression is reduced in LX-2 and human primary cells treated with sorafenib.
Total protein was extracted from LX-2 (5a) or primary human stellate cells (5b) treated with 7.5 and 15 µM for 24 hours. A reduction in Collagen 1 protein is observed at higher concentrations of 15 µM. There was a slight reduction in α-SMA protein detected in primary human stellate cells. GAPDH is used as a reference gene.
Anti-fibrotic effects of sorafenib on hepatic fibrosis induced by TAA in vivo
In order to study the direct effect of sorafenib’s on liver fibrosis, we performed in vivo studies using the rat model of liver injury induced by thioacetamide (TAA) [13, 14]. Sorafenib has not been previously assessed in a parenchymal injury model due to TAA, which more resembles human disease because it less necrotic and inflammatory than CCl4 induced liver injury[13]. Also, spontaneous reversibility is minimal after 5–6 weeks of TAA administration (data not shown). Four different dosing schedules were used in which all animals were administered TAA for eight weeks with either vehicle or sorafenib for 4 or 8 weeks (Supplemental Figure 1): Group 1, a control group where rats were injected with PBS weekly was used for statistical comparison; Group 2: A ‘prophylactic’ regimen in which both TAA and sorafenib were administered concurrently; Group 3: a ‘therapeutic’ regimen in which sorafenib was initiated only 4 weeks after the beginning of a 8 week TAA dosing and continued for another 4 weeks thereafter, and; Group 4: a ‘reversibility’ regimen in which sorafenib was administered for 4 weeks only after completing 8 weeks of TAA.
Combined data from real time PCR, Western blot, Sirius red staining and Bioquant collagen quantitation (Figures 6, 7 and 8) demonstrated that sorafenib was most effective in the ‘therapeutic’ treatment group (Group 3), while the ‘prophylactic’ regimen (Group 2) showed nondose dependent efficacy, whereas the drug was ineffective in the ‘reversibility’ (Group 4) (data not shown).
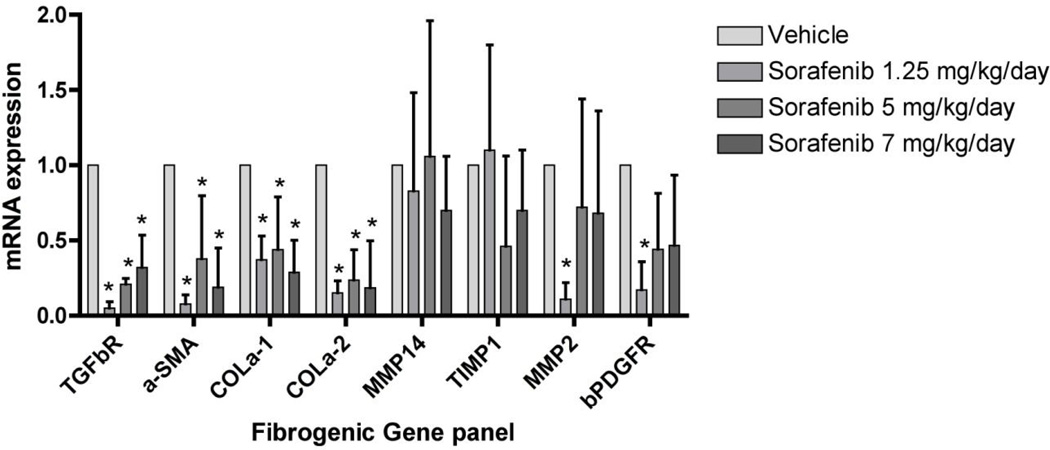
Figure 6. Down-regulation of fibrogenic mRNA expression by sorafenib in TAA-induced hepatic fibrosis in rats.
Real-time PCR was performed to quantify expression of key genes associated with fibrogenesis. Consistent down-regulation of TGF-β1, a-SMA, collagen I were observed while MMP2, TIMP1 and β-PDGFR were down regulated at lower dosages. MMP14 was not affected significantly. n=3. *p<0.001.
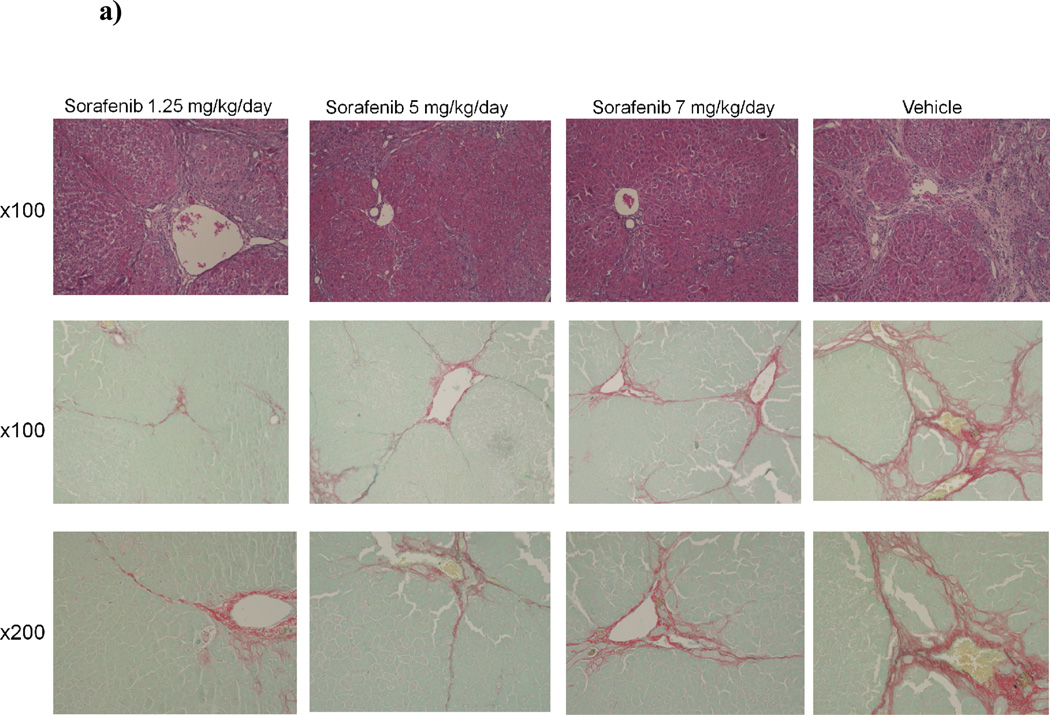
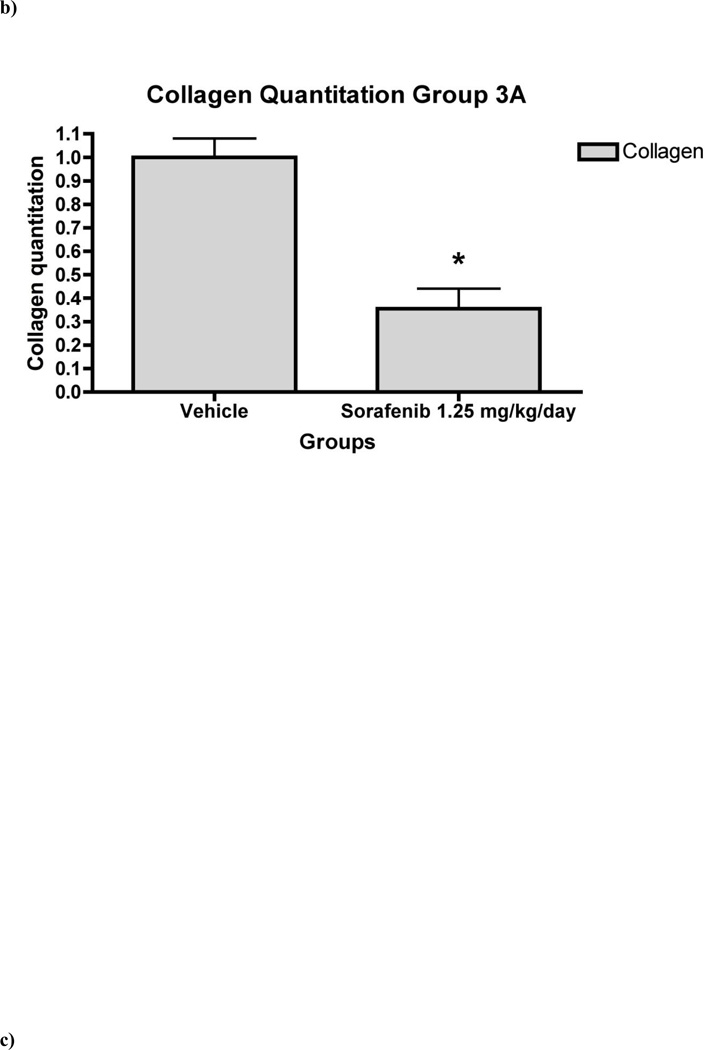
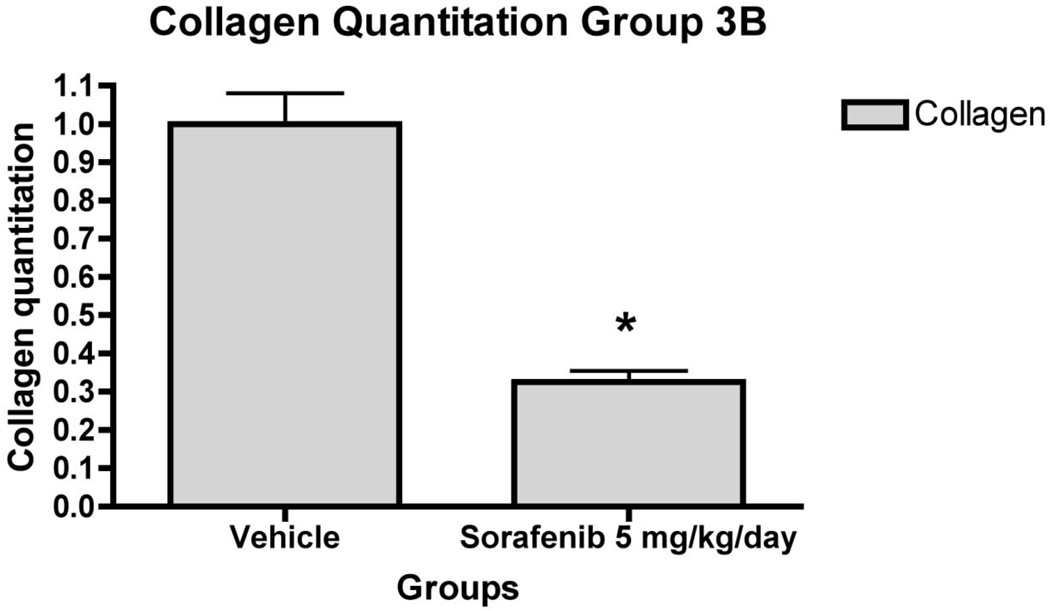
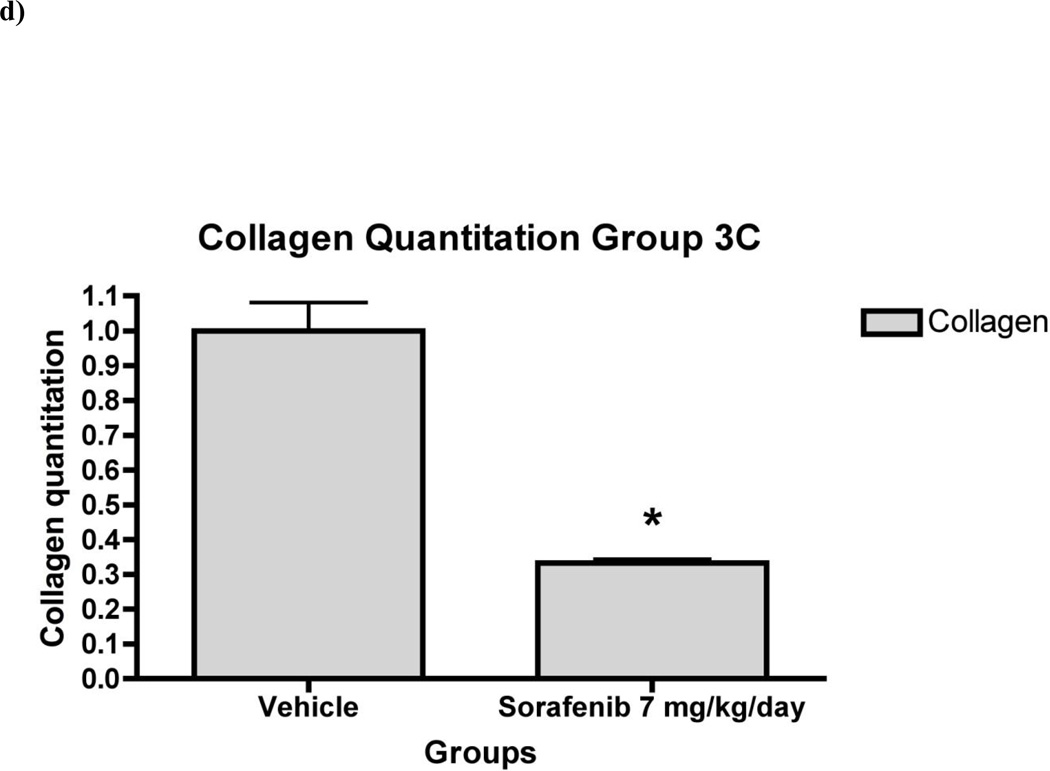
Figure 7. Liver fibrosis was greatly reduced in rat liver tissue in ‘therapeutic’ treatment group.
7a) Histology of rat liver with H&E and Sirius Red in representative liver section from animals in Group 3 at 100X and 200X magnifications. Relative fibrosis area (expressed as a percentage of total liver area) was assessed by analyzing 36 Sirius red-stained liver sections per animal. Each field was acquired at 100X magnification and analyzed using a computerized Bioquant morphometry system. There was a statistically significant difference in fibrosis in the livers of animals treated with 7b) 1.25 mg/kg/day 7c) 5 mg/kg/day and 7d) 7 mg/kg/day of sorafenib. *p <0.001
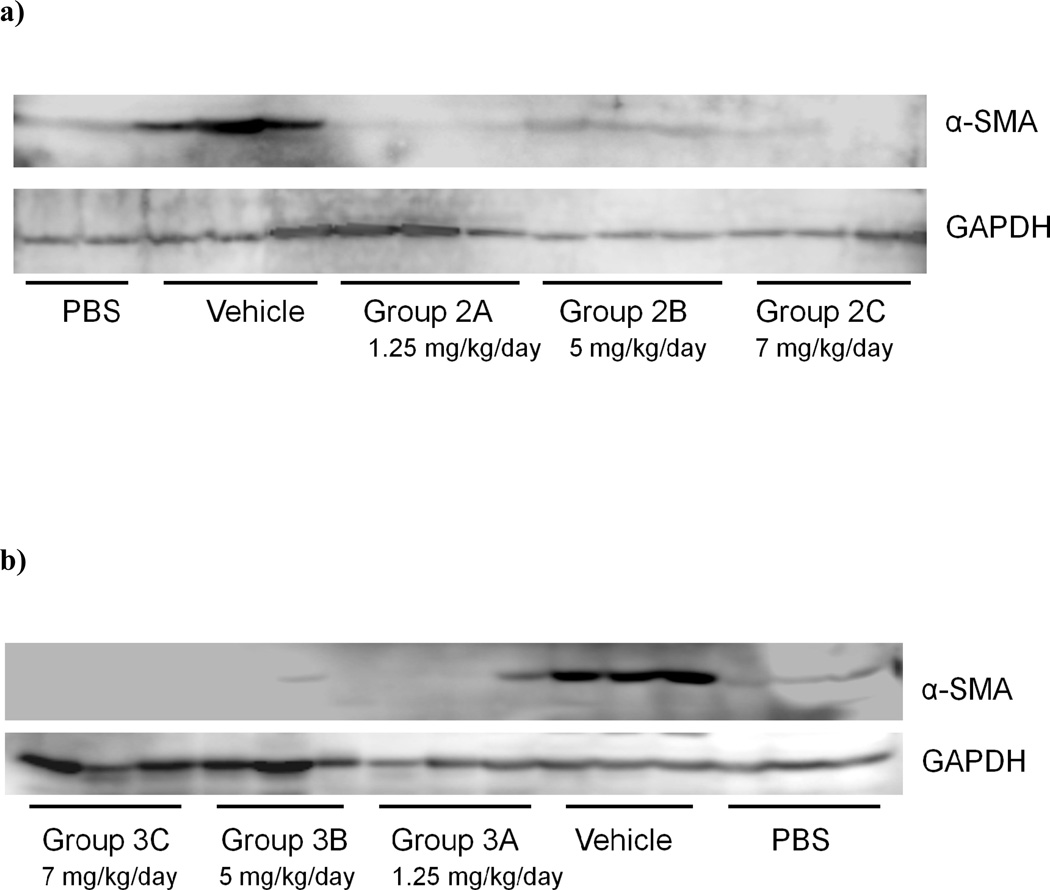
Figure 8. Sorafenib inhibits expression of α-SMA protein in TAA-treated rat liver.
Expression of a-SMA protein in the liver was analyzed by western blot analysis in rats treated with sorafenib at; a) the beginning of TAA treatment, Group 2 and b) during weeks 4–8, Group 3. a-SMA protein expression was reduced significantly compared with rats treated with vehicle.
In the ‘therapeutic’ group (Group 3), there was consistent down-regulation of fibrogenic genes including Collα1(I) and Collα2(I) (Figure 6), consistent with collagen quantitation by morphometry, which documented 70% decrease in collagen area compared to vehicle-injected livers (Figure 7). Sorafenib also down-regulated mRNAs for MMP2, α-SMA, β-PDGFR and TGFβR1 was also measured (Figure 6). There were no significant changes in mRNA expression or collagen reduction in Group 4 (data not shown).
There were no significant differences in the liver weight to body weight ratio in all subgroups except for animals in Group 2 treated with 5 mg/kg/day of sorafenib, where the ratio was reduced compared with the corresponding control vehicle subgroup (Table 1). There were no significant differences in portal pressure between subgroups (see Supplemental Figures 2, 3 and 4).
Table 1.
In vivo studies. Rat body and liver weight and ratio.
| Bodyweight(g) | Liver weight(g) | LW/BW(%) | |
|---|---|---|---|
| Group 1 PBS | 365-34.5 | 11.3-1 | 3.1-0.4 |
| Group 2 A | 321-11.4 | 17-2.6 | 5.3-0.9 |
| Group 2 B | 288-44.1 | 11.2-3.5 | 3.9-0.8* |
| Group 2 C | 229-29.9 | 9.5-3 | 4.2-1.1 |
| Group 2 D | 317-16 | 15-1.4 | 4.7-0.3 |
| Group 3 A | 320-23.8 | 14.3-1.8 | 4.5-0.6 |
| Group 3 B | 319-16.2 | 12.7-3 | 3.9-0.97 |
| Group 3 C | 311-12.8 | 11.3-0.8 | 3.6-0.27 |
| Group 3 D | 342-41 | 14.7-3 | 4.3-1.1 |
| Group 4 A | 368-19.9 | 18-1.6 | 4.9-0.4 |
| Group 4 B | 371-25.4 | 14.6-2.5 | 4.1-0.7 |
| Group 4 C | 354-12.9 | 16.3-1.1 | 4.6-0.3 |
| Group 4 D | 383-13.5 | 16.5-1.9 | 4.3-0.4 |
p<0.05
Sorafenib inhibits expression of α-SMA protein in TAA-treated rat liver
As shown in Figures 8a and 8b, Western blot confirmed that α-SMA was markedly decreased in animals treated with sorafenib either at the beginning of TAA treatment (Group 2) or during weeks 4–8 (Group 3). In contrast, there was no significant effect of sorafenib on α-SMA protein expression when treatment started 8 weeks post TAA administration, where cirrhosis was already established (data not shown).
Discussion
Previous reports have demonstrated that sorafenib inhibits the proliferative activity of tumor cells and HSCs by targeting the tyrosine kinases associated with βPDGF receptor and Raf/ERK signaling pathways[4, 5, 8, 15]. In the present study, we demonstrate that sorafenib inhibited proliferation of a human HSC line by more than 75% at 7.5 and 15 µM within 24 hours, as assessed by 3H thymidine incorporation. In addition to inhibiting HSCs proliferation, sorafenib induced LX-2 cellular apoptosis (Figure 2), an important finding since HSC apoptosis promotes the resolution of liver fibrosis[16].
Activated HSCs produce the bulk of the extracellular matrix (ECM) proteins of the fibrotic liver including fibrillar and non-fibrillar collagens [17, 18]. TGFβ is a pro-fibrogenic cytokine derived from both paracrine and autocrine sources, and is a strong stimulus for collagen 1 production by activated HSCs [19, 20]. In our experiments, sorafenib suppressed TGFβ1 and Coll1 in vivo and in culture, which correlated with changes in protein expression by Western blot (Figures 5 and 8). Sorafenib reduced collagen deposition by more than 60% when begun 4 weeks after TAA administration started (Group 3), with efficacy even at 1.25 mg/kg/day (Figure 7b), as well as at higher doses, based on real time PCR data and collagen quantitation (Figure 7c and 7d). This reduction of collagen deposition was paralleled by a significant suppression of collagen α1(I) and α2(I) mRNAs in whole liver (Figure 6). In addition, decreased pro-fibrogenic mRNAs reflects the inhibition of HSC activation, as documented by reduced levels of αSMA as well as TGFβ1 mRNA expression in liver. Interestingly, the effect on αSMA expression was greater in vivo than in isolated stellate cells, which could suggest that some of the drug’s impact on stellate cell activation are mediated through effects on neighboring cells, especially sinusoidal endothelial cells. In contrast to findings in Group 3, there was no significant effect of sorafenib on fibrogenic gene expression or collagen deposition when treatment begun for 4 weeks after cirrhosis was established after 8 weeks of TAA treatment in Group 4 (data not shown).
Fibrosis reflects a balance between ECM production and degradation mediated by MMPs and TIMPs, which play a key role in collagen degradation[21]. Consistent with earlier studies [12], our results demonstrate that sorafenib significantly decreased TIMP1 mRNA expression in culture-activated HSCs, suggesting that the drug mediates a reduction in collagen deposition both by reducing type I collagen synthesis directly and indirectly by possibly increasing net matrix protease activity through decreased expression of TIMP-1, a key metalloproteinase inhibitor.
Our findings greatly refine the optimal parameters of clinical trials to assess sorafenib as an antifibrotic in human chronic liver disease. A primary effect on HSC activation in culture and in vivo is consistent with the drug’s efficacy when administered during ongoing liver injury but not in established cirrhosis. Moreover, the lack of effects on serum AST and ALT indicate that sorafenib is primarily antifibrotic through its effects on fibrogenesis rather than by attenuating liver injury. Importantly, the drug’s efficacy at relatively low doses means that antifibrotic dosing in humans can be lower than what is currently used for HCC treatment, which should improve tolerability and compliance. Moreover, the goal of antifibrotic therapy is to attenuate the rate of fibrosis progression but not necessarily to eliminate it altogether. With this goal in mind, the evaluation of sorafenib as an antifibrotic in humans merits further evaluation.
Supplementary Material
Acknowledgments
Statement of Interest
This work was supported by a research contract from Bayer-Onyx (10-0752) to the Division of Liver Diseases, Mount Sinai School of Medicine. Scott Friedman is a consultant to Bayer-Onyx and a member of an Expert Advisory Board. Bayer-Onyx personnel had no input regarding generation or interpretation of data or preparation of the manuscript.
Footnotes
All writing, data collection and analysis were performed by the authors.
REFERENCES
- 1.Lee UE, Friedman SL. Mechanisms of hepatic fibrogenesis. Best practice & research. Clinical gastroenterology. 2011;25(2):195–206. doi: 10.1016/j.bpg.2011.02.005. [DOI] [PMC free article] [PubMed] [Google Scholar]
- 2.Wong L, et al. Induction of beta-platelet-derived growth factor receptor in rat hepatic lipocytes during cellular activation in vivo and in culture. The Journal of clinical investigation. 1994;94(4):1563–1569. doi: 10.1172/JCI117497. [DOI] [PMC free article] [PubMed] [Google Scholar]
- 3.Pinzani M, Marra F. Cytokine receptors and signaling in hepatic stellate cells. Seminars in liver disease. 2001;21(3):397–416. doi: 10.1055/s-2001-17554. [DOI] [PubMed] [Google Scholar]
- 4.Borkham-Kamphorst E, et al. Pro-fibrogenic potential of PDGF-D in liver fibrosis. Journal of hepatology. 2007;46(6):1064–1074. doi: 10.1016/j.jhep.2007.01.029. [DOI] [PubMed] [Google Scholar]
- 5.Wilhelm SM, et al. Preclinical overview of sorafenib, a multikinase inhibitor that targets both Raf and VEGF and PDGF receptor tyrosine kinase signaling. Molecular cancer therapeutics. 2008;7(10):3129–3140. doi: 10.1158/1535-7163.MCT-08-0013. [DOI] [PubMed] [Google Scholar]
- 6.Llovet JM, et al. Sorafenib in advanced hepatocellular carcinoma. The New England journal of medicine. 2008;359(4):378–390. doi: 10.1056/NEJMoa0708857. [DOI] [PubMed] [Google Scholar]
- 7.Escudier B, et al. Sorafenib in advanced clear-cell renal-cell carcinoma. The New England journal of medicine. 2007;356(2):125–134. doi: 10.1056/NEJMoa060655. [DOI] [PubMed] [Google Scholar]
- 8.Liu L, et al. Sorafenib blocks the RAF/MEK/ERK pathway, inhibits tumor angiogenesis, and induces tumor cell apoptosis in hepatocellular carcinoma model PLC/PRF/5. Cancer research. 2006;66(24):11851–11858. doi: 10.1158/0008-5472.CAN-06-1377. [DOI] [PubMed] [Google Scholar]
- 9.Thabut D, et al. Complementary vascular and matrix regulatory pathways underlie the beneficial mechanism of action of sorafenib in liver fibrosis. Hepatology. 2011;54(2):573–585. doi: 10.1002/hep.24427. [DOI] [PMC free article] [PubMed] [Google Scholar]
- 10.Friedman SL, et al. Isolated hepatic lipocytes and Kupffer cells from normal human liver: morphological and functional characteristics in primary culture. Hepatology. 1992;15(2):234–243. doi: 10.1002/hep.1840150211. [DOI] [PubMed] [Google Scholar]
- 11.Xu L, et al. Human hepatic stellate cell lines, LX-1 and LX-2: new tools for analysis of hepatic fibrosis. Gut. 2005;54(1):142–151. doi: 10.1136/gut.2004.042127. [DOI] [PMC free article] [PubMed] [Google Scholar]
- 12.Wang Y, et al. New insights into the antifibrotic effects of sorafenib on hepatic stellate cells and liver fibrosis. Journal of hepatology. 2010;53(1):132–144. doi: 10.1016/j.jhep.2010.02.027. [DOI] [PubMed] [Google Scholar]
- 13.Muller A, et al. Thioacetamide-induced cirrhosis-like liver lesions in rats--usefulness and reliability of this animal model. Experimental pathology. 1988;34(4):229–236. doi: 10.1016/s0232-1513(88)80155-5. [DOI] [PubMed] [Google Scholar]
- 14.Li X, Benjamin IS, Alexander B. Reproducible production of thioacetamide-induced macronodular cirrhosis in the rat with no mortality. Journal of hepatology. 2002;36(4):488–493. doi: 10.1016/s0168-8278(02)00011-9. [DOI] [PubMed] [Google Scholar]
- 15.Wilhelm SM, et al. BAY 43-9006 exhibits broad spectrum oral antitumor activity and targets the RAF/MEK/ERK pathway and receptor tyrosine kinases involved in tumor progression and angiogenesis. Cancer research. 2004;64(19):7099–7109. doi: 10.1158/0008-5472.CAN-04-1443. [DOI] [PubMed] [Google Scholar]
- 16.Iredale JP, et al. Mechanisms of spontaneous resolution of rat liver fibrosis. Hepatic stellate cell apoptosis and reduced hepatic expression of metalloproteinase inhibitors. The Journal of clinical investigation. 1998;102(3):538–549. doi: 10.1172/JCI1018. [DOI] [PMC free article] [PubMed] [Google Scholar]
- 17.Parola M, Marra F, Pinzani M. Myofibroblast - like cells and liver fibrogenesis: Emerging concepts in a rapidly moving scenario. Molecular aspects of medicine. 2008;29(1–2):58–66. doi: 10.1016/j.mam.2007.09.002. [DOI] [PubMed] [Google Scholar]
- 18.Friedman SL. Molecular regulation of hepatic fibrosis, an integrated cellular response to tissue injury. The Journal of biological chemistry. 2000;275(4):2247–2250. doi: 10.1074/jbc.275.4.2247. [DOI] [PubMed] [Google Scholar]
- 19.Zavadil J, Bottinger EP. TGF-beta and epithelial-to-mesenchymal transitions. Oncogene. 2005;24(37):5764–5774. doi: 10.1038/sj.onc.1208927. [DOI] [PubMed] [Google Scholar]
- 20.Garcia-Trevijano ER, et al. Transforming growth factor beta1 induces the expression of alpha1(I) procollagen mRNA by a hydrogen peroxide-C/EBPbetadependent mechanism in rat hepatic stellate cells. Hepatology. 1999;29(3):960–970. doi: 10.1002/hep.510290346. [DOI] [PubMed] [Google Scholar]
- 21.Yoshiji H, et al. Tissue inhibitor of metalloproteinases-1 attenuates spontaneous liver fibrosis resolution in the transgenic mouse. Hepatology. 2002;36(4 Pt 1):850–860. doi: 10.1053/jhep.2002.35625. [DOI] [PubMed] [Google Scholar]
Associated Data
This section collects any data citations, data availability statements, or supplementary materials included in this article.


