Abstract
The regulation of the inner medullary collecting duct (IMCD) urea transporters (UT-A1, UT-A3) and aquaporin-2 (AQP2) and their interactions in diabetic animals is unknown. We investigated whether the urine concentrating defect in diabetic animals was a function of AQP2, the UT-As, or both transporters. UT-A1/UT-A3 knockout (UT-A1/A3 KO) mice produce dilute urine. We gave wild-type (WT) and UT-A1/A3 KO mice vasopressin via minipump for 7 days. In WT mice, vasopressin increased urine osmolality from 3,000 to 4,550 mosmol/kgH2O. In contrast, urine osmolality was low (800 mosmol/kgH2O) in the UT-A1/A3 KOs and remained low following vasopressin. Surprisingly, AQP2 protein abundance increased in UT-A1/A3 KO (114%) and WT (92%) mice. To define the role of UT-A1 and UT-A3 in the diabetic responses, WT and UT-A1/A3 KO mice were injected with streptozotocin (STZ). UT-A1/A3 KO mice showed only 40% survival at 7 days post-STZ injection compared with 70% in WT. AQP2 did not increase in the diabetic UT-A1/A3 KO mice compared with a 133% increase in WT diabetic mice. Biotinylation studies in rat IMCDs showed that membrane accumulation of UT-A1 increased by 68% in response to vasopressin in control rats but was unchanged by vasopressin in diabetic rat IMCDs. We conclude that, even with increased AQP2, UT-A1/UT-A3 is essential to optimal urine concentration. Furthermore, UT-A1 may be maximally membrane associated in diabetic rat inner medulla, making additional stimulation by vasopressin ineffective.
Keywords: urea transporter-A1/A3 knockout, diabetes, aquaporin-2, phosphorylated serine-256-aquaporin-2, phosphorylated serine-486-urea transporter-A1, vasopressin
in the collecting duct, there are two main transporter families that contribute to producing concentrated urine: aquaporins (AQP) and urea transporters (UT). The collecting duct is unable to reabsorb water in the absence of vasopressin (AVP), but the permeability to water increases significantly in the presence of AVP (14). AVP binds to V2 receptors in the basolateral membrane of collecting duct principal cells. Through a G protein-coupled pathway, adenylyl cyclase is stimulated, producing an increase in cAMP. The cAMP-dependent protein kinase A (PKA) phosphorylates AQP2, leading to its insertion in the apical plasma membrane of collecting duct principal cells. This leads to water reabsorption from the tubular lumen into the inner medullary tissue. Therefore, AVP regulates water reabsorption by regulating trafficking of AQP2 between subapical vesicles and the apical plasma membrane (16).
In the inner medullary collecting duct (IMCD), UT-A1 moves to the apical plasma membrane in response to AVP (18). Similar to the mechanism by which AQP2 is activated, AVP phosphorylates UT-A1 at serines-486 and -499 through PKA (2). Phosphorylated UT-A1 moves to the apical plasma membrane and causes reabsorption of urea from the tubular lumen and, in conjunction with UT-A3, moves it into the medullary interstitium. This results in an increase in the concentration of the medullary interstitium, ultimately resulting in reabsorption of water (11). Therefore, the ability to concentrate urine requires coordinated actions by AQP and UT. Both mechanisms are AVP and phosphorylation dependent. AVP increases the phosphorylation of AQP2, promoting apical membrane insertion and increased water reabsorption. AVP also promotes UT-A1 phosphorylation, membrane accumulation, and increased urea reabsorption.
Regulation of AQP2 is believed to be controlled by membrane trafficking, which involves phosphorylation at various serines. There are four serines in the carboxyl terminal chain that have been identified: serines-256, -261, -264, and -269 (6, 7, 9). Although they are all AVP sensitive, they have different modes of action. Phosphorylation at serines-256, -264, and -269 is increased in response to AVP. whereas phosphorylation at serine-261 decreases in response to AVP (7–9). While we know that phosphorylation of UT-A1 promotes its membrane insertion, we do not know if diabetes affects phosphorylation or membrane insertion of UT-A1. It is also unclear whether the level of activity of AQP2 affects UT-A1 phosphorylation in the diabetic animal.
Diabetes is a global health problem that affects multiple organ systems. In the kidney, diabetes is known to cause proteinuria, nephrotic syndrome, and may ultimately result in renal failure. Diabetic patients also present with polyuria and a reduced urine concentrating ability. Patients with poorly controlled diabetes are polyuric and develop a concentrating defect, but, with strict glycemic control, urine concentration improves with better salt and water conservation. However, under strenuous conditions such as extremes of temperature or lack of access to hydration, diabetics become more susceptible to developing a concentrating defect. It seems unlikely that deficiencies in AVP are responsible for the concentrating defect in diabetes since AVP levels are not suppressed in the diabetic animal (10). However, AVP does increase urea permeability in diabetic rats (18). Diabetic rats are able to maintain urine osmolality (850–900 mosmol/kgH2O) above plasma levels despite polyuria. This ability has been attributed, at least in part, to the upregulation of both UT-A1 and AQP2 protein abundances (1, 10, 15). However, the degree to which each of these proteins contributes to the maintenance of urine osmolality is unknown.
Our objective in this study was initially to verify that both AQP and UT are needed to produce concentrated urine using UT-A1/UT-A3 knockout (UT-A1/A3 KO) mice. We further examined the interdependence of AQP2 and its phosphorylated forms and the UT-A proteins in the urine concentration response in the diabetic kidney. Finally, we determined if the AVP-stimulated membrane insertion of UT-A1 is altered in response to diabetes mellitus (DM).
MATERIALS AND METHODS
Experimental animals.
All animal protocols were approved by the Emory University Institutional Animal Care and Use Committee. UT-A1/A3 KO mice were established by Fenton et al. (3, 5). Male UT-A1/A3 KO mice were a generous gift from Dr. Mark Knepper, National Institutes of Health. These mice were mated with C57BL6 female wild-type (WT) mice to produce a heterozygous litter. The heterozygous litter was mated, and the offspring were tested to select those that had complete absence of the UT-A1 and UT-A3 transporters. The homozygous offspring were mated repeatedly until we had pure progeny of UT-A1/A3 KO mice. The absence of UT-A1 and UT-A3 in the inner medulla (IM) was confirmed by Western blot of tissue lysates.
Characterization of UT-A1/A3 KO mice.
The mice were placed in metabolic cages for 24 h of acclimatization, followed by a 24-h collection period. Urine was collected for volume and osmolality measurement using a Wescor vapor pressure osmometer. After the 24-h collection period, animals were killed, and various organs were dissected and weighed.
AVP stimulation of AQP2 in UT-A1/A3 KO mice.
WT and UT-A1/A3 KO mice were given free access to food and water. The mice were placed in metabolic cages, and urine was collected from the two groups for baseline levels. To administer AVP, minipumps (Alzet model 2002; Durect, Cupertino, CA) delivering AVP at 5 ng/h (Sigma, St. Louis, MO) were implanted subcutaneously under light ketamine anesthesia. After the 7-day treatment with AVP, the mice were again placed in metabolic cages for 24-h urine collection. Subsequently, the animals were killed, kidneys were harvested, IM were dissected, and tissue lysates were prepared. After protein determination by BCA colorimetric protein assay (Bio-Rad, Hercules, CA), the proteins were size separated by SDS-PAGE and electroblotted to polyvinylidene difluoride membranes (Millipore, Bedford, MA). Membranes were probed with primary antibody to AQP2 overnight at 4°C. The secondary antibody used for detection was Alexa Fluor 680-linked anti-rabbit IgG (Invitrogen, Chicago, IL). Proteins were visualized using infrared detection with the LI-COR Odyssey protein analysis system (LI-COR, Lincoln, NE). Quantification of the resulting bands was accomplished using the LICOR internal densitometry program.
Response of UT-A1/A3 KO mice to diabetes.
WT and UT-A1/A3 KO mice were individually housed in metabolic cages for 24 h for baseline urine collection. After 24 h, they were injected intraperitoneally with streptozotocin (STZ), 175 mg/kg body wt in 0.1 M citrate buffer (pH 4.0), to induce type 1 diabetes. Elevated blood glucose was confirmed by tail blood after 24–48 h (One Touch Profile Diabetes Tracking Kit; Lifescan, Milpitas, CA). Twenty-four hours before death and 6 days after STZ injection, the animals were placed in metabolic cages, and urine was collected for volume and osmolality determination. The animals were killed after 7 days or when humane end points were reached so survival was monitored for only 1 wk. Diabetes was confirmed by checking blood glucose at the time of death. The IMs were dissected, and tissue lysates were prepared for Western blot analysis. Western blots were probed for AQP2, phosphorylated (p) serine (ser) 256-AQP2 (a generous gift from Dr. Rikke Nørregaard, University of Aarhus), pser261-AQP2, pser264-AQP2, and pser269-AQP2 (PhosphoSolutions, Aurora, CO).
Animal preparation for membrane accumulation experiments.
Sprague Dawley rats were injected intravenously with STZ (65 mg/kg) in fresh citrate buffer via tail vein. Blood glucose was checked at 24–48 h to confirm diabetes. Animals found not to be diabetic were reinjected with half the prior dose by tail vein or the full dose via intraperitoneal injection, and elevated blood glucose was verified after 24 h. After 3 wk, the animals were killed, and the kidneys were harvested. IMCD suspensions were prepared by enzyme digest as previously described (19).
Biotinylation.
IMCD suspensions from control and diabetic rat kidneys were biotinylated as previously described (12). Briefly, suspended tubules were treated for 20 min at 37°C with 100 nM AVP. Next, samples were washed free of excess solution two times with PBS and three times with biotinylation buffer without biotin (mM: 215 NaCl, 4 KCl, 1.2 MgSO4, 2 CaCl2, 5.5 glucose, 10 triethanolamine, and 2.5 Na2HPO4) and then incubated with biotinylation buffer containing 3 mg/ml biotinamidohexanoic acid 3-sulfo-N-hydroxysuccinimide ester (Sigma-Aldrich, St. Louis, MO) and 100 nM AVP for 60 min at 4°C. The samples were then washed free of unattached biotin with biotin quenching buffer, washed with lysis buffer without detergent, and solubilized for 1 h in lysis buffer containing 1% Nonidet P-40. After centrifugation (14,000 g, 10 min, 4°C) to remove insoluble particulates, streptavidin beads were added and allowed to absorb biotinylated proteins overnight at 4°C. After washing with high-salt and no-salt buffers, Laemmli SDS-PAGE sample buffer was added directly to the pellets, samples were boiled for 1 min, and the pool of biotinylated proteins was analyzed by Western blot. Western blots of the biotinylated proteins were probed with antibodies to total UT-A1 and UT-A1 phosphorylated on serine-486.
Immunohistochemistry.
Sprague-Dawley rats were injected intravenously with STZ (65 mg/kg) in fresh citrate buffer via tail vein. Blood glucose was checked at 24–48 h to confirm diabetes. Control and diabetic Sprague-Dawley rats were injected with AVP subcutaneously 45 min before perfusion and paraformaldehyde fixation. The animals were killed, and their kidneys were perfusion fixed with paraformaldehyde. Paraffin sections of 4 μm thickness were sliced. Sections were dewaxed and hydrated in preparation for immunostaining as previously described (13). Sections were incubated overnight at 4°C with the following primary antibodies: UT-A1 and pser486-UT-A1. Slides were washed free of primary antibody and then incubated for 2 h in peroxidase-conjugated secondary antibody (donkey anti-rabbit IgG). Diaminobenzidine and 35% H2O2 were added to detect peroxidase activity identifying the primary antibodies. Slides were also stained with Mayers hematoxylin to visualize nuclei. Stained sections were visualized using a bright field on an Olympus inverted microscope IX71 and a SPOT camera at ×400 magnification.
Statistical analysis.
All data are presented as means ± SE, and n is the number of animals. To test for the statistical significance between the results from two groups, Student's t-test was used. The criterion for statistical significance was P < 0.05.
RESULTS
Characteristics of the UT-A1/A3 KO.
We assessed the various tissues in this strain of KO mice and compared our results with the original strain reported by Fenton et al. (4). The only difference in organ weights between our KO strain and the Fenton KO strain was in kidney weight. The Fenton KO strain had reduced weights compared with the WT while our KO strain showed no difference in size compared with the WT mice. Table 1 shows the average weights of different organs in our UT-A1/A3 KO strain compared with C57BL6 WT mice. The testes were significantly larger in the KO mice compared with the WT, even when this was normalized by brain weight. The kidney weights showed no difference between KO and WT strains.
Table 1.
Organ weight: UT-A1/A3 knockout mice vs. wild-type mice
| Wild Type | UT-A1/A3 Knockout | |
|---|---|---|
| Body wt, g | 22.7 ± 0.8 | 23.25 ± 0.28 |
| Kidney, g | 0.32 ± 0.02 | 0.34 ± 0.04 |
| Liver, g | 1.00 ± 0.05 | 1.1 ± 0.03 |
| Spleen, g | 0.062 ± 0.004 | 0.06 ± 0.003 |
| Testes, g | 0.016 ± 0.005 | 0.28 ± 0.004* |
| Heart, g | 0.13 ± 0.01 | 0.15 ± 0.005 |
| Brain, g | 0.32 ± 0.006 | 0.324 ± 0.006 |
| Thymus, g | 0.05 ± 0.004 | 0.05 ± 0.004 |
| Gastronemius, g | 0.13 ± 0.003 | 0.13 ± 0.006 |
Values are means ± SE; n = 6 mice/group. UT, urea transporter.
Statistically significant difference with P < 0.0001.
AVP increases stimulation of AQP2 only in the WT mice.
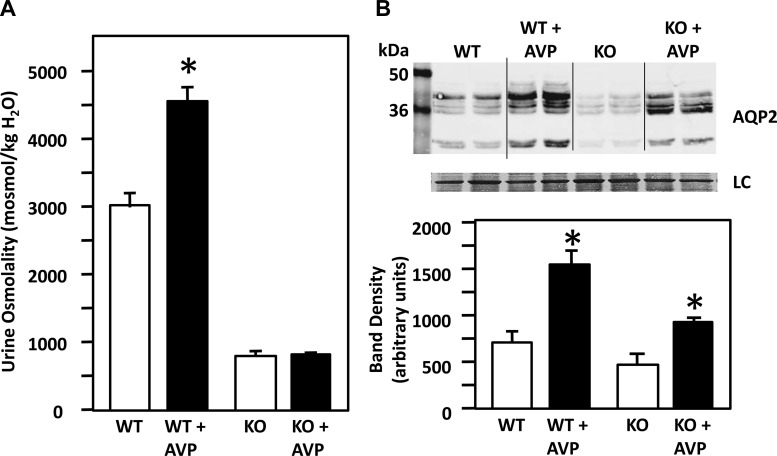
Following the 7-day treatment with AVP in WT and UT-A1/A3 KO mice, we found that urine osmolality of the WT mice increased by 51%, whereas that of the KO mice showed no change (Fig. 1A). The WT mice were able to increase their urine osmolality from 3,000 to 4,550 mosmol/kgH2O, whereas the KO remained low at 800 mosmol/kgH2O. We measured the baseline AVP levels and found that UT-A1/A3 KO mice do have significantly higher AVP levels than WT mice (AVP: WT = 14.96 ± 2.19 pg/ml, n = 4; UT-A1/A3 KO = 25 ± 3.09 pg/ml, n = 4, P = 0.03). However, when we compared AQP2 protein abundance between these two groups, we found that AVP significantly increased AQP2 protein abundance (densitometry in arbitrary units) in both WT and UT-A1/A3 KO mice (Fig. 1B). Statistical evaluation reveals that the 92% increase in response to AVP in the KO animals is significantly less than the 114% increase in the control animals (n = 4/condition, P < 0.01).
Fig. 1.
The effect of vasopressin (AVP) on the urea transporter (UT)-A1/A3 knockout (KO) mice. A: graph showing urine osmolality in C57BL6 wild-type (WT) and UT-A1/A3 KO mice ± a 7-day AVP treatment. Urine osmolality in the UT-A1/A3 KO mice remained low (800 mosmol/kgH2O) following AVP treatment, whereas in WT mice, urine osmolality increased from 3,000 to 4,550 mosmol/kgH2O with AVP treatment. B: top, Western blot of tissue lysate from WT and UT-A1/A3 KOs, with and without AVP treatment probed for aquaporin (AQP) 2. Each lane contains a sample from a different animal. Immediately below is the loading control (LC) showing total protein (Ponceau) stained on the same membrane. Bottom, bar graph showing combined mean densities ± SE from 2 experiments; n = 4/condition. *P < 0.05. AQP2 abundance increased in both WT and UT-A1/A3 KO mice following 7-day AVP treatment.
Diabetes reduces survival of UT-A1/A3 KO mice.
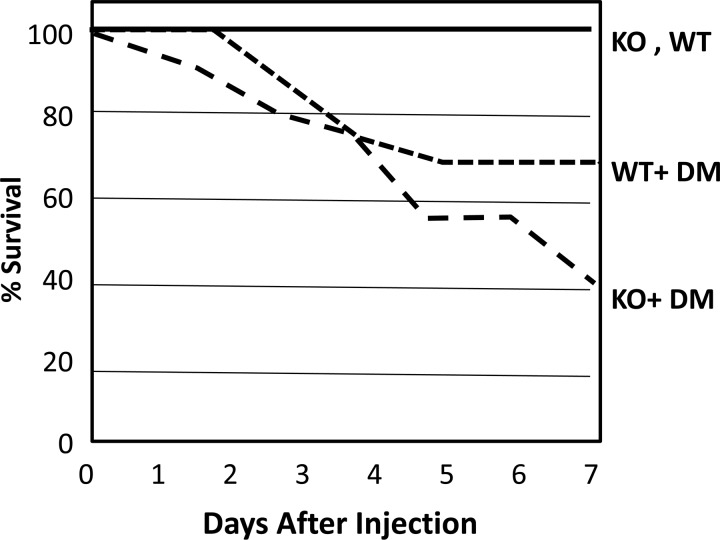
The average blood glucose level of the mice 48 h after injection of STZ were as follows: control WT, 114.5 mg/dl; diabetic WT, 299.8 mg/dl; UT-A1/A3 KO, 99.3 mg/dl; diabetic UT-A1/A3 KO, 294.5 mg/dl, n = 4–8. The apparently high dose of STZ, 175 mg/kg, was used in the C57BL6 strain of WT and KO because lower doses were ineffective in inducing diabetes. At day 7, 100% of the control WT and UT-A1/A3 KO mice were still alive. However, induction of diabetes reduced survival of the mice. UT- A1/A3 KO mice showed 40% survival at 7 days post-STZ injection compared with 70% survival in WT (Fig. 2). Diabetes resulted in reduced survival of both WT and KO mice, but its effect was more pronounced in the KO group. In observing the mice, the WT mice with diabetes appeared to stabilize over time after STZ injection while the KO animals appeared to get progressively worse. We previously showed that an upregulation of UT-A1 is part of the compensatory response to DM (10). The present findings in the UT-A1/A3 KO suggest that, without this compensatory response, the animal becomes sicker, rather than stabilizing at 7 days. An alternative explanation, which seems less likely, is that UT-A1/A3 KO mice are more sensitive to STZ toxicity than WT mice through an unknown, non-DM mechanism. We chose to study mice at 7 days post-STZ to avoid mice that were too sickly. To verify that the mice were not experiencing overriding impaired renal function, we measured serum creatinines and calculated creatinine clearances in an attempt to assess their renal function. Serum creatinines in the mice were very similar with no statistically significant difference between the groups. The average serum creatinine was of 0.1 mg/dl in the control WT, control UT-A1/A3 KO, and the diabetic UT-A1/A3 mice (n = 3/group, data not shown). The calculated creatinine clearances of the mice were as follows: control WT = 0.48 ± 0.13 ml/min, control UT-A1/A3 KO = 0.53 ± 0.11 ml/min, diabetic UT-A1/A3 KO = 0.82 ± 0.23 ml/min, n = 2–4/group. The creatinine clearance for the diabetic WT mice was not available for analysis. There were no significant differences between the creatinine clearance of the KO diabetic and control mice and the WT control mice.
Fig. 2.
The effect of diabetes on mouse survival. This shows a line graph depicting the survival of WT and UT-A1/A3 KO mice over 7 days after streptozotocin (STZ) injection to induce diabetes mellitus (DM). WT and UT-A1/A3 KO control mice showed 100% survival. Induction of diabetes reduced survival of UT-A1/A3 KO mice to 40% compared with 70% in WT diabetics, i.e., of a group of 18 in the diabetic UT-A1/A3 KO mouse group, only 7 remained by day 7 (n = 16–18/group).
Diabetes decreases urine osmolality in both UT-A1/A3 KO and WT but does not change AQP2 abundance in the KO.
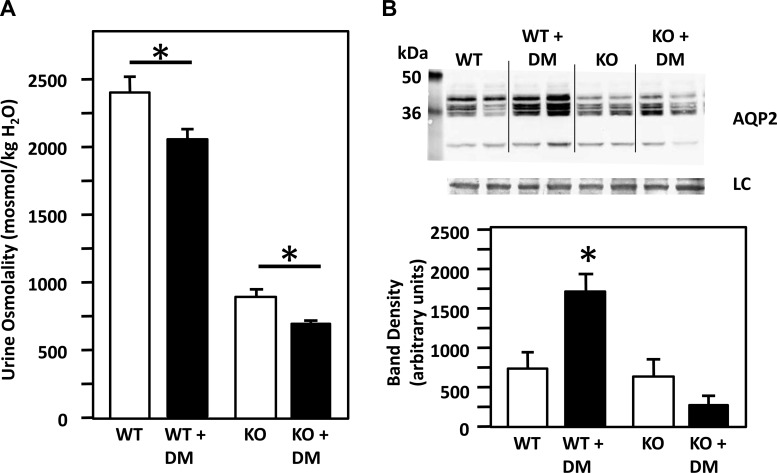
The urine osmolality of WT and diabetic mice was compared following the induction of diabetes. Diabetes significantly decreased the urine osmolality of the UT-A1/A3 KO mice (control UT-A1/A3 KO = 899 ± 59 mosmol/kgH2O, UT-A1/A3 diabetic mice = 715 ± 11 mosmol/kgH2O, n ≥ 23/group, P < 0.03). The WT mice also showed a decrease in urine osmolality of 19% when they were treated with STZ (WT = 2,407 ± 97 mosmol/kgH2O, diabetic WT = 2,053 ± 91 mosmol/kgH2O, n = 17–22/group, P < 0.01). The diabetes-induced decrease in urine osmolality was more pronounced in the UT-A1/A3 KO mice compared with the WT mice (Fig. 3A). We further compared AQP2 abundance in UT-A1/A3 KO mice and WT mice, with and without diabetes. There was a greater than twofold increase in AQP2 in the WT diabetic mice compared with the nondiabetic WT group, but there was no change in AQP2 abundance in the UT-A1/A3 KO diabetic mice compared with the nondiabetic UT-A1/A3 KO mice (Fig. 3B).
Fig. 3.
A: diabetes (DM) decreases urine osmolality in both WT and UT-A1/A3 KO mice. The bar graph shows the urine osmolality of WT and UT-A1/A3 KO control and DM mice. Diabetes significantly decreased the urine osmolality of the WT and UT-A1/A3 KO mice (bar graph showing means ± SE, n ≥ 23/group, *P < 0.03). B: diabetes increases AQP2 protein levels in WT but not in UT-A1/A3 KO mice. Top, Western blot of tissue lysate from WT and UT-A1/A3 KO mice, with and without diabetes, probed for AQP2. Each lane is loaded with a sample from a different animal. Immediately below is the loading control (LC). Bottom, bar graph showing combined mean densities ± SE from 2 experiments; n = 4/condition. *P < 0.05.
pser256-AQP2 abundance was lower in the UT-A1/A3 KO mice compared with the WT mice, and the KO mice were unable to increase pser256-AQP2 in response to diabetes unlike the WT mice.
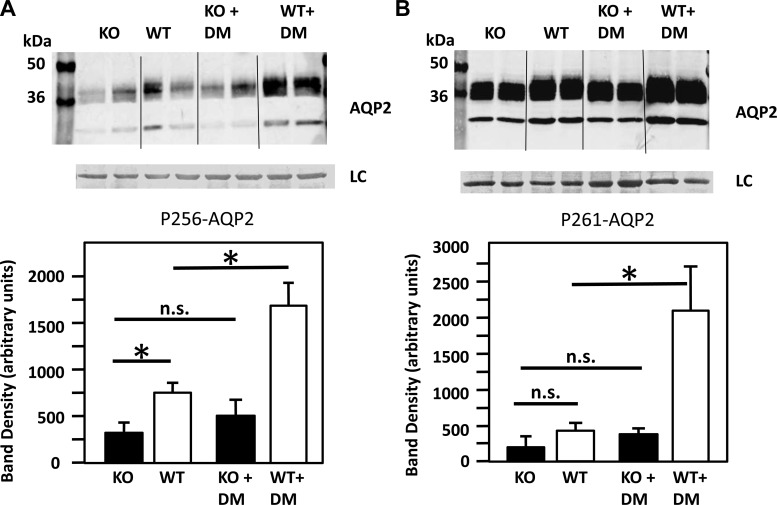
In the nondiabetic animals, pser256-AQP2 abundance was ∼50% lower in the UT-A1/A3 KO compared with the WT mice (P < 0.05, Fig. 4A). In the diabetic animals, pser256-AQP2 abundance was lower in the UT-A1/A3 KO by 68% compared with the WT mice (P < 0.001). pser256-AQP2 was lower in the UT-A1/A3 KO vs. WT mice and did not increase in the KO mice with diabetes. However, in the WT mice, the amount of pser256-AQP2 was increased 2.3-times in response to diabetes.
Fig. 4.
The effect of diabetes (DM) on the abundance of phosphorylated AQP2. A: phosphorylated (p) serine (ser) 256-AQP2 abundance is decreased in response to DM in the UT-A1/A3 KO mice compared with the WT diabetic mice. Top, Western blot of tissue lysate from WT and UT-A1/A3 KO mice, with and without diabetes, probed for pser256-AQP2. Bottom, bar graph showing combined mean densities ± SE from 2 experiments; n = 4/condition. *P ≤ 0.05. NS, not significant. B: pser261-AQP2 abundance is decreased in response to diabetes in the UT-A1/A3 KO mice compared with the WT diabetic mice. Top, Western blot of tissue lysate from WT and UT-A1/A3 KO, with and without diabetes, probed with pser261-AQP2. Each lane is loaded with a sample from a different rat. Immediately below is the loading control (LC). Bottom, bar graph showing combined mean densities ± SE from 2 experiments; n = 4/condition. *P ≤ 0.01.
pser261-AQP2 abundance is decreased in response to diabetes in the UT-A1/A3 KO mice compared with the WT diabetic mice.
In the nondiabetic animals, pser261-AQP2 abundance showed no significant difference [25 ± 4.7 and 46.2 ± 11.3 in the KO and WT, respectively, P = not significant (NS)]. pser261-AQP2 did not increase in the UT-A1/A3 KO in response to diabetes; however, in the WT animals, the amount of pser261-AQP2 was increased fourfold in response to diabetes (P = 0.01, Fig. 4B).
pser264-AQP2 and pser269-AQP2 abundances in response to diabetes.
We also tested phosphorylation of pser264-AQP2 and pser269-AQP2 in WT and KO mice in response to diabetes. There was no difference observed in the abundance of pser264-AQP2 or pser269-AQP2 in either WT or UT-A1/A3 KO mice, with or without diabetes, as assessed by Western blot analysis in IMCD tissue samples (data not shown).
Plasma membrane accumulation.
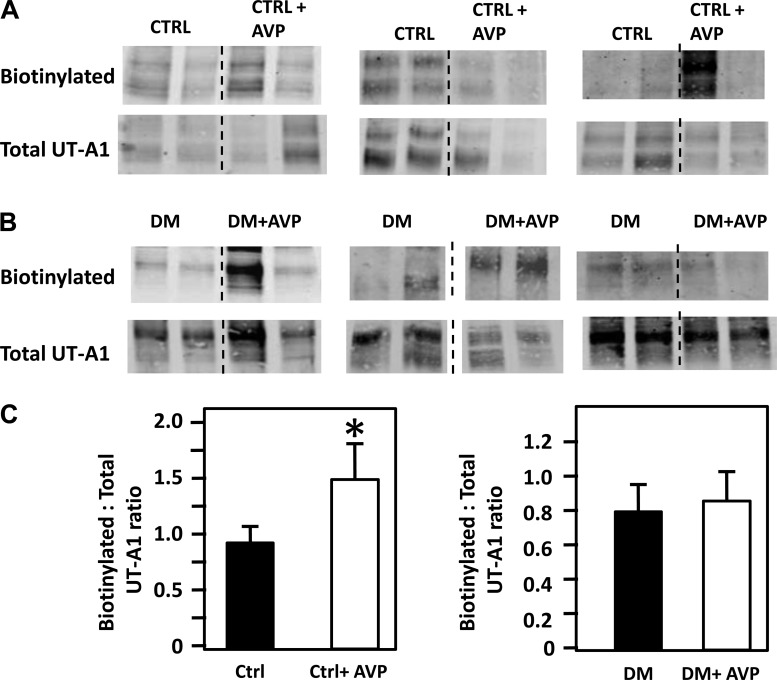
AVP increases apical plasma membrane accumulation of UT-A1 in control IMCDs. IMCD suspensions were biotinylated with and without exogenous AVP to determine membrane accumulation of UT-A1. Figure 5A provides a Western blot showing the membrane-bound (biotinylated) UT-A1 in control IMCD suspensions, with and without AVP (100 nM), and the analogous Western blot of the IMCD tissue lysates probed for total UT-A1. These protein values were used to normalize the UT-A1 in the membrane (biotinylated). The bar graph shows the amount of biotinylated UT-A1 per unit of total UT-A1 protein, combining the results from four different experiments (n = 8–13, P < 0.05). AVP increases the membrane expression of UT-A1 in the control rats treated with AVP but not in the diabetic rats treated with AVP (combining four different experiments, n = 12–16, P = NS, Fig 5B).
Fig. 5.
Vasopressin (AVP) increases apical membrane accumulation of UT-A1 in inner medullary collecting ducts (IMCDs) from nondiabetic control rats (A) but not diabetic (DM) rats (B). A: top, Western blot showing the membrane-bound UT-A1 (biotinylated) in nondiabetic control (CTRL) rat IMCD suspensions, with and without AVP treatment. Immediately below is the Western blot showing total UT-A1. B: top, Western blot showing the membrane-bound UT-A1 in diabetic rat IMCD suspensions, with and without AVP treatment. Immediately below is the Western blot showing total UT-A1 in diabetic rats. Western blots include representative Western blot protein bands from three of the four experiments in which we looked at the biotinylation of UT-A1 under these conditions. C: left, bar graph showing the amount of biotinylated UT-A1 per unit of total protein in control animals with and without AVP, combining the results from four different experiments (n = 8–13, P < 0.05). Right, bar graph showing biotinylated UT-A1 per unit of total protein in diabetic animals treated with and without AVP, combining the results from four different experiments [n = 12–16, P = not significant (NS)]. *P < 0.05.
Immunohistochemistry.
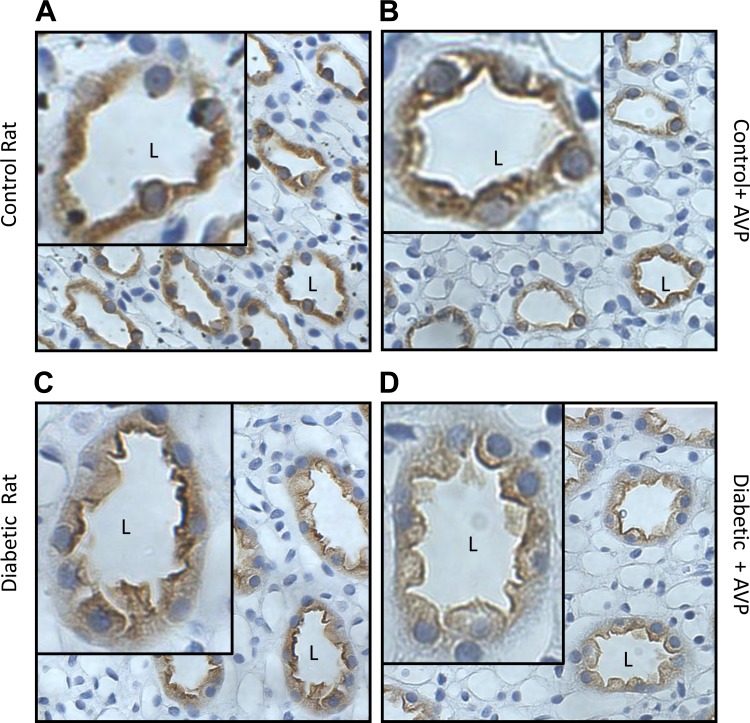
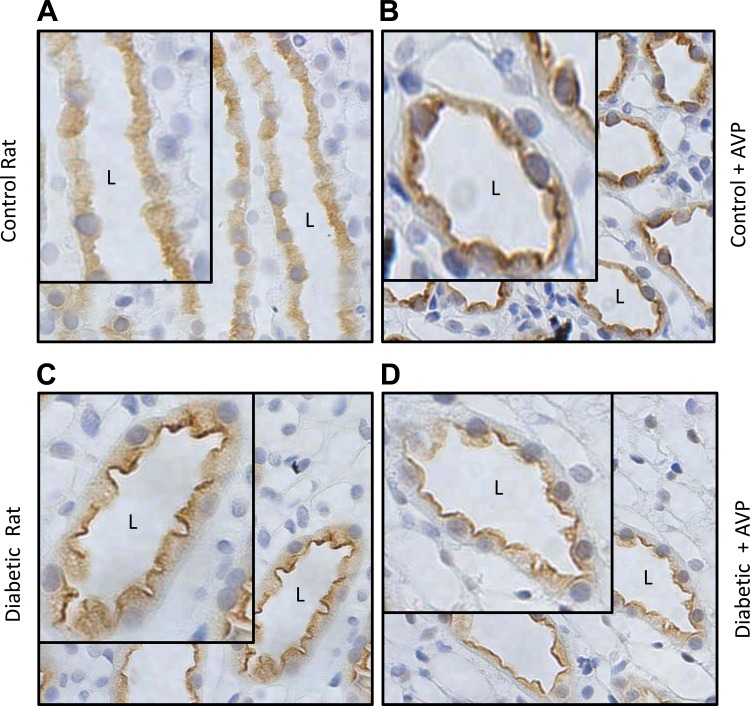
We had earlier shown that AVP increases urea permeability in the initial IMCD from the diabetic rat (18). Therefore, we used immunohistochemistry to determine if the cellular localization of UT-A1 was changed by AVP. We looked at the membrane distribution of total UT-A1 and UT-A1 phosphorylated at serine-486 in control and diabetic rats that were injected with AVP before perfusion and immunohistochemistry. Figure 6, A and B, shows the membrane association of total UT-A1 in the control animals, with and without AVP. Addition of AVP increases membrane association of total UT-A1 in the control IMCD. In the diabetic animal, total UT-A1 was seen to be maximally expressed both at the membrane and in the cytoplasm. This distribution did not change in the presence of AVP (Fig. 6, C and D). When we studied serine-486 phosphorylated UT-A1, we found an increased membrane association in control animals with AVP treatment (Fig. 7, A and B); however, in the diabetic rats, pser486-UT-A1 was already maximally expressed at the apical membrane, and this did not change with AVP treatment (Fig. 7, C and D). Our results also showed a higher level of pser486-UT-A1 at the apical surface with a greater proportion of phosphorylated UT-A1 associated with the membrane than with the cytosol in the diabetic animal.
Fig. 6.
Immunohistochemistry showing the membrane distribution of UT-A1 in control and diabetic rats ± vasopressin (AVP). A: membrane association of total UT-A1 in the control animal. B: membrane association of total UT-A1 in the control animal with AVP. Membrane association of total UT-A1 is increased in the control IMCD treated with AVP. C: total UT-A1 in the diabetic rat. D: total UT-A1 in the diabetic rat treated with AVP. Total UT-A1 was seen to be already maximally expressed both at the membrane and in the cytoplasm of control diabetic rats, and this did not change in the presence of AVP. Insets in each panel have been arbitrarily increased in size to allow clearer visualization of the membrane distribution. L, lumen of the tubule in the inset.
Fig. 7.
Immunohistochemistry showing the membrane distribution of pser486-UT-A1 in diabetic rats ± vasopressin (AVP). pser486-UT-A1 in control rats (A), control rats + AVP (B), diabetic rats (C), and diabetic rats treated with AVP (D). AVP increased membrane association of pser486-UT-A in control but not diabetic rats. pser486-UT-A1 in diabetic rats was already maximally expressed at the membrane, and this did not change with AVP. Insets in each panel have been arbitrarily increased in size to allow clearer visualization of the membrane distribution.
DISCUSSION
The UT-A1/A3 KO mouse was established by Fenton et al. in 2004 (3). They deleted 3 kb of the UT-A gene, resulting in disruption of the region that encodes UT-A1 and UT-A3 (3). This was pivotal in describing the functions of these UT in the kidney. The IMCDs from these KO mice are unable to carry out AVP-dependent urea transport and so cannot concentrate their urine (3). We received fertile male UT-A1/A3 KO mice from the Knepper laboratory, bred them back to C57BL/6 females, and then reestablished the homozygous line. Our KO mice showed physiological characteristics that were comparable to the initial stock, including their inability to concentrate urine.
AVP regulates AQP2 by binding to V2 receptors on the basolateral membrane of the principal and IMCD cells and promoting increased cAMP production. An increase in plasma AVP levels results in increased abundance of AQP2. In the present study, we show that, even when we maximally stimulate AQP2 with AVP in control UT-A1/A3 KO mice, the protein abundance of AQP2 is increased, but there is no improvement in the urine concentrating ability of the mice. Although baseline AVP levels are higher in the KO mice and this may have blunted the response to exogenous AVP, we do not think the increase was sufficient to mask a AVP response if it was present. Although the basal level of 25 pg/ml is increased in the KO compared with the WT level of 15 pg/ml, the maximal effect of AVP is not reached as mice are able to achieve AVP levels close to 421 pg/ml (17) and the KO mice had levels of 25 pg/ml. In addition, urine concentration was still impaired in the KO mice treated with AVP. This implies that urine concentration in the IMCD may involve an interaction between AQP2 and the urea transporters UT-A1 and UT-A3, or at least a coordination of the actions of both water and urea movement to effect a successful concentrating response. This may explain the observed inability of AVP to increase urine osmolality in the UT-A1/A3 KO mice where, even in the presence of maximum stimulation with AVP, AQP2 cannot create a concentrating environment in the absence of UT-A1 and UT-A3.
We also found that survival of the UT-A1/A3 KO mice was impacted by the presence of diabetes. The diabetic animals showed a 40% survival compared with controls, which showed a 70% survival. The possible explanation for this is that the absence of UT-A1 and UT-A3 leads to hypotonic urine, which would cause dehydration and may result in volume depletion. In an animal that is polyuric at baseline, these characteristics may result in profound morbidity and mortality. This is reflected in the urine concentration of the diabetic animals. The control diabetic mice were able to concentrate urine to a reasonable degree. Urine concentration decreased by 19% in the WT diabetic mice, and this was statistically significant; the UT-A1/A3 KO had a decrease of 25% in urine concentration. The dramatic reduction in urine osmolality in the KO animals can be explained by diabetes. Diabetes results in polydipsia and polyuria, which cause a free water excretion and reduced urine osmolality. AQP2 is upregulated in abundance in the UT-A1/A3 KO mice and in the diabetic WT. This finding agrees with previous work done by Nejsum et al. and supports this being a compensatory mechanism to conserve water in diabetes (15). However, in the UT-A1/A3 KO, diabetes is unable to increase AQP2 abundance. This suggests that, in diabetes, there is interdependence between UT-A1 and AQP2, which results in a compensatory mechanism for the polyuric state. The absence of UT-A1 and UT-A3 in the diabetic mouse results in a failure of this compensatory mechanism to be activated, and this may be the cause of the increased mortality seen in the UT-A1/A3-deficient animals. Nejsum et al. have previously shown that the abundance of AQP2, AQP3, and phosphorylated AQP2 increases in response to diabetes (15).
AVP appears to be responsible for the upregulation of phosphorylated AQP2 in response to the polyuria. Our study also looked at the levels of phosphorylation of aquaporins (AQP) in the WT and KO animals. We saw that phosphorylation at serine-256, which is AVP sensitive, was more increased in the WT diabetic mice compared with the UT-A1/A3 KO diabetic mice. In addition, pser256-AQP2 was increased in nondiabetic WT mice compared with pser256-AQP2 levels in the nondiabetic UT-A1/A3 KO. There was a significant upregulation of pser256-AQP2 in the WT mice with induction of diabetes, but in the UT-A1/A3 KO mice diabetes did not significantly change the abundance of pser256-AQP2. This suggests that the inability to phosphorylate AQP2 at serine-256 may be, at least in part, a contributor to the poor urine concentration in these mice. It also suggests that serine-256 may be affected by the absence of UT-A1/A3 although the mechanism is yet to be understood. pser261-AQP2 was also downregulated in the diabetic UT-A1/A3 KO mice compared with the diabetic WT mice but may not be a large contributor to the reduced urine concentrating ability, since it is not upregulated by AVP (8) and diabetes is an AVP-sensitive state. There was no significant difference in phosphorylation of AQP2 at serines-264 and -269 in the WT and UT-A1/A3 KO, implying that these sites may not directly be implicated in the urine concentrating ability of the diabetic UT-A1/A3 KO mice.
Along with its role in promoting water movement with AQP, AVP acts on UT-A1 to promote phosphorylation and membrane accumulation of this transporter. When we studied the membrane accumulation of UT-A1 in control and diabetic rats treated exogenously with AVP, we found that control rats increased membrane expression of UT-A1, but this was not the case in the diabetic rats. This result was not expected as previous studies had shown an increase in urea permeability in isolated perfused IMCDs in the diabetic animals compared with the WT (18). Immunohistochemistry helped to explain our results. Our observations were that UT-A1 is maximally membrane associated in the diabetic animal, and further stimulation by exogenous AVP does not increase the membrane association. Diabetes also causes UT-A1 that is phosphorylated at serine-486 to be localized predominantly to the apical plasma membrane. This phosphorylated form is one of the active forms of UT-A1 that moves to the membrane (2), causes increased urea reabsorption from the urine, and ultimately results in water reabsorption, which would compensate for the polyuria seen in the diabetic state.
Results from these studies provide new evidence about the relationship between UT-A and AQP2 in the urine concentrating mechanism. We conclude that AQP2 alone, even when stimulated by AVP, is not sufficient to achieve optimal urine concentration. This may explain, in part at least, why the absence of UT-A1 and UT-A3 increases mortality in the diabetic mice. The ability of diabetic animals to cope with osmotic diuresis by increasing AQP2 does not occur in the absence of UT-A1 and UT-A3. For maximum urine concentration and compensation in diabetes, both AQP and UT must be present and functional. It appears that UT-A1 is already maximally stimulated in diabetic IMCDs. Acute administration of AVP, therefore, does not change UT-A1 membrane accumulation and cannot further stimulate urea movement since the more active pser486-UT-A1 is already located almost exclusively at the apical plasma membrane.
GRANTS
This work was supported by National Institute of Diabetes and Digestive and Kidney Diseases Grants R01-DK-41707, R01-DK-89828, R21-DK-91147, and T32-DK-07656.
DISCLOSURES
No conflicts of interest, financial or otherwise, are declared by the authors.
AUTHOR CONTRIBUTIONS
Author contributions: T.O.I., J.M.S., and J.D.K. conception and design of research; T.O.I. and C.F.M. performed experiments; T.O.I., C.F.M., and J.D.K. analyzed data; T.O.I., J.M.S., and J.D.K. interpreted results of experiments; T.O.I., C.F.M., and J.D.K. prepared figures; T.O.I. drafted manuscript; T.O.I., M.A.B., J.M.S., and J.D.K. edited and revised manuscript; T.O.I., M.A.B., J.M.S., and J.D.K. approved final version of manuscript.
ACKNOWLEDGMENTS
We thank Dr. Mark Knepper (National Institutes of Health) for the gift of a breeder stock of the UT-A1/A3 knockout mouse. We are also grateful to Dr. Rikke Nørregaard (University of Aarhus) for the gift of the phosphoantibody to pser256-AQP2.
REFERENCES
- 1. Bardoux P, Ahloulay M, Le Maout S, Bankir L, Trinh-Trang-Tan MM. Aquaporin-2 and urea transporter-A1 are up-regulated in rats with type I diabetes mellitus. Diabetologia 44: 637–645, 2001 [DOI] [PubMed] [Google Scholar]
- 2. Blount MA, Mistry AC, Fröhlich O, Price SR, Chen G, Sands JM, Klein JD. Phosphorylation of UT-A1 urea transporter at serines 486 and 499 is important for vasopressin-regulated activity and membrane accumulation. Am J Physiol Renal Physiol 295: F295–F299, 2008 [DOI] [PMC free article] [PubMed] [Google Scholar]
- 3. Fenton RA, Chou CL, Stewart GS, Smith CP, Knepper MA. Urinary concentrating defect in mice with selective deletion of phloretin-sensitive urea transporters in the renal collecting duct. Proc Natl Acad Sci USA 101: 7469–7474, 2004 [DOI] [PMC free article] [PubMed] [Google Scholar]
- 4. Fenton RA, Flynn A, Shodeinde A, Smith CP, Schnermann J, Knepper MA. Renal phenotype of UT-A urea transporter knockout mice. J Am Soc Nephrol 16: 1583–1592, 2005 [DOI] [PMC free article] [PubMed] [Google Scholar]
- 5. Fenton RA, Knepper MA. Urea and renal function in the 21st century: insights from knockout mice. J Am Soc Nephrol 18: 679–688, 2007 [DOI] [PubMed] [Google Scholar]
- 6. Fushimi K, Sasaki S, Marumo F. Phosphorylation of serine 256 is required for cAMP-dependent regulatory exocytosis of the aquaporin-2 water channel. J Biol Chem 272: 14800–14804, 1997 [DOI] [PubMed] [Google Scholar]
- 7. Hoffert JD, Fenton RA, Moeller HB, Simons B, Tchapyjnikov D, McDill BW, Yu MJ, Pisitkun T, Chen F, Knepper MA. Vasopressin-stimulated increase in phosphorylation at Ser269 potentiates plasma membrane retention of aquaporin-2. J Biol Chem 283: 24617–24627, 2008 [DOI] [PMC free article] [PubMed] [Google Scholar]
- 8. Hoffert JD, Nielsen J, Yu MJ, Pisitkun T, Schleicher SM, Nielsen S, Knepper MA. Dynamics of aquaporin-2 serine-261 phosphorylation in response to short-term vasopressin treatment in collecting duct. Am J Physiol Renal Physiol 292: F691–F700, 2007 [DOI] [PubMed] [Google Scholar]
- 9. Hoffert JD, Pisitkun T, Wang G, Shen RF, Knepper MA. Quantitative phosphoproteomics of vasopressin-sensitive renal cells: regulation of aquaporin-2 phosphorylation at two sites. Proc Natl Acad Sci USA 103: 7159–7164, 2006 [DOI] [PMC free article] [PubMed] [Google Scholar]
- 10. Kim D, Sands JM, Klein JD. Changes in renal medullary transport proteins during uncontrolled diabetes mellitus in rats. Am J Physiol Renal Physiol 285: F303–F309, 2003 [DOI] [PubMed] [Google Scholar]
- 11. Klein JD, Blount MA, Fröhlich O, Denson CE, Tan X, Sim JH, Martin CF, Sands JM. Phosphorylation of UT-A1 on serine 486 correlates with membrane accumulation and urea transport activity in both rat IMCDs and cultured cells. Am J Physiol Renal Physiol 298: F935–F940, 2010 [DOI] [PMC free article] [PubMed] [Google Scholar]
- 12. Klein JD, Fröhlich O, Blount MA, Martin CF, Smith TD, Sands JM. Vasopressin increases plasma membrane accumulation of urea transporter UT-A1 in rat inner medullary collecting ducts. J Am Soc Nephrol 17: 2680–2686, 2006 [DOI] [PubMed] [Google Scholar]
- 13. Klein JD, Murrell BP, Tucker S, Kim YH, Sands JM. Urea transporter UT-A1 and aquaporin-2 proteins decrease in response to angiotensin II or norepinephrine-induced acute hypertension. Am J Physiol Renal Physiol 291: F952–F959, 2006 [DOI] [PubMed] [Google Scholar]
- 14. Moeller HB, MacAulay N, Knepper MA, Fenton RA. Role of multiple phosphorylation sites in the COOH-terminal tail of aquaporin-2 for water transport: evidence against channel gating. Am J Physiol Renal Physiol 296: F649–F657, 2009 [DOI] [PMC free article] [PubMed] [Google Scholar]
- 15. Nejsum LN, Kwon TH, Marples D, Flyvbjerg A, Knepper MA, Frøkiaer J, Nielsen S. Compensatory increase in AQP2, p-AQP2, and AQP3 expression in rats with diabetes mellitus. Am J Physiol Renal Physiol 280: F715–F726, 2001 [DOI] [PubMed] [Google Scholar]
- 16. Nielsen S, Kwon TH, Christensen BM, Promeneur D, Frøkiaer J, Marples D. Physiology and pathophysiology of renal aquaporins. J Am Soc Nephrol 10: 647–663, 1999 [DOI] [PubMed] [Google Scholar]
- 17. Nørregaard R, Madsen K, Hansen PB, Bie P, Thavalingam S, Frøkiær J, Jensen BL. COX-2 disruption leads to increased central vasopressin stores and impaired urine concentrating ability in mice. Am J Physiol Renal Physiol 301: F1303–F1313, 2011 [DOI] [PubMed] [Google Scholar]
- 18. Pech V, Klein JD, Kozlowski SD, Wall SM, Sands JM. Vasopressin increases urea permeability in the initial IMCD from diabetic rats. Am J Physiol Renal Physiol 289: F531–F535, 2005 [DOI] [PMC free article] [PubMed] [Google Scholar]
- 19. Zhang C, Sands JM, Klein JD. Vasopressin rapidly increases phosphorylation of UT-A1 urea transporter in rat IMCDs through PKA. Am J Physiol Renal Physiol 282: F85–F90, 2002 [DOI] [PubMed] [Google Scholar]


