Abstract
Cardiomyocyte organization is a critical determinant of coordinated cardiac contractile function. Because of the acute opening of the pulmonary circulation, the relative workload of the left ventricle (LV) and right ventricle (RV) changes substantially immediately after birth. We hypothesized that three-dimensional cardiomyocyte architecture might be required to adapt rapidly to accommodate programmed perinatal changes of cardiac function. Isolated fixed hearts from pig fetuses or pigs at midgestation, preborn, postnatal day 1 (P1), postnatal day 5, postnatal day 14 (P14), and adulthood (n = 5 for each group) were acquired for diffusion-weighted magnetic resonance imaging. Cardiomyocyte architecture was visualized by three-dimensional fiber tracking and was quantitatively evaluated by the measured helix angle (αh). Upon the completion of MRI, hearts were sectioned and stained with hematoxylin/eosin (H&E) to evaluate cardiomyocyte alignment, with picrosirius red to evaluate collagen content, and with anti-Ki67 to evaluate postnatal cell proliferation. The helical architecture of cardiomyocyte was observed as early as the midgestational period. Postnatal changes of cardiomyocyte architecture were observed from P1 to P14, which primary occurred in the septum and RV free wall (RVFW). In the septum, the volume ratio of LV- vs. RV-associated cardiomyocytes rapidly changed from RV-LV balanced pattern at birth to LV dominant pattern by P14. In the RVFW, subendocardial αh decreased by ∼30° from P1 to P14. These findings indicate that the helical architecture of cardiomyocyte is developed as early as the midgestation period. Substantial and rapid adaptive changes in cardiac microarchitecture suggested considerable developmental plasticity of cardiomyocyte form and function in the postnatal period in response to altered cardiac mechanical function.
Keywords: heart development, diffusion tensor magnetic resonance imaging, cardiomyocyte architecture, helix angle
the heart of newborns undergoes substantial structural and functional changes to accommodate the rapid switching from fetal to neonatal circulation immediately after birth. The process entails immediate opening of the pulmonary circulation and rapid closing of the patent ductus arteriosus and foramen ovale that bypass blood from right atrium/pulmonary artery to left atrium/aorta (3, 12, 13). The increased left-ventricular (LV) workload accelerates LV cardiomyocyte hypertrophy, hyperplasia, and extracelluar collagen deposition (4, 8, 11). Unfortunately, little is known about the associated changes of cardiomyocyte architecture over the course of early cardiac development (40–42). To address this question, quantitative evaluation of cardiomyocyte architecture in the perinatal period is critical for defining these adaptive features of postnatal heart development.
It is well recognized that the three-dimensional organization of cardiomyocytes is established early in prenatal hearts but exhibits developmental plasticity afterward. Using polarized light microscopy, Jouk et al. (25, 26) reported the early formation of fiber organization in second trimester hearts and revealed a complex structure in the septal region in neonatal hearts. Using embryonic hearts, Tobita et al. (44) showed that the transmural gradient of cardiomyocyte orientation undergoes progressive changes during heart development that is modulated by mechanical workload. Given the rapid increase of LV workload at birth, it begs the question of how quickly and extensively cardiomyocyte architecture might be reorganized after birth to accommodate abrupt postnatal requirements for sustained cardiac function.
Previous studies have shown that LV size and weight are comparable with that of the right ventricle (RV) in the pig fetus, but increase nearly twofold by postnatal day 14 (P14) (19, 20). The associated cellular changes include 1) cardiomyocyte proliferation resulting in 28% increase in the number of LV myocytes relative to unchanged number of RV myocytes (4), 2) cardiomyocyte hypertrophy resulting in increased LV and RV mass, and 3) progressively increased extracellular collagen content (8). Thus we hypothesized that cardiomyocytes will undergo substantial structural reorganization in the first 2 wk after birth in response to developmental requirement of new roles for LV and RV functionality in the postnatal heart.
To study cardiomyocyte architecture, histological, optical and ultrasonic methods were previously used (16, 18, 44). However, these techniques are laborious and may distort or fail to comprehensively represent complex three-dimensional tissue architecture. Our group and others have used diffusion tensor MRI (DTMRI) as a nondestructive method to quantitatively reconstruct three-dimensional cardiomyocyte architecture in exquisite detail (9, 10, 15, 21, 24, 28, 38, 45). The determined primary eigenvector of the water diffusion tensor is aligned with the principle axis of cardiomyocytes (10, 37, 41, 42). In addition, the fractional anisotropy (FA), a quantitative measure of anisotropic water diffusion, can reflect the directional coherence of cardiomyocyte orientations and cellular shape changes (9, 14, 31, 49). By applying these nondestructive and quantitative methods, we sought to delineate the temporal and spatial evolution of cardiomyocyte architecture in fetal, neonatal and adult pig hearts.
MATERIALS AND METHODS
Animal and Heart Preparation
Pig hearts were obtained from 30 animals, five from each of the following age groups: fetal piglets at 60-day midgestation (MG) period, preborn (PB) at ∼114 gestation day, postnatal day 1 (P1), postnatal day 5 (P5), postnatal day 14 (P14) and adult pigs. Formalin-fixed fetal piglets were purchased from Nebraska Scientific (Omaha, NE). Hearts were excised and stored in 10% formalin solution. Neonatal piglets were purchased from Oakhill Genetics (Ewing, IL). Animals were anesthetized with isoflurane. Hearts were isolated, retrogradely perfused with cardioplegic solution to induce diastolic arrest, and fixed with 10% formalin. Fresh adult pig hearts were acquired from a local slaughterhouse (Schubert's Packing, Millstadt, IL). Hearts were rinsed with PBS and fixed with 10% formalin solution. Before magnetic resonance scanning, each heart was rinsed and kept in PBS for 24 h. All animal handling procedures were approved by and conducted in accordance with the guidelines of the Washington University Animal Study Committee.
MRI
DTMRI was performed on a 4.7 T Varian INOVA system (Varian Associates, Palo Alto, CA). Custom-built loop-gap coils (1 ∼ 4 cm diameter) were used for imaging fetal and neonatal piglet hearts, and a 12-cm diameter birdcage coil was used for imaging adult pig hearts. A spin-echo sequence with diffusion-sensitizing bipolar gradient was used to acquire multi-slice short-axis diffusion weighted images covering the entire LV as previously described (9). Imaging parameters were as follows: repetition time, 2 s; echo time, 34 ms; diffusion gradient strength, 10 Gauss/cm; diffusion time, 20 ms; gradient pulse duration, 5 ms; gradient factor, 784 s/mm2; slice thickness, 0.5 mm for 60-day fetal piglet heart and 1 mm for all the rest of the groups; in-plane resolution, 937 × 937 μm2 for adult pig heart and 156 × 156 μm2 for all the rest of the groups. Total acquisition time for each heart was ∼2 h.
Data Analysis
Morphological analysis.
LV and RV wall thicknesses were calculated as the mean distance between epicardial and endocardial borders at the center 20° sector of free wall in the midventricular short-axis plane. To evaluate developmental changes of septum curvature, curvature thickness index (CTI) was calculated using a previously reported method (22). Briefly, the septum thickness was measured as the mean distance between LV and RV endocardial surfaces in the center 20° sector of the septum, which is located at the level of maximal LV diameter. The septal curvatures in the long-axis view and short-axis view were calculated based on the heart shape on multi-slice magnetic resonance images. CTI was then calculated using the following formula: CTI = t(1/rAB + 1/rTX), where t is septum thickness, rAB is the radius of septal curvature in the long-axis view, and rTX is the radius of septal curvature in the short-axis view.
DTI data analysis.
The effective diffusion tensor was calculated from diffusion-weighted images to derive the primary, secondary, and tertiary eigenvectors and eigenvalues, and FA as previously described (31). The primary eigenvector of the diffusion tensor was considered to represent the cardiomyocyte orientation (15, 21, 24, 38).
Three-dimensional fiber tracking to visualize cardiomyocyte architecture.
Fiber tracking was implemented by using a freeware, DTI Studio (The Laboratory of Brain Anatomical MRI and Center for Imaging Science at Johns Hopkins University; https://www.mristudio.org) (23). The criterion for fiber tracking was set as FA > 0.25 in PB, P1, P5, and P14 hearts and FA > 0.2 in MG and adult hearts, respectively.
Helix angle (αh) quantification.
Cardiomyocyte orientation was quantitatively evaluated in wall-bound myocardial coordinates to minimize the effect of surface curvature on myocardial fiber angle measurement (10, 38). Briefly, epicardial and endocardial borders of the heart were traced manually on both short- and long-axis images (10). The LV long-axis was determined as the line that best fit the centers of the epicardial borders from the base to the apex. A prolate spheroid was fit to the epicardial borders to represent the epicardial surface. Subsequently, three principal axes of the wall-bound coordinates were determined. The axis normal to the local epicardial surface was defined as radial. The circumferential axis was tangent to the local epicardial surface and perpendicular to the LV long axis. The axis perpendicular to both the radial and circumferential axes was defined as longitudinal.
DTMRI-determined αh was calculated as the angle between the projection of the cardiomyocyte onto the circumferential-longitudinal plane and the circumferential axis (Fig. 2C). A positive αh represents a right-handed helix that is typically observed in the endocardium. Finally, three 20°-wide sectors respectively located at the center of septum, LV free wall (LVFW), and RV free wall (RVFW) were selected as regions of interests (ROI) (Fig. 2A), to quantitatively analyze the transmural distribution of αh.
Fig. 2.
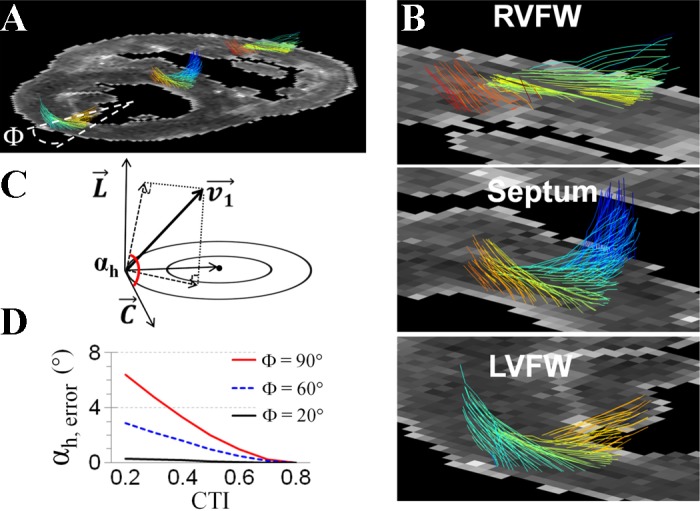
The 3-dimensional organization of cardiomoycytes. A and B: representative image of 3-dimensional cardiomyocyte orientation on a short-axis slice of P1 pig heart shows the transmural shift of cardiomyocyte orientation in the RVFW, septum, and LVFW. A Φ = 20° sector at the center of LVFW was selected for quantitatively analysis of αh. C: definition of αh as the angle between circumferential orientation (C) and the projection of cardiomyocyte orientation (v1) on the tangential plane, which is defined by the circumferential and longitudinal (L) axis. D: maximal measurement error in αh (αh, error) under different CTIs and within different sizes of regions of interest. When a region of interest was selected at a Φ = 20° sector, measurement error in αh was <1° when CTI changed from 0.2 to 0.8.
Estimate CTI caused measurement error in αh.
Given that αh is dependent on the wall curvature and the observed developmental changes of septal wall curvature in pig hearts (Fig. 1D), we evaluated the effect of wall curvature changes (i.e., measured by CTI) on the αh measurement. Specifically, the CTI of LVFW was set to 0.8 (t = 0.4, rAB = rTX = 1), representing a circular shape. The LV center was set at the center of the curvature of the LVFW. All cardiomyocytes were considered aligning parallel to local wall surface. The actual αh was set to change linearly from 60° at the endocardial surface to −60° at the epicardial surface.
Fig. 1.
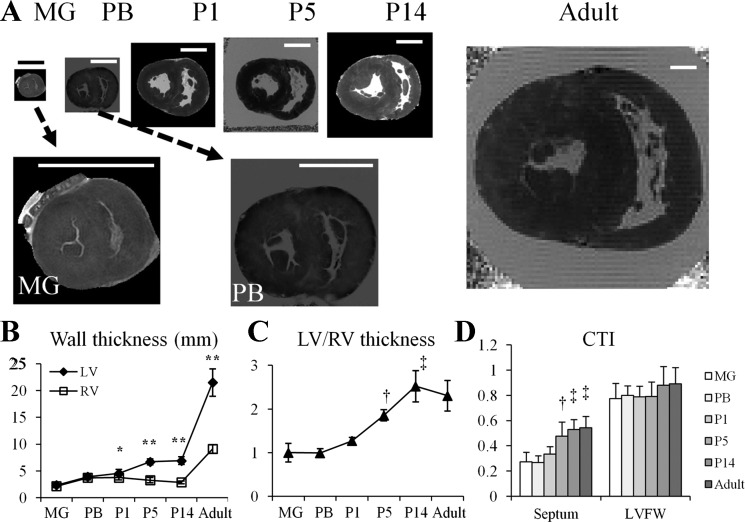
Developmental changes of the pig heart morphology. A: representative short-axis images of pig heart at midgestation (MG); preborn (PB); postnatal day 1, postnatal day 5, and postnatal day 14 (P1, P5, and P14, respectively); and adult. Scale bar = 1 cm. B: wall thickness of left ventricle (LV) free wall (LVFW) and right ventricle (RV) free wall (RVFW) in pig hearts at different ages. Thickness of the LVFW increased more rapidly than that of RVFW in newborn hearts. *P < 0.05 and **P < 0.001 compared with the thickness of RVFW at the same timepoint. C: thickness ratio of LVFW to RVFW increased steadily from P1 to P14. †P < 0.05 compared with MG, PB, or P1; ‡P < 0.05 compared with MG, PB, P1, or P5. D: curvature thickness index (CTI) of the septum and LVFW. After birth, CTI of the septum rapidly increased from P1 to P5. †P < 0.05 compared with MG or PB; ‡P < 0.05 compared with MG, PB, or P1.
The septal CTI was set to vary from 0.2 (t = 0.4, rAB = rTX = 4) to 0.8 (t = 0.4, rAB = rTX = 1). Under each CTI, αh map in the septal wall was calculated using the above described method [in Helix angle (αh) quantification]. Three ROIs, i.e., 20°-, 60°-, or 90°-wide sectors that were located at the center of septum, were defined. The maximal error of measured αh in each ROI at different CTI was determined (Fig. 2D).
Histological Analysis
Upon the completion of MRI, hearts were fixed with 10% formalin, sliced along the short axis in the midventricle. Slices were embedded in paraffin and sectioned at 5 μm thickness for immunohistochemistry.
Anti-Ki67 staining was performed on P1, P5, and P14 hearts to evaluate cardiomyocyte proliferation after birth. Light microscopy images were acquired under 100× magnification. Six images, three in the LVFW and three in the RVFW, were acquired on a midventricular slice for each animal in P1, P5, and P14 groups. The numbers of proliferative cell were manually counted. Ki67 labeling indexes were calculated as the ratio of proliferative cells to the total number of cells.
H&E-stained slices were used to evaluate myocardial fiber orientations. Picrosirius red staining followed by polarization microscopy was used to analyze collagen content (27, 48). Interstitial collagen content was evaluated by the collagen area fraction, the area ratio of collagen to the myocardium tissue (47). Perivascular and heart surface collagen areas were excluded from the analysis.
Statistical Analysis
All data are presented as means ± SD. Two-way ANOVA was used to compare LV and RV thickness at different ages. One-way ANOVA was used to compare LV-to-RV thickness ratio, as well as CTI, between different age groups. One-way ANOVA was also used to compare volume ratio of LV- versus RV-associated fibers in the septum, as well as FA, between different age groups. Values of αh in the LVFW and RVFW were determined from 5% (endocardial surface) to 95% (epicardial surface) of transmural depth at 10% increments. Two-way ANOVA was used to compare αh between different age groups and different transmural depths. Two-way ANOVA was also used to compare Ki67 labeling index between different age groups and LVFW versus RVFW. Tukey's tests were used to determine significance for post hoc multiple comparisons after one- or two-way ANOVA. A two-tailed value of P < 0.05 was considered significant.
RESULTS
Developmental Changes of Heart Morphology
Figure 1 shows representative short-axis MRI images of pig hearts at different developmental ages. A primary change in heart morphology is the increase of LV-to-RV wall thickness ratio. In MG and PB hearts, thickness of the LVFW and RVFW were comparable. From P1 to P14, thickness of the LVFW increased progressively while thickness of the RVFW remained unchanged (Fig. 1B). Accordingly, LV-to-RV wall thickness ratio increased onefold from P1 (1.27 ± 0.08) to P14 (2.52 ± 0.36, P < 0.05 compared with P1) (Fig. 1C). From P14 to adulthood, LV-to-RV thickness ratio remained unchanged [P = not significant (NS)], despite the substantial increase of both LV and RV thickness.
The curvature of septum rapidly changed from nearly flat in MG and PB hearts to curved (outbound toward RV) after birth due to increased LV to RV pressure gradient after birth. Specifically, CTI increased from 0.33 ± 0.06 at P1 to 0.53 ± 0.08 at P14 (P < 0.05 compared with P1), then remained unchanged until adulthood (P = NS, compared with P14) (Fig. 1D). No significant CTI change was observed in the LVFW.
Visualization of Helical Organization of Cardiomyocyte Architecture in Hearts
Figure 2, A and B, shows DTMRI determined cardiomyocyte architecture in a P1 piglet heart. The characteristic transmural shift of cardiomyocyte orientation, i.e., a left-handed helix in the subepicardium and a right-handed helix in the subendocardium, was observed in the septum and LVFW, as well as in the RVFW. The definition of αh was shown in Fig. 2C. Simulation results showed that lower CTI caused higher measurement error in αh. When the ROI was selected as the 20° sector centered in the septum, however, the maximal measurement error in αh was <1° for CTI ranged between [0.2 0.8] (Fig. 2D).
The Volume Ratio of LV- versus RV-associated Cardiomyocytes in the Septum Increases from P1 to P14
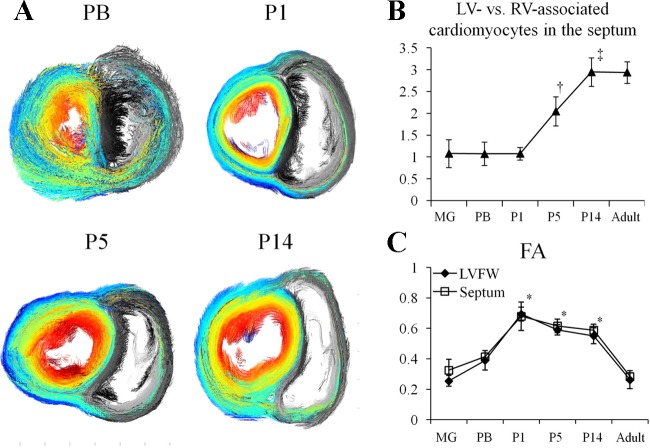
Given the developmental changes of LV and RV wall thickness after birth, we investigated the volume ratio of LV- versus RV-associated cardiomyocytes in the septum at different ages. Figure 3A shows short-axis projection views of cardiomyocyte architecture in PB and newborn pig hearts. From P1 to P14, the increased volume fraction of LV-associated cardiomyocytes (color coded) in the septum was visually appreciable. Quantitatively, the volume ratio of LV- versus RV-associated septal cardiomyocytes remained unchanged from MG to P1. It rapidly increased by onefold by P5 and then twofold by P14. No further change was observed from P14 to adulthood.
Fig. 3.
Volume ratio of LV- vs. RV-associated cardiomyocytes in the septum. A: representative projection views of cardiomyocyte architecture showed decreased fraction of RV-associated cardiomyocytes (gray color) in the septum from P1 to P14. The LV-associated cardiomyocytes were color-coded with its αh on a midventricular short-axis slice, which shows those cardiomoycytes extended from LV to RV. B: volume ratio of LV- vs. RV-associated cardiomyocytes in the septum increased ∼2-fold from P1 to P14. †P < 0.05 compared with MG, PB, or P1; ‡P < 0.05 compared with MG, PB, P1, or P5. C: fractional anisotropy (FA) of water diffusivity in P1, P5, and P14 hearts were comparable (P = not significant for all comparisons), but all higher than MG, PB, and adult hearts (*P < 0.05 compared with MG, PB, or adult).
DTMRI-determined myocardial FA value in cardiac tissue (>0.2) was substantially higher than that of surrounding media (0.05 ± 0.02, P < 0.05 for all comparisons), reflecting anisotropic water diffusion in all hearts. From prenatal to P1, FA rapidly increased by approximately twofold (P < 0.05 to MG and PB). FA exhibited no statistically significant changes from P1 to P14, and then reduced by ∼50% to 0.28 ± 0.02 in adult hearts (P < 0.05 compared with P1, P5, or P14) (Fig. 3C). The anisotropic water diffusion in cardiac tissue met the criteria for fiber tracking.
The RV and Septal Cardiomyocyte Architectures Undergo Remodeling Immediately After Birth
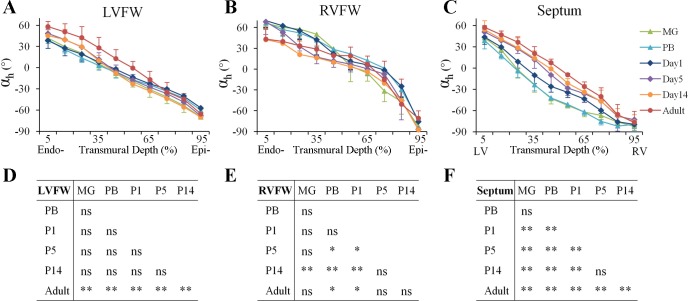
In the LVFW (Fig. 4, A and D), no statistically significant changes in cardiomyocyte architecture were observed from MG to P14. However, the cardiomyocyte αh in the subendocardium of LVFW (5% to 45% transmural wall depth) increased ∼10° from P14 to adult (P < 0.05).
Fig. 4.
Transmural distribution of αh in the LVFW, RVFW, and septum. A–C: transmural distribution of αh in the LVFW, RVFW, and septum. In LVFW and RVFW, data were analyzed from the endocardial (Endo-) surface (5% wall depth) to the epicardial (Epi-) surface (95% wall depth). In the septum, data were analyzed from the LV endocardial surface (5%) to the RV endocardial surface (95%). D-F: post hoc multiple comparisons of transmural distribution of αh between different age groups in the LVFW, RVFW, and septum. *P < 0.05; **P < 0.001. ns, not significant.
The cardiomyocyte architecture in RVFW underwent acute changes after birth (Fig. 4, B and E). In prenatal (i.e., MG and PB) and P1 hearts, αh in the subendocardium of RVFW (i.e., 0–10% wall depth) was ∼70°. It rapidly decreased to 42° ± 20° in P14 hearts (P < 0.05 compared with MG, PB, or P1), which is similar to that in adult hearts (43° ± 14°; P = NS, compared with P14).
The transmural distribution of the septal αh also underwent acute changes after birth (Fig. 4, C and F). In prenatal (i.e., MG and PB) hearts, the transmural location of the 0° αh, reflecting cardiomyocytes that were oriented circumferentially parallel to the short-axis plane, was detected at ∼25% wall depth from LV endocardial surface. The location of 0° αh rapidly changed to ∼30% transmural depth at P1, and further to ∼40%, 45%, and 50% at P5, P14, and adulthood, respectively.
Histological Analysis of Cell Proliferation, Fiber Architecture, and Collagen Deposition
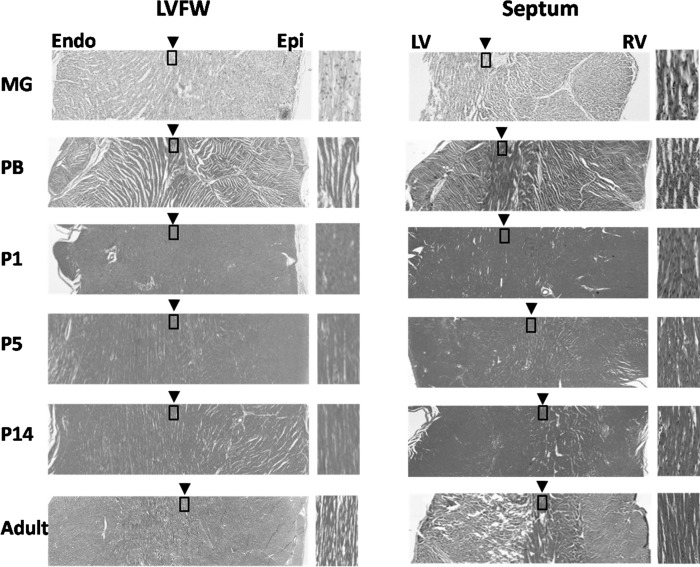
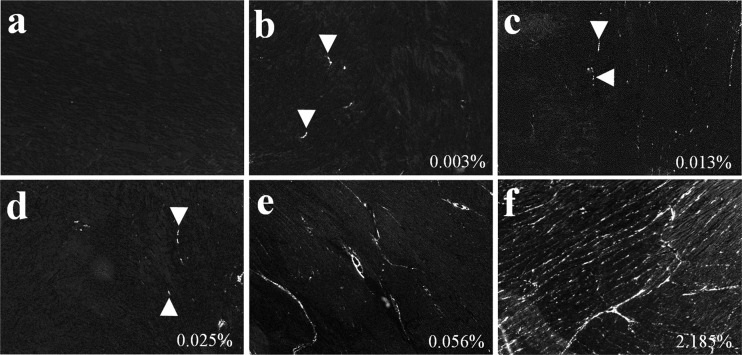
Anti-Ki67 staining showed proliferative cells in P1, P5, and P14 hearts (Fig. 5). The labeling index of proliferative cells increased from P1 to P5 (P < 0.001), then decreased from P5 to P14 (P < 0.001). No significant difference was observed between the LVFW and RVFW. H&E staining showed the location of cardiomyocytes with 0° αh, i.e., oriented circumferentially and parallel to the short-axis plane, was observed at ∼50% of wall depth in the LVFW of all hearts (Fig. 6). In the septum, however, the location of those cardiomyocytes exhibiting 0° αh progressively shifted from proximal to LV endocardial surface in MG hearts to proximal to RV endocardial surface in adult hearts. Picrosirius red staining showed trace amount of collagen in PB hearts (Fig. 7). After birth, progressively increasing collagen content from P1 to adulthood was visually appreciable.
Fig. 5.
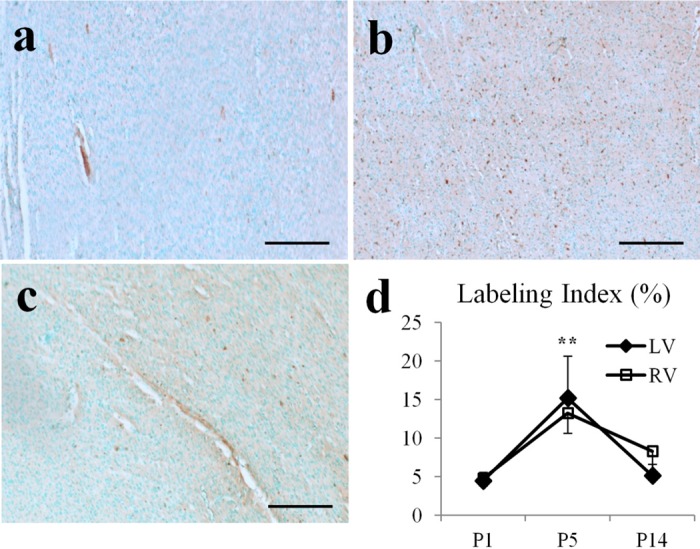
Anti-Ki67 staining of cell proliferation in pig hearts. A–C: representative images of stained Ki67-positive cells (in brown color) in P1, P5, and P14 hearts. Scale bar = 200 μm. D: labeling index of Ki67-positive cells peaked at P5. **P < 0.001, compared with P1 or P14.
Fig. 6.
Hematoxylin/eosin (H&E) staining of short-axis slices of the LVFW and septum. The zoomed-in view (boxed area) on the right side of each image illustrates the transmural position of circumferentially orientated cardiomyocytes, i.e., with 0° αh. The transmural position of circumferentially orientated cardiomyocytes in the LVFW remained unchanged of all hearts (left). However, in the septum it progressively shifted toward the RV endocardial (Endo) surface from P1 to P14 (right). Epi, epicardial.
Fig. 7.
Picrosirius red staining of collagen content. Picrosirius red staining and polarized light microscopy in grayscale showing collagen deposition (white) increased progressively during heart development. Trace amounts of interstitial collagen were noted in PB hearts. The collagen area fraction for each image was marked at the bottom right corner.
DISCUSSION
We have quantified the developmental changes of cardiomyocyte architecture in pig hearts using DTMRI and validated these with histology. The major findings are 1) the helical architecture of LV cardiomyocytes was developed as early as MG period and 2) cardiomyocyte architecture in RVFW and septum rapidly changed after birth. These results illustrate the plasticity of cardiomyocyte architecture in response to the new demands of LV and RV function after birth. Given that cardiomyocyte reorganization was mostly completed within 14 days after birth, the first 2 wk is a critical period for postnatal heart development in pigs. To the best of our knowledge, this is the first nondestructive and quantitative report on perinatal developmental adaptations of three-dimensional cardiomyocyte architecture.
Both LV and RV cardiomyocytes are organized the classical helix pattern (2, 42) in all pig hearts. The early development of helical cardiomyocyte architecture by MG may correlate with the initiation of heart pump function after atrioventricular separation and trabeculae formation at this stage (1, 39). This supposition could be supported by the rate of cardiomyocyte architecture maturation in embryonic chicken LVFW, which can be altered by varying the mechanical load (44).
Postnatal changes of cardiomyocyte architecture in RVFW occurred acutely from P1 to P14. Specifically, αh in the endocardium of RVFW decreased ∼20° after birth. Given the critical role of transmural distribution of αh in optimizing ventricular wall stress and strain for cardiac function (7, 33), such postnatal alterations of RV cardiomyocyte architecture may accommodate the rapidly decreased RV workload after the opening of pulmonary circulation and the close of ductus arteriosus and foramen ovale after birth (35).
The transmural distribution of septal cardiomyocyte also changed from P1 to P14. In fetal hearts, the transmural distribution of septal αh, as indicated by the location of 0° αh at 25% transmural depth, was different from that of free wall where the location of 0° αh occurred at 40–45% transmural depth. After birth, however, location of 0° αh in the septum rapidly shifted toward the RV subendocardium. It changed to 45% wall depth by P14, which is close to that observed in adult hearts (50% wall depth). In addition, the volume ratio of LV- versus RV-associated cardiomyocytes in the septum increased progressively from P1 to P14, which corresponds to the increased LV-to-RV wall thickness ratio in the same period. The changes of septal cardiomyocyte organization therefore may accommodate the increased LV workload that occurred rapidly at birth.
Unlike the RVFW and septum, cardiomyocyte architecture in the LVFW remained largely unchanged from PB to P14. From P14 to adult, αh in the subendocardium of LVFW (between 5% and 55% transmural depth) increased ∼10°. Interestingly, αh in the RVFW also showed a trend to increase from P14 to adult despite its early decrease from P1 to P14 (Fig. 4B). Such late increase of endocardial αh in adult heart may be required to accommodate progressively increased LV and RV workload as an animal grows. Overall, the observed rapid changes of cardiomyocyte architecture in newborn hearts suggested the first 2 wk is a critical period for the heart to accommodate the acute changes of cardiac function at birth. Such changes of cardiomyocyte architecture may be partially achieved through transient cardiomyocyte proliferation (Fig. 5), which could lead to 28% increase of LV cardiomyocyte number by 2 wk after birth (4).
The observed increase of collagen deposition in neonatal pig hearts agreed with previous results (8, 30). The newly synthesized and cross-linked collagen provides tensile strength to myocardium in response to increased workload in both normal and diseased hearts (6, 46). In addition, perimyocyte collagen fibers not only provided structural support to individual cardiomyocytes but also grouped myocytes arranged in higher order laminar sheet-like layers (32). Thus collagen is critical for maintaining cardiomyocyte architecture to coordinate global contractile function (17, 34). Given that interstitial collagen deposition likely is responsive to increased mechanical force (5) and the collagen network provides the backbone of cardiomyocyte architecture, the increased interstitial collagen deposition in neonatal hearts may associate with changes in cardiomyocyte architecture to accommodate increased workload that emerges during heart development.
FA is used as an index to describe water diffusion anisotropy and may change in response to various cellular alterations. For example, FA decreases as the cross-sectional area of cardiomyocytes increases from diastole to systole (9). In addition, increased extracellular water content, such as that demonstrated in cerebral vasogenic edema (29), also leads to decreased FA. Our data showed that myocardial FA was higher in newborn groups (P1, P5, and P14) than both fetal and adult groups. The low FA in the fetal hearts might be due to the higher water content that is found in fetal tissue (36). In contrast, the lower FA in adult hearts is likely contributed by physiological hypertrophy of cardiomyocytes. The higher interstitial collagen content in adult hearts may also lead to relative expansion of the extracellular space, thus decreasing FA.
Corresponding to the abrupt increase of LV/RV pressure gradient, the CTI of septum increased ∼80% by P5 and remained unchanged thereafter. Such acute changes of septal curvature, however, have no significant effect on DTMRI determined αh at different ages. Our simulation result showed when CTI = 0.2 (i.e., the shape of septum in MG hearts that is nearly flat), the error of measured αh in the selected ROI, i.e., the center 20° sector of the septum, is <1°.
Limitations
All hearts were fixed by 10% formalin before MRI. It is known that fixation may affect apparent water diffusion coefficient but will not alter cellular orientation or anisotropy (43). Due to the definition of αh in the −90° to 90° range, fold-over artifact is a common problem in cardiomyocyte structure measurement using DTMRI. To minimize this effect, we did our analysis in 20° segments at the center of septum and free wall where the angle fold-over was minimal. The rapid changes of cardiomyocyte architecture in postnatal hearts indicate that more time points before P5 would be useful to develop a more detailed picture of cardiac architectural adaptations. Finally, the molecular programs that instigate these radical changes in response to obvious mechanical cues will need to be worked out, since they could harbor additional clues to pathological remodeling in primary and secondary cardiomyopathies, and in physiological adaptive changes that occur in pregnancy, for example.
GRANTS
This work was supported by American Heart Association Beginning Grant-in-Aid No. 0660057Z (to J. Chen) and National Heart, Lung, and Blood Institute Grant R01 HL-073646–08 (to S. A. Wickline).
DISCLOSURES
No conflicts of interest, financial or otherwise, are declared by the author(s).
AUTHOR CONTRIBUTIONS
Author contributions: L.Z., J.A., and L.H. performed experiments; L.Z. analyzed data; L.Z., S.A.W., and J.C. interpreted results of experiments; L.Z. prepared figures; L.Z. drafted manuscript; L.Z., L.H., S.D.C., S.A.W., and J.C. edited and revised manuscript; S.D.C., S.A.W., and J.C. conception and design of research; S.A.W. and J.C. approved final version of manuscript.
ACKNOWLEDGMENTS
We thank Franklin D. Hockett for advice in coil design and Dr. Huiying Zhang and Noriko Yanaba for help in histological preparations. We appreciate the technical support from Washington University Biomedical MR laboratory on MRI experiment setup.
REFERENCES
- 1. Anderson RH, Webb S, Brown NA, Lamers W, Moorman A. Development of the heart: (2) septation of the atriums and ventricles. Heart 89: 949–958, 2003 [DOI] [PMC free article] [PubMed] [Google Scholar]
- 2. Armour JA, Randall WC. Structural basis for cardiac function. Am J Physiol 218: 1517–1523, 1970 [DOI] [PubMed] [Google Scholar]
- 3. Assali NS, Sehgal N, Marable S. Pulmonary and ductus arteriosus circulation in the fetal lamb before and after birth. Am J Physiol 202: 536–540, 1962 [DOI] [PubMed] [Google Scholar]
- 4. Beinlich CJ, Rissinger CJ, Morgan HE. Mechanisms of rapid growth in the neonatal pig heart. J Mol Cell Cardiol 27: 273–281, 1995 [DOI] [PubMed] [Google Scholar]
- 5. Bishop JE. Regulation of cardiovascular collagen deposition by mechanical forces. Mol Med Today 4: 69–75, 1998 [DOI] [PubMed] [Google Scholar]
- 6. Bishop JE, Lindahl G. Regulation of cardiovascular collagen synthesis by mechanical load. Cardiovasc Res 42: 27–44, 1999 [DOI] [PubMed] [Google Scholar]
- 7. Bovendeerd PH, Arts T, Huyghe JM, van Campen DH, Reneman RS. Dependence of local left ventricular wall mechanics on myocardial fiber orientation: a model study. J Biomech 25: 1129–1140, 1992 [DOI] [PubMed] [Google Scholar]
- 8. Carver W, Terracio L, Borg TK. Expression and accumulation of interstitial collagen in the neonatal rat heart. Anat Rec 236: 511–520, 1993 [DOI] [PubMed] [Google Scholar]
- 9. Chen J, Liu W, Zhang H, Lacy L, Yang X, Song SK, Wickline SA, Yu X. Regional ventricular wall thickening reflects changes in cardiac fiber and sheet structure during contraction: quantification with diffusion tensor MRI. Am J Physiol Heart Circ Physiol 289: H1898–H1907, 2005 [DOI] [PubMed] [Google Scholar]
- 10. Chen J, Song SK, Liu W, McLean M, Allen JS, Tan J, Wickline SA, Yu X. Remodeling of cardiac fiber structure after infarction in rats quantified with diffusion tensor MRI. Am J Physiol Heart Circ Physiol 285: H946–H954, 2003 [DOI] [PubMed] [Google Scholar]
- 11. Clubb FJ, Jr, Bishop SP. Formation of binucleated myocardial cells in the neonatal rat: an index for growth hypertrophy. Lab Invest 50: 571–577, 1984 [PubMed] [Google Scholar]
- 12. Dawes GS, Mott JC, Widdicombe JG. Closure of the foramen ovale in newborn lambs. J Physiol 128: 384–395, 1955 [DOI] [PMC free article] [PubMed] [Google Scholar]
- 13. Eldridge FL, Hultgren HN. The physiologic closure of the ductus arteriosus in the newborn infant. J Clin Invest 34: 987–996, 1955 [DOI] [PMC free article] [PubMed] [Google Scholar]
- 14. Garrido L, Wedeen VJ, Kwong KK, Spencer UM, Kantor HL. Anisotropy of water diffusion in the myocardium of the rat. Circ Res 74: 789–793, 1994 [DOI] [PubMed] [Google Scholar]
- 15. Geerts L, Bovendeerd P, Nicolay K, Arts T. Characterization of the normal cardiac myofiber field in goat measured with MR-diffusion tensor imaging. Am J Physiol Heart Circ Physiol 283: H139–H145, 2002 [DOI] [PubMed] [Google Scholar]
- 16. Gibson AA, Singh GK, Hoffman JJ, Ludomirsky A, Holland MR. Measurements of ultrasonic attenuation properties of midgestational fetal pig hearts. Ultrasound Med Biol 35: 319–328, 2009 [DOI] [PMC free article] [PubMed] [Google Scholar]
- 17. Granzier HL, Irving TC. Passive tension in cardiac muscle: contribution of collagen, titin, microtubules, and intermediate filaments. Biophys J 68: 1027–1044, 1995 [DOI] [PMC free article] [PubMed] [Google Scholar]
- 18. Greenbaum RA, Ho SY, Gibson DG, Becker AE, Anderson RH. Left ventricular fibre architecture in man. Br Heart J 45: 248–263, 1981 [DOI] [PMC free article] [PubMed] [Google Scholar]
- 19. Guerreiro D, Lennox SC, Anderson RH. Postnatal development of the pig heart. Cardiovasc Res 14: 675–679, 1980 [DOI] [PubMed] [Google Scholar]
- 20. Hislop A, Reid L. Weight of the left and right ventricle of the heart during fetal life. J Clin Pathol 25: 534–536, 1972 [DOI] [PMC free article] [PubMed] [Google Scholar]
- 21. Holmes AA, Scollan DF, Winslow RL. Direct histological validation of diffusion tensor MRI in formaldehyde-fixed myocardium. Magn Reson Med 44: 157–161, 2000 [DOI] [PubMed] [Google Scholar]
- 22. Hutchins GM, Bulkley BH, Moore GW, Piasio MA, Lohr FT. Shape of the human cardiac ventricles. Am J Cardiol 41: 646–654, 1978 [DOI] [PubMed] [Google Scholar]
- 23. Jiang H, van Zijl PC, Kim J, Pearlson GD, Mori S. DtiStudio: resource program for diffusion tensor computation and fiber bundle tracking. Comput Methods Programs Biomed 81: 106–116, 2006 [DOI] [PubMed] [Google Scholar]
- 24. Jiang Y, Pandya K, Smithies O, Hsu EW. Three-dimensional diffusion tensor microscopy of fixed mouse hearts. Magn Reson Med 52: 453–460, 2004 [DOI] [PubMed] [Google Scholar]
- 25. Jouk PS, Mourad A, Milisic V, Michalowicz G, Raoult A, Caillerie D, Usson Y. Analysis of the fiber architecture of the heart by quantitative polarized light microscopy. Accuracy, limitations and contribution to the study of the fiber architecture of the ventricles during fetal and neonatal life. Eur J Cardiothorac Surg 31: 915–921, 2007 [DOI] [PubMed] [Google Scholar]
- 26. Jouk PS, Usson Y, Michalowicz G, Grossi L. Three-dimensional cartography of the pattern of the myofibres in the second trimester fetal human heart. Anat Embryol (Berl) 202: 103–118, 2000 [DOI] [PubMed] [Google Scholar]
- 27. Junqueira LC, Bignolas G, Brentani RR. Picrosirius staining plus polarization microscopy, a specific method for collagen detection in tissue sections. Histochem J 11: 447–455, 1979 [DOI] [PubMed] [Google Scholar]
- 28. Li W, Lu M, Banerjee S, Zhong J, Ye A, Molter J, Yu X. Ex vivo diffusion tensor MRI reflects microscopic structural remodeling associated with aging and disease progression in normal and cardiomyopathic Syrian hamsters. NMR Biomed 22: 819–825, 2009 [DOI] [PMC free article] [PubMed] [Google Scholar]
- 29. Lu S, Ahn D, Johnson G, Cha S. Peritumoral diffusion tensor imaging of high-grade gliomas and metastatic brain tumors. AJNR Am J Neuroradiol 24: 937–941, 2003 [PMC free article] [PubMed] [Google Scholar]
- 30. Marijianowski MM, van der Loos CM, Mohrschladt MF, Becker AE. The neonatal heart has a relatively high content of total collagen and type I collagen, a condition that may explain the less compliant state. J Am Coll Cardiol 23: 1204–1208, 1994 [DOI] [PubMed] [Google Scholar]
- 31. Pierpaoli C, Basser PJ. Toward a quantitative assessment of diffusion anisotropy. Magn Reson Med 36: 893–906, 1996 [DOI] [PubMed] [Google Scholar]
- 32. Pope AJ, Sands GB, Smaill BH, LeGrice IJ. Three-dimensional transmural organization of perimysial collagen in the heart. Am J Physiol Heart Circ Physiol 295: H1243–H1252, 2008 [DOI] [PMC free article] [PubMed] [Google Scholar]
- 33. Rijcken J, Bovendeerd PH, Schoofs AJ, van Campen DH, Arts T. Optimization of cardiac fiber orientation for homogeneous fiber strain during ejection. Ann Biomed Eng 27: 289–297, 1999 [DOI] [PubMed] [Google Scholar]
- 34. Robinson TF, Cohen-Gould L, Factor SM. Skeletal framework of mammalian heart muscle. Arrangement of inter- and pericellular connective tissue structures. Lab Invest 49: 482–498, 1983 [PubMed] [Google Scholar]
- 35. Rudolph AM. Fetal and neonatal pulmonary circulation. Annu Rev Physiol 41: 383–395, 1979 [DOI] [PubMed] [Google Scholar]
- 36. Rudolph AM, Heyman MA. Fetal and neonatal circulation and respiration. Annu Rev Physiol 36: 187–207, 1974 [DOI] [PubMed] [Google Scholar]
- 37. Scollan DF, Holmes A, Winslow R, Forder J. Histological validation of myocardial microstructure obtained from diffusion tensor magnetic resonance imaging. Am J Physiol Heart Circ Physiol 275: H2308–H2318, 1998 [DOI] [PubMed] [Google Scholar]
- 38. Scollan DF, Holmes A, Zhang J, Winslow RL. Reconstruction of cardiac ventricular geometry and fiber orientation using magnetic resonance imaging. Ann Biomed Eng 28: 934–944, 2000 [DOI] [PMC free article] [PubMed] [Google Scholar]
- 39. Sedmera D, Pexieder T, Hu N, Clark EB. Developmental changes in the myocardial architecture of the chick. Anat Rec 248: 421–432, 1997 [DOI] [PubMed] [Google Scholar]
- 40. Streeter DD, Jr, Hanna WT. Engineering mechanics for successive states in canine left ventricular myocardium. I. Cavity and wall geometry. Circ Res 33: 639–655, 1973 [DOI] [PubMed] [Google Scholar]
- 41. Streeter DD, Jr, Hanna WT. Engineering mechanics for successive states in canine left ventricular myocardium. II. Fiber angle and sarcomere length. Circ Res 33: 656–664, 1973 [DOI] [PubMed] [Google Scholar]
- 42. Streeter DD, Jr, Spotnitz HM, Patel DP, Ross J, Jr, Sonnenblick EH. Fiber orientation in the canine left ventricle during diastole and systole. Circ Res 24: 339–347, 1969 [DOI] [PubMed] [Google Scholar]
- 43. Sun SW, Neil JJ, Liang HF, He YY, Schmidt RE, Hsu CY, Song SK. Formalin fixation alters water diffusion coefficient magnitude but not anisotropy in infarcted brain. Magn Reson Med 53: 1447–1451, 2005 [DOI] [PubMed] [Google Scholar]
- 44. Tobita K, Garrison JB, Liu LJ, Tinney JP, Keller BB. Three-dimensional myofiber architecture of the embryonic left ventricle during normal development and altered mechanical loads. Anat Rec A Discov Mol Cell Evol Biol 283: 193–201, 2005 [DOI] [PubMed] [Google Scholar]
- 45. Tseng WY, Wedeen VJ, Reese TG, Smith RN, Halpern EF. Diffusion tensor MRI of myocardial fibers and sheets: correspondence with visible cut-face texture. J Magn Reson Imaging 17: 31–42, 2003 [DOI] [PubMed] [Google Scholar]
- 46. Weber KT, Janicki JS, Shroff SG, Pick R, Chen RM, Bashey RI. Collagen remodeling of the pressure-overloaded, hypertrophied nonhuman primate myocardium. Circ Res 62: 757–765, 1988 [DOI] [PubMed] [Google Scholar]
- 47. Weis SM, Emery JL, Becker KD, McBride DJ, Jr, Omens JH, McCulloch AD. Myocardial mechanics and collagen structure in the osteogenesis imperfecta murine (oim). Circ Res 87: 663–669, 2000 [DOI] [PubMed] [Google Scholar]
- 48. Whittaker P, Kloner RA, Boughner DR, Pickering JG. Quantitative assessment of myocardial collagen with picrosirius red staining and circularly polarized light. Basic Res Cardiol 89: 397–410, 1994 [DOI] [PubMed] [Google Scholar]
- 49. Wu Y, Wu EX. MR study of postnatal development of myocardial structure and left ventricular function. J Magn Reson Imaging 30: 47–53, 2009 [DOI] [PubMed] [Google Scholar]


