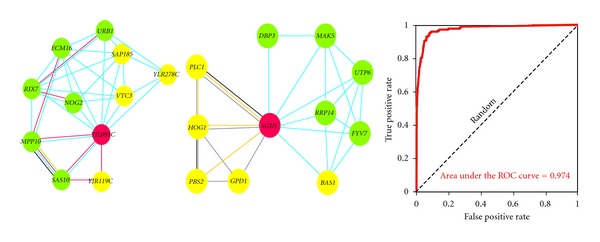
Figure 3.

Predicted ribosome biogenesis genes are labeled as red nodes. Green nodes are the known ribosome biogenesis genes, and yellow nodes are genes that are not related to the ribosome biogenesis. Edge color indicates coexpression (light blue), affinity purification (red), yeast two-hybrid assay (green), genetic interaction (yellow), cocitation (gray), and literature curation (black). The ROC curve shows cross-validated recovery of the known ribosome biogenesis genes based on their network connectivity to one another. (This open-access figure was reproduced from Li et al., [25].)
