

Abstract
This study was undertaken to assess the contribution of protein adsorption and cell growth to increases in electrode impedance that occur immediately following implantation of cochlear implant electrodes and other neural stimulation devices. An in vitro model of the electrode-tissue interface was used. Radiolabelled albumin in phosphate buffered saline was added to planar gold electrodes and electrode impedance measured using a charge-balanced biphasic current pulse. The polarisation impedance component increased with protein adsorption, while no change to access resistance was observed. The maximum level of protein adsorbed was measured at 0.5 μg/cm2, indicating a tightly packed monolayer of albumin molecules on the gold electrode and resin substrate. Three cell types were grown over the electrodes, macrophage cell line J774, dissociated fibroblasts and epithelial cell line MDCK, all of which created a significant increase in electrode impedance. As cell cover over electrodes increased, there was a corresponding increase in the initial rise in voltage, suggesting cell cover mainly contributes to the access resistance of the electrodes. Only a small increase in the polarisation component of impedance was seen with cell cover.
1. Introduction
Following implantation of any foreign substance, the body responds to heal the injury and to remove any foreign debris from the area. With large biocompatible materials such as cochlear implants and other neural prostheses, where removal is not possible, fibrous tissue is formed that effectively seals the foreign body, separating it from the rest of the body.
Studies in several animal models have shown a correlation between changes in intracochlear electrode impedance and the degree of tissue growth around the electrode array (Shepherd et al. 1990; Ni et al. 1992; Shepherd et al. 1994; Charlet de Sauvage et al. 1997; Xu et al. 1997). This is also observed in other implantable electrodes such as cardiac pacemaker and subcutaneously-implanted electrodes (Hirshorn et al. 1984; Grill et al. 1994). A feline version of the Melbourne/Cochlear Ltd electrode array with electrode surface areas of around 0.38mm2 was used to assess impedance changes following implantation in the cochlea (Ni et al. 1992; Shepherd et al. 1994). Prior to implantation, the total electrode impedance measured between 2.5 – 3.5 kΩ in saline. These values were observed to increase over time by varying amounts following chronic implantation, from 3 – 6 kΩ. One case showed an increase to over 12 kΩ. A correlation was found between the rise in impedance and the fibrous tissue capsule and the incidence of inflammatory cells near the array (Ni et al. 1992, Shepherd et al. 1994).
There are several means of describing the changes in electrode impedance of cochlear implant electrodes. In this paper, we use total impedance (Zt) as a measure of the peak voltage (Vt) seen following the application of the charge-balanced current pulse (Figure 1). By modelling the electrode as a “leaky” capacitor and resistor (RC circuit, Figure 2), the voltage waveform may be further broken down into resistive and reactive components (Shepherd et al. 1990). Access resistance (Ra) is calculated from the initial rise in voltage (access voltage, Va) and deemed to be the resistive component of the electrode-tissue interface depicted in Figure 2. Due to the highly capacitive nature of the electrode-tissue interface, the voltage continues to rise for the duration of the pulse. In this paper, this rise is termed polarisation voltage (Vp) and is presumed to be dependent on the reactive components of the interface. The RC circuit expresses this rise in terms of the polarisation capacitance (Cp) and polarisation resistance (Rp) (Figure 2). At the completion of the current pulse, the voltage drops similarly to its initial rise, with a sharp decline (equivalent to Va), followed by the gradual leakage of charge from Cp and Rp.
Figure 1.

(a) An example of the biphasic current waveform used. This stimulus had a peak current amplitude (i) of 0.5 mA, 50 μs/phase, and 5 μs interphase gap, giving a geometric charge density of 50 μC/cm2; (b) The resulting voltage waveform across the small active electrode and the larger common electrode in response to the current pulse was recorded, and using Ohm’s Law, total impedance (Zt), access resistance (Ra) and polarisation impedance (Zp) were calculated using Vt/i, Va/i and Vp/i respectively.
Figure 2.

An equivalent circuit model for the electrode-tissue interface. Ra is access resistance, Rp is the polarisation resistance, Cp is the polarisation capacitance and i is the current. The voltage drop over the Ra is defined as the access voltage Va. The polarisation impedance Zp is formed using the polarisation voltage Vp, the voltage drop over both Rp and Cp.
Total impedance (Zt) and access resistance (Ra) are the common measures taken when categorising electrode impedance in vivo (Ni et al. 1992; Xu et al. 1997). When implanted, both Zt and Ra vary over time and across animals (Shepherd et al. 1990). Generally, Zt reflects changes in Ra, supporting the hypothesis that changes in electrode impedance of implanted electrodes are due to changes in the interface environment. While changes in Zp exist in vivo, few studies have been published. Tykocinski et al. (2001) showed a small increase in Zp (described as Zpol) immediately following implantation of a highly roughened electrode array, with most changes in total impedance occurring due to increases in Ra.
Protein adsorption onto the material surface is the first reaction that occurs to medical devices implanted in the body (Tang et al. 1999; Shen et al. 2001), and the same reaction is observed for electrodes implanted into the fluid-filled scala tympani of the cochlea. The perilymph contained within the scala tympani is protein rich, similar to a diluted form of blood plasma (Thalmann et al. 1994). All proteins are known to rapidly adsorb onto surfaces and in doing so, form a layer upon which cell growth can occur (Horbett 1993). Such adsorption of protein is also likely to increase electrode impedance. However, the effect of a protein layer on impedance has not often been studied. Gross et al (1993) showed only a minor effect of protein adsorption on the electrode performance, whereas Wegener et al (1996) suggested capacitance decreased due to the adsorption of the contents in the media to the electrode surface. A decrease in capacitance equates to an increase in impedance. Note that while the presence of protein contributes to an increase in impedance, it also reduces the level of dissolution of stimulating platinum electrodes (Robblee et al. 1980)
At 1–2 g/L, albumin is the most abundant protein present within the perilymph (Arrer et al. 1990). While albumin is considered an inert protein and does not readily encourage subsequent cell growth (Horbett 1993), the large concentration of albumin in perilymph made it a suitable protein to use for investigation of the effect of protein adsorption on electrode impedance. In the present study, protein levels on the electrode were measured using a radioisotope of iodine covalently attached to amino acids within the albumin protein.
After protein adsorption occurs on an electrode array implanted in the cochlea, macrophages are attracted to the foreign body. Macrophages have been observed in the cochlea within 10 hours of an immunological assault (Garcia Berrocal et al. 2000). They can exist at the site of injury for weeks and secrete chemotactic factors and cytokines to attract other immune cells and fibroblasts (Weaver et al. 1995). In the presence of a foreign body, macrophages adhere to the surface and can remain attached for the life of the implant (Anderson 2001). The macrophage cell line, J774, was used in the present study to assess changes in electrode impedance with macrophage cell growth.
Following the influx of macrophages, fibroblasts are attracted to the surface. Fibroblasts adhere to the implant, usually on top of the macrophages. A fibrous capsule forms around the implant as fibroblasts proliferate and produce collagen and proteoglycans (Anderson 1994). Descriptions of the fibrous tissue matrix surrounding cochlear implant electrode arrays indicate the presence of fibroblasts within the connective tissue (Schindler et al. 1974; Duckert 1983; Shepherd et al. 1983; Gyo 1988; Xu et al. 1997). In the present study the relationship between electrode impedance and fibroblast cell growth was measured using fibroblasts dissociated from post-natal rat epithelium.
The fibrous tissue matrix formed around the electrode array is difficult to mimick in culture (in vitro). The behaviour of cells is altered when in vitro, with the macrophage and fibroblast studies involving only a single layer of cells on the electrode surface. Single layers of fibroblasts in vitro are not able to secrete collagen, hence a fibrous tissue matrix was not produced. The effect of the tissue matrix on electrode impedance was instead modelled using Maudin-Darby Canine Kidney epithelial (MDCK) cells. These cells form tight junctions between adjacent cells, such that the layer of epithelia not only forms adhesions to the surface of the electrode but also to each other. The use of MDCK cells in electrode impedance studies is well established (Lo et al. 1995; Janshoff et al. 1996; Wegener et al. 1996; De Blasio et al. 2004), although the purposes of these studies differed from the current study.
As described above, there are several accounts of cell growth and fibrous tissue matrix formation around chronically-implanted electrode arrays in the cochlea (Shepherd et al. 1990; Ni et al. 1992; Shepherd et al. 1994; Charlet de Sauvage et al. 1997; Xu et al. 1997; Tykocinski et al. 2001). However, not all histological samples show this, with some implanted cochleae present with little to no fibrous tissue growth. To overcome individual and species variations in fibrous tissue formation, the in vitro model was used to determine the relative effect of cell growth and protein adsorption on electrode impedance. The studies in this paper have also been able to determine the effect of cell growth and protein adsorption on the total electrode impedance (Zt) and its components, access resistance and polarization impedance (Ra and Zp respectively).
This work has been designed to obtain a greater understanding of biochemical and cellular response to implanted electrodes. In doing so, it is hoped that insight may be gained into techniques capable of chronically reducing electrode impedance. A more efficient electrode-tissue interface would lead to power reductions of cochlear implants and other neural prostheses.
2. Methods
Most of the experimental methods used in this paper have been published previously (Newbold et al. 2004). A brief description is included below.
2.1. In vitro electrode design
Disposable slides with thin-film gold electrode arrays from the Electric Cell-Substrate Impedance Sensing (ECIS) Cultureware range (Applied BioPhysics) were used in conjunction with electrical components built in-house (Newbold et al. 2004). The surface area of the small active electrode in each of the eight wells in the slide was approximately 0.05 mm2. The surface area of the larger common counter electrode within each well was approximately 21.8 mm2 (Figure 3).
Figure 3.

A schematic diagram of the ECIS slide. Each of the eight wells contained one small active electrode and a part of the large common counter electrode. Bipolar electrode pairs were made from each active electrode paired with the common electrode.
2.2. Electrode impedance measurement
Impedance was measured from the voltage waveforms recorded following the application of a charge-balanced biphasic current pulse. A battery-operated, optically-isolated stimulator, built in-house, was used in conjunction with an isolated digital oscilloscope (Tektronix, THS710 TekScope).
An example of the current pulse used and the resulting voltage waveform is shown in Figure 1. The pulse shown in Figure 1a had an amplitude of 0.5 mA (peak), pulse width of 50 μs, an interphase gap of 5 μs and was presented at 100 pulses per second (pps). The geometric charge density created by this pulse was 50 μC/cm2/phase. Electrodes were shorted between pulses to minimise direct current build-up (Huang et al. 1999).
Electrode impedance values were extracted from the recorded voltage waveform developed between the small active electrode and the larger common electrode. Total impedance (Zt) was calculated by measuring the voltage at the end of the first phase, (Vt of Figure 1b), with Ohm’s law used to determine the resulting impedance (Zt = Vt/i). Access resistance (Ra) was calculated by first finding the voltage at 7 μs, joining a line between this point and Vt, and using the equation of this line to predict the voltage at 0 μs (Va, i.e. the start of the pulse in Figure 1b) (Seligman 2002). This value was also converted into impedance (Ra = Va/i). Polarisation impedance (Zp) was found by calculating the difference in Vt and Va (defined as Vp, Figure 1b) and was in turn converted into impedance (Zp = Vp/i) (Tykocinski et al. 2001).
2.3. Protein adsorption study
Initial electrode impedance was measured with phosphate buffered saline (PBS) only in each well of the ECIS slides. The parameters of the biphasic current pulse were as follows: single pulse, 0.5 mA amplitude, 50 μs pulse width and a 25 μs interphase gap. Wells were washed with distilled water (dH2O). Five micrograms of bovine serum albumin (BSA, Sigma) were radioactively labelled with 0.75 mCi Na 125Iodine (125I) using the chloramine-T method by ProSearch International. Fifty microlitres of radiolabelled albumin (125I BSA), diluted in PBS at various concentrations, was added to each well and the slides were placed in an incubator at 37°C for two hours to allow for adequate protein adsorption (Horbett 1993; Kotwal et al. 2001). Table 1 summarises the amount of protein applied to each electrode well and the numbers of electrodes in each group. Wells were aspirated and washed once more with PBS and dH2O to remove any excess unadsorbed protein. Additional PBS was added to each well and the impedance was measured again. Squares of 20 mm2 were cut around each active electrode was cut and placed in 0.2 ml eppendorf tubes, which in turn were placed within 12 × 75 mm polypropylene tubes. Gamma rays emitted from 125I BSA on the electrode squares were detected using a gamma counter using the one minute 125I setting (Packard Cobra II AutoGamma). The output measurements are called counts per minute (cpm) and describe the amount of radiation emitted by the sample at the energy level of the 125I isotope.
Table 1.
Details of protein adsorption study.
| Group | N | Protein conc. applied (μg/μl) | Total protein applied (μg) |
|---|---|---|---|
| 1 | 24 | 0 | 0 |
| 2 | 24 | 0.1 | 5 |
| 3 | 24 | 0.5 | 25 |
| 4 | 24 | 0.75 | 37.5 |
| 5 | 24 | 1 | 50 |
| 6 | 24 | 2 | 100 |
A standard curve of radiation measurements from known concentrations of 125I BSA was performed with each experiment, achieving a linear relationship between the cpm and the known content of the labelled BSA solutions. The cpm achieved for each protein sample was in excess of the background levels (6,000 – 30,000 cpm compared with 0 – 100 cpm). This signified that results were well above the limits of detection.
The final impedance values (post protein adsorption) were then compared with the levels of 125I BSA detected on the electrodes. Factors affecting the electrode impedance values were analysed using the general linear model (GLM), with protein count and protein applied as explanatory variables. Significance was determined using p-values of less than 0.05. The amount of variance explained by the variables was evaluated using R2adj, and tests of normality were conducted on each analysis’ residuals.
2.4. Cell growth study
Cell-free Dulbecco’s Modified Eagle (DME) medium was added to all wells of the ECIS slides and impedance was measured. The parameters of the biphasic current pulse used for impedance measurement were as follows: 100 pps pulse train, 0.5 mA amplitude, 50 μs pulse width and a 5 μs interphase gap. After this, two of the eight wells of each slide were left with cell-free DME medium and used as controls. The remaining wells were plated with J774 cells, MDCK cells or dissociated rat fibroblasts (the dissociation procedure was outlined previously (Newbold et al. 2004)) at cell densities varying from 9×10³ to 3.6×10⁵ cells/cm2 in 500 μl of cell growth medium (DME medium (Life Technologies) containing 10% foetal bovine serum (FBS, Trace Scientific) and 1% penicillin/streptomycin/amphotericin (PSA) solution (Sigma-Aldrich)). Arrays were placed in a humidified incubator at 37°C and 10% CO2 at all times except when measuring impedance which was performed at room temperature, a process taking approximately 20 minutes.
After 24 hours, impedance values were measured again. Cells were then fixed using 4% paraformaldehyde in PBS. After washing in PBS, cells were incubated in 82.5 nM phalloidin fluoroisothiocyanate (FITC, Sigma-Aldrich), which stains actin green. Each electrode was coverslipped with a DAPI (4′, 6 diamidino-2-phenylindole) anti-fade mounting medium (Vector Laboratories), which counterstains the DNA blue. When staining MDCK cells, 0.1% Triton-X 100 (t-Octylphenoxypolyethoxy-ethanol; Sigma-Aldrich) in PBS was added to cells for at least 5 minutes after fixing and prior to staining with FITC. This allowed phalloidin to penetrate the cells more effectively.
The slides were viewed under an epifluorescent microscope (Zeiss Axioplan Digital Microscope) and each electrode was photographed with a digital camera (Zeiss AxioCam MRm). The proportion of electrode area covered by cells was measured using in-house software that assessed the amount of green and blue fluorescence (cell covered), or blue fluorescence (nucleus covered), against the black (uncovered) electrode background. In total, there were 66 control electrodes with no cell cover, 72 electrodes with J774s, 96 electrodes with rat fibroblasts and 72 electrodes with MDCKs.
The factors affecting the final impedance values of all cell types in the cell growth study were analysed using the GLM with cell type (J774, fibroblast or MDCK), initial cell-free impedance, cell cover and nucleus cover as explanatory variables. Each cell type was then analysed separately using regression. Significance was determined using p-values of less than 0.05. The amount of variance explained by the variables was evaluated using R2adj, and tests of normality were conducted on each analysis’ residuals.
3. Results
3.1. Protein adsorption study
The amount of protein adsorbed onto the electrodes was significantly affected by the concentration of protein solution applied (p < 0.001). This relationship is plotted in Figure 4, with a power function showing the best fit (R2adj = 0.72). This graph shows the amount of protein adsorbed onto the electrode surface plateaued at around 0.5 to 1 μg/μl of BSA in the PBS solution.
Figure 4.

The amount of protein adsorbed onto each electrode against the protein concentration applied to each well. The protein adsorbed was measured using the gamma counter and compared against the standard curve and presented relative to the area of the surface tested.
Two examples of the voltage waveforms from this study are shown in Figure 5 and compare electrodes with and without protein adsorption. A substantial difference between the shape of the first and second phase was seen for both waveforms. This difference was also observed for the clean electrodes when altering the pulse rate of the measurement stimulus (data not shown). In both cases shown in Figure 5 a single pulse, rather than a pulse train, was used to calculate the impedance. It is assumed that the single pulse is not long enough for the electrode to reach equilibrium and as such the two phases of the pulse are recorded as out of balance.
Figure 5.
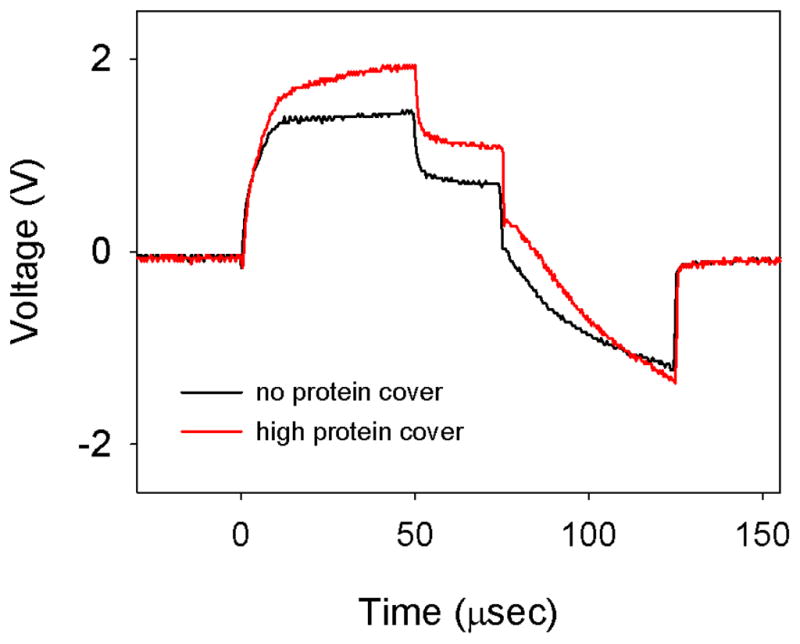
Representative voltage waveforms from the protein adsorption study, measured in PBS. A waveform from an electrode with no protein cover is shown with black. A waveform from an electrode with a high level of protein cover (0.5 μg/cm2) is shown in red. Note that the flat top of the first phase of these voltage waveforms (compare Figure 2b) was due to the use of a single pulse, rather than a pulse train, to measure impedance.
Statistical analysis (GLM) of the electrode impedance values calculated from the voltage waveforms showed a strong relationship between the protein count and both the total impedance (Zt) and polarisation impedance (Zp) (p<0.001). This relationship was not seen with access resistance (Ra).
The amount of protein adsorbed on the electrode surface was determined by comparing the protein counts measured for each electrode square against the standard curve conducted for each experiment. Plots of electrode impedance values with the resulting adsorbed protein concentration showed a linear relationship between the variables (Figure 6); an increase in adsorbed protein resulted in an increase in Zt and Zp. No significant relationship was determined between Ra and protein cover. Using linear regression, the greatest protein cover measured created a 17% increase in Zt (from 3.5 kΩ to 4.1 kΩ), with a 60% increase in Zp (from around 1.0 kΩ to 1.6 kΩ).
Figure 6.
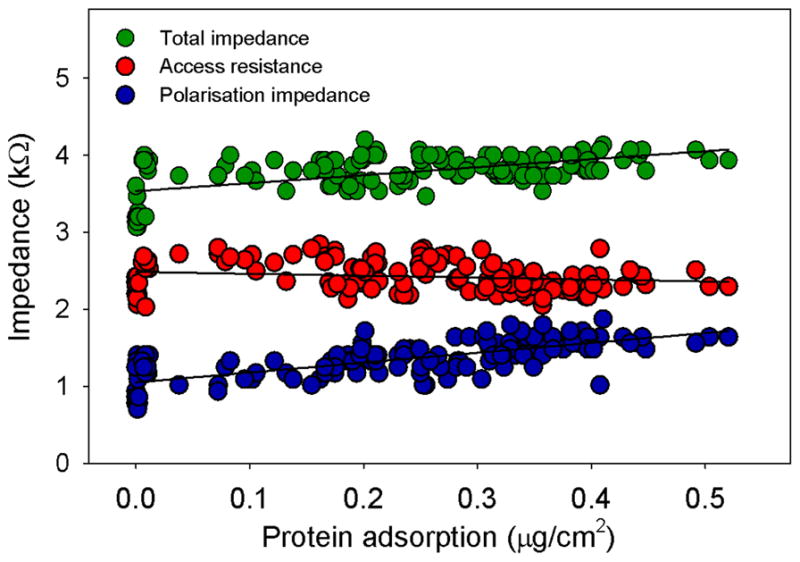
Plots of the electrode impedance values against the protein adsorption measured for each electrode.
3.2. Cell growth study
Some results of the cell growth study have been published previously in a paper validating the in vitro model (Newbold et al. 2004). These data are represented, with additional details on the effect of cell growth on Ra and Zp, as well as the effect of cell number on impedance.
All cell types exhibited growth on the electrode surface (Figure 7). Fibroblasts were recorded to cover up to a maximum of 60% of the electrode area. When fibroblasts grew to greater densities, the sheet of cells would delaminate during fixation and staining, resulting in the complete loss of cells covering the electrode. Macrophages also covered up to approximately 60% of the electrode area, although several electrodes showed 80% and 100% cover. MDCK cells showed a range of cell growth up to complete (100%) electrode coverage. As highlighted by the DAPI stain in the cell nucleus, the number of cells covering the electrode also varied between and within the different cell types. A large variation in the number of MDCK cells required to completely cover the electrode was seen (Figure 8). As the numbers of cells growing on the electrode increased, the size of each cell was reduced. The tight junctions between MDCK cells allow the cells to adhere strongly to each other as they multiply.
Figure 7.

Cell growth over electrodes. A) and D) macrophage cell line (J774), B) and E) dissociated rat fibroblasts, and C) and F) epithelial cell line (MDCK). Cells in A–C were stained with Phalloidin FITC (green) and DAPI (blue). The circle indicates the location of the electrode. D–F are scanning electron micrographs taken on a Philips XL30 FEG Field Emission Scanning Electron Microscope. Scale bars for A–C represents 50 μm and for D–F represents 20 μm.
Figure 8.

Example of cell coverage over electrodes with MDCK cells. A) An electrode with incomplete cell cover, with relatively few large cells. B) An electrode completely covered with cells of a mid-size. C) An electrode with complete cell coverage with a large number of smaller cells. The circle represents the location of the electrode. Scale bar represents 50 μm. Cells were stained with Phalloidin FITC (green) and DAPI (blue).
Examples of the voltage waveforms from this study are shown in Figure 9 comparing electrodes with and without cell growth over the electrodes. The spikes seen at the pulse onset were due to the stray capacitance of the equipment used.
Figure 9.

Representative electrode voltage waveforms from the cell growth study. A waveform from an electrode with no cell cover is shown with black. A waveform from an electrode with complete cell cover (MDCK cells) is shown in red.
A strong relationship between electrode impedance values and cell growth was recorded. When cell types were analysed together, complete cell cover over the electrodes resulted in over a 60% increase in Zt (from a mean of 3.44 kΩ to 5.63 kΩ). The majority of the changes in Zt were due to increases in Ra (from 1.7 kΩ to 3.4 kΩ). A smaller but still significant effect of cell growth on Zp was also seen, with complete cell cover increasing Zp by 28% (from 1.75 kΩ to 2.24 kΩ). Figure 10 shows the relationships between cell cover and the electrode impedance values.
Figure 10.

Scatter plot of the changes in the electrode impedance values with cell cover over the electrode (all cell types).
A second measure of cell growth on electrode impedance was also used: the proportion of the electrode covered with cell nuclei, as indicated by the positive DAPI label. This gave an indication of the number of cells on the electrode. When cell types were considered together, the electrode impedance values were predicted similarly for both cell and nucleus cover measures. GLM analyses of all electrodes showed cell and nucleus cover, as well as the cell type, were significant predictors for each impedance value (p < 0.001).
When considering macrophages alone, cell cover was shown to be the greatest predictor of the electrode impedance values. Fibroblast cell and nucleus cover were both shown to significantly affect their corresponding impedance values. Similarly, impedance values of electrodes with MDCK cell growth was significantly affected by both cell and nucleus cover, with the exception of Zp where only cell cover was significant.
The relationship between cell and nucleus cover for each cell type is shown in Figure 11. These have been compared with Ra values for each cell type. Macrophages demonstrated a linear relationship between cell and nucleus cover, with a ratio of 1: 0.6 (cell: nucleus). Fibroblasts also showed a linear relationship between cell and nucleus cover but with a lower ratio than that of macrophages (1: 0.37, cell: nucleus). The relationship between MDCK cell and nucleus cover was not suitably explained by a linear regression. A ceiling effect was seen in cell cover, such that 100% cell cover was seen with increasing levels of nucleus cover. This created a nonlinear relationship between cell cover and Ra, whereas a linear relationship was seen between nucleus cover and Ra.
Figure 11.

Scatter plots of the relationships between cell cover, nucleus cover and access resistance (Ra). A), B) and C) show Ra against cell cover for each cell type, D), E) and F) show Ra against nucleus cover for each cell type. G), H) and I) show the relationship between cell and nucleus cover for each cell type. Data from macrophages are shown in A), D) and G); fibroblasts shown in B), E) and H); while MDCKs shown in C), F) and I).
4. Discussion
It is important to understand the interaction of proteins and cells with the electrode surface in order to develop potential techniques to control this interaction. This study demonstrated that protein adsorption increased the polarisation component of electrode impedance when measured with a biphasic current pulse. The maximum level of protein adsorbed was measured at 0.5 μg/cm2, indicating a tightly packed monolayer of albumin molecules on the gold electrode and resin substrate. A maximum increase of 17% in total electrode impedance was seen following protein adsorption.
The extent of cell coverage over in vitro electrodes was observed to significantly affect electrode impedance when measured with a biphasic current pulse. These results were dependent on the cell type, with MDCK cells showing the greatest barrier to current flow, followed by fibroblasts and then macrophages. An increase in cell cover over electrodes created a corresponding increase in the initial rise in voltage, i.e. cell cover mostly affected the access resistance of the electrodes. A small but significant increase in the polarisation component of the impedance was also seen with increased cell cover.
Protein adsorption in monolayer
The maximum concentration of protein on the gold electrode and resin surface was measured at 0.5 μg/cm2, produced with the application of 2 μg/μl 125I BSA diluted in PBS. While various literature on albumin cite adsorptions between 0.014 and 0.2 μg/cm2 (Brash et al. 1984; Kurrat et al. 1997; Valagao Amadeu do Serro et al. 1999), measurements of up to 4 μg/cm2 (human serum albumin) have been recorded on a smooth titanium oxide surface (Sousa et al. 2004). Proteins often adsorb as monolayers but at higher concentrations have been known to form multilayer adsorption. Using the size of the albumin molecule and its molecular mass, Sousa et al (2004) estimated the surface occupied by molecules lying perpendicular or parallel to the surface. Theoretical values for closely packed monolayers ranged between 0.214 and 0.79 μg/cm2 (side-on and end-on adsorption respectively). These values suggest the protein adsorption measured in the current study remained as a monolayer. The highest values of protein cover seen (up to 0.5 μg/cm2) indicate a tight packing of protein on the electrode/resin surface.
Another point of interest was the proportion of protein that was adsorbed from the applied protein solutions. Figure 4 showed protein uptake started to plateau with protein solution concentrations of approximately 0.5 μg/μl of BSA. A similar response was seen with human serum albumin prepared in PBS for protein adsorption to titanium oxide, in this case 1 μg/μl was shown to be near the onset of the adsorption plateau (Sousa et al. 2004).
Protein adsorption increased polarisation impedance
The maximum albumin adsorption measured on the gold electrodes resulted in a 15% increase in Zt, when using a biphasic current pulse of 0.5 mA. The majority of changes were due to increases in the polarisation component (Zp), with a 60% increase in Zp observed with the maximum protein adsorption. There was little change in Va, indicating that protein cover had an insignificant effect on Ra. The effect of protein on the polarisation and capacitive elements of the waveform was consistent with previous electrochemical studies (Wegener et al. 1996; de Ficquelmont-Loizos et al. 1997; Franks et al. 2005). Franks et al (2005) showed coatings of laminin and poly-L-lysine on platinum electrodes resulted in a reduction of the capacitance measure, thereby increasing overall electrode impedance. Human serum albumin was also shown to increase impedance on glassy carbon electrodes, with capacitance increasing to a plateau approximately 20 minutes after the addition of protein (de Ficquelmont-Loizos et al. 1997). Importantly, the biphasic impedance changes brought about by protein adsorption on the gold electrodes behaved similarly to that seen using other electrochemical impedance measurement techniques.
Cell growth increased access resistance
Cell growth on electrode surfaces was associated with impedance increases proportional to the percentage of electrode area covered by cells. The change in the overall impedance (Zt) was mostly due to large changes in the initial rise of the access resistance (Ra). A small increase in the polarisation component of impedance (Zp) was also seen. This result agrees with the previous assumptions that changes in Ra are associated with changes in the bulk solution (Tykocinski et al. 2005).
Cell types affected impedance
As described previously, differences were seen in the impedance characteristics of the three cell types assessed (Newbold et al. 2004). MDCKs created the greatest effect on impedance, followed by fibroblasts, and then macrophages (J774s). The increased impedance associated with MDCK cell cover may have been due to the formation of tight junctions between MDCK cells (Lo et al. 1995; Janshoff et al. 1996; Wegener et al. 1996), or due to the larger number of MDCK cells grown over the electrode compared to the other cell types.
Differences in the growth capabilities of the cell types were also present. Complete cell cover over the electrode was possible with the MDCK cells, whereas it was less easily obtained with J774s or fibroblasts. Fibroblast cell confluences of 60% or higher resulted in the loss of attachment of the cells to the substrate (and/or electrode) and subsequent cell death. These differences in cell growth conditions alone provided enough variation to show a statistically significant distinction between the impedance of each cell type.
Possible current paths with cell cover
The largest change in electrode impedance with cell growth occurred when MDCK cells were confluent over the electrode surface. As the number of cells over the electrode increased (measured by the amount of nucleus cover), electrode impedance rose significantly. Previous studies have hypothesized there are several possible paths for current to pass between two electrodes via a layer of cells: from base of cell to apex; from side of cell to apex; and between cells through tight junctions (if present) (Lo et al. 1995). A variation of this premise relating to the cell growth study is illustrated in Figure 12. Three possible current paths are shown: via the cell-free electrode through media only; between adjacent cells; and through the cells. When cell growth over the electrode was low, the resulting electrode impedance values were likely to be strongly related to the decreasing surface area of the electrode. As cell cover increased up to 100% confluence, changes in the current path were expected with increasing impedance. The impedance of electrodes showing 100% cover with MDCK cells was expected to be affected by the impedance of current passing between the cells (i.e. tight junctions) and/or through the cells themselves.
Figure 12.

Schematic of the effect of cell cover on the impedance of an electrode. Three possible pathways for charge existed (in order of increasing impedance): via the medium where there was no cell cover, between the cells and through the cell membrane.
Experimental limitations and future work
The choice of protein and the use of PBS as the dilution medium for the protein solution was an area for potential discrepancies. Protein adsorption on foreign surfaces is a complex phenomenon, dependent on pH, temperature, ionic concentration, among other factors (Kurrat et al. 1997). The present experiment used albumin from bovine serum, diluted in PBS as a model for the human equivalent in perilymph. However, the particular amino-acid composition of protein is known to affect the adsorption behaviour, with differences in adsorption characteristics seen between human and bovine serum albumin (Kurrat et al. 1997). Perhaps of more importance was the chemical content of the liquid used for the protein solution. The presence of calcium and phosphate ions was found to reduce protein adsorption on titanium oxide surfaces (Valagao Amadeu do Serro et al. 1999). The phosphates in PBS were also found to stabilise the native structure of the protein, altering the adsorption and desorption process (Kurrat et al. 1997). However, comparisons between experiments within this study would still hold true.
While similar trends of impedance changes would be expected, the surface of the electrode material can affect protein adsorption. It was likely that the adsorption profile of the sputtered gold electrode would be different from that of thick film platinum electrodes. Comparisons among analogous materials show surface roughness can also affect protein adsorption. Evaluations of two types of titanium oxide surfaces showed less protein adsorption on the rougher surface (Sousa et al. 2004). However, the benefit of the lower impedance resulting from increasing the surface roughness could be overwhelmed by the changes that occur with tissue growth when electrodes are used in vivo. Implantation of semi-porous high surface area platinum electrodes showed tissue growth and presumably protein adsorption increased electrode impedance overwhelmed the initial electrical advantages gained by increasing the surface area (Tykocinski et al. 2001).
In the presence of multiple protein types, competitive adsorption occurs such that albumin may not remain adhered to the electrode surface in the cochlea. An hierarchical adsorption process was shown to exist where high concentration proteins dominate at the surface initially, but were displaced by proteins with a higher affinity as time passed (Andrade et al. 1986). Perilymph, like plasma, contains hundreds of protein types (Thalmann et al. 1994). While albumin is by far the most abundant, depending on the surface and its chemical attraction, albumin may not be the most competitive at adsorption for the long-term. Dynamic changes in protein adsorption may also occur with changes in the inflammatory response following implantation. It is not known whether a different protein choice would have affected the change in impedance in this situation.
Assessment of the impedance to protein relationship also relied on the assumption that BSA adsorbed equally to the gold electrode and the resin substrate. The 0.05 mm2 electrode was minuscule in comparison with the 20 mm2 square analysed, which mostly contained the Novolac resin substrate. As has already been stated, protein is known to adhere differentially to substrates with different surface chemistries. Thus it was unlikely that the albumin would adhere similarly to the gold and resin. This premise suggests that the magnitudes of protein adsorption measured in this experiment, while shown to correlate with electrode impedance, may not be accurate.
Single layers of cells on a planar electrode were used to model the effect of a fibrous tissue capsule around a banded or half-band electrode. While the tight junctions of the MDCK cells go some way towards mimicking the strong binding of cells to the surface of the electrode, they are still a monolayer system. Future studies may consider using three-dimensional tissue culture or explanted tissue.
These results provide some insight to mechanisms on changes in impedance following implantation of electrodes. The effects of electrical stimulation on electrode impedance need also be assessed in the presence of protein and cell growth.
Acknowledgments
This work was funded by the Commonwealth of Australia through the establishment of the HEARing CRC and its predecessor. J774 and MDCK cell lines were gifts from Wendy Carter at The Walter and Eliza Hall Institute of Medical Research. Statistical guidance was provided by Associate Professor Ian Gordon from the Statistical Consulting Centre at the University of Melbourne. The epifluorescent microscope was purchased by the National Institutes of Health contract NIH-N01-DC-3-1005. Dr Stephen Scott-Young developed the software used for cell cover measurement. Prof Robert Shepherd is currently funded by the National Institutes of Health contract NIDCD HHS-N-263-2007-00053-c.
References
- Anderson JM. Inflammation and the Foreign Body Response. Problems in General Surgery. 1994;11(2):147–160. [Google Scholar]
- Anderson JM. Biological responses to materials. Annual Review of Material Research. 2001;31:81–110. [Google Scholar]
- Andrade JD, Hlady V. Protein Adsorption and Materials Biocompatibility: A Tutorial Review and Suggested Hypotheses. Advances in Polymer Science. 1986;79:1–63. [Google Scholar]
- Arrer E, Oberascher G, et al. A map of cochlear perilymph protein based on high-resolution two-dimensional electrophoresis. European Archives of Oto-Rhino-Laryngology. 1990;247(5):271–273. doi: 10.1007/BF00176534. [DOI] [PubMed] [Google Scholar]
- Brash JL, ten Hove P. Effect of plasma dilution on adsorption of fibrinogen to solid surfaces. Thrombosis & Haemostosis. 1984;51(3):326–330. [PubMed] [Google Scholar]
- Charlet de Sauvage R, Lima da Costa D, et al. Electrical and physiological changes during short-term and chronic electrical stimulation of the normal cochlea. Hearing Research. 1997;110(1–2):119–134. doi: 10.1016/s0378-5955(97)00066-x. [DOI] [PubMed] [Google Scholar]
- De Blasio BF, Laane M, et al. Combining optical and electrical impedance techniques for quantitative measurement of confluence in MDCK-I cell cultures. Biotechniques. 2004;36(4):650–654. 656, 658. doi: 10.2144/04364RR01. passim. [DOI] [PubMed] [Google Scholar]
- de Ficquelmont-Loizos M, Takenouti H, et al. Long-time and short-time investigation of the electrode interface through electrochemical impedance measurements. Application to adsorption of human serum albumin onto glassy carbon rotating disc electrode. Journal of Electroanalytical Chemistry. 1997;428:129–140. [Google Scholar]
- Duckert LG. Morphological changes in the normal and neomycin perfused guinea pig cochlea following chronic prosthetic implantation. Laryngoscope. 1983;93(7):841–855. doi: 10.1288/00005537-198307000-00001. [DOI] [PubMed] [Google Scholar]
- Franks W, Schenker I, et al. Impedance characterization and modeling of electrodes for biomedical applications. IEEE Transactions on Biomedical Engineering. 2005;52(7):1295–1302. doi: 10.1109/TBME.2005.847523. [DOI] [PubMed] [Google Scholar]
- Garcia Berrocal JR, Ramirez-Camacho R. Immune response and immunopathology of the inner ear: an update. Journal of Laryngology & Otology. 2000;114(2):101–107. doi: 10.1258/0022215001905021. [DOI] [PubMed] [Google Scholar]
- Grill WM, Mortimer JT. Electrical properties of implant encapsulation tissue. Annals of Biomedical Engineering. 1994;22(1):23–33. doi: 10.1007/BF02368219. [DOI] [PubMed] [Google Scholar]
- Gross GW, Rhoades BK, et al. Stimulation of monolayer networks in culture through thin-film indium-tin oxide recording electrodes. Journal of Neuroscience Methods. 1993;50(2):131–143. doi: 10.1016/0165-0270(93)90001-8. [DOI] [PubMed] [Google Scholar]
- Gyo K. Histological study of chronic electrode implantation through the round window of the guinea pig. Acta Oto-Laryngologica. 1988;105(3–4):248–254. doi: 10.3109/00016488809097005. [DOI] [PubMed] [Google Scholar]
- Hirshorn MS, Holley LK, et al. Histological evaluation of porous titanium cardiac pacemaker electrode tips. Journal of Biomedical Materials Research. 1984;18(1):47–60. doi: 10.1002/jbm.820180107. [DOI] [PubMed] [Google Scholar]
- Horbett TA. Principles underlying the role of adsorbed plasma proteins in blood interactions with foreign materials. Cardiovascular Pathology. 1993;2(3):137S–148S. [Google Scholar]
- Huang CQ, Shepherd RK, et al. Electrical stimulation of the auditory nerve: direct current measurement in vivo. IEEE Transactions on Biomedical Engineering. 1999;46(4):461–470. doi: 10.1109/10.752943. [DOI] [PubMed] [Google Scholar]
- Janshoff A, Wegener J, et al. Double-mode impedance analysis of epithelial cell monolayers cultured on shear wave resonators. European Biophysics Journal. 1996;25(2):93–103. doi: 10.1007/s002490050021. [DOI] [PubMed] [Google Scholar]
- Kotwal A, Schmidt CE. Electrical stimulation alters protein adsorption and nerve cell interactions with electrically conducting biomaterials. Biomaterials. 2001;22(10):1055–1064. doi: 10.1016/s0142-9612(00)00344-6. [DOI] [PubMed] [Google Scholar]
- Kurrat R, Prenosil JE, et al. Kinetics of Human and Bovine Serum Albumin Adsorption at Silica-Titania Surfaces. Journal of Colloid & Interface Science. 1997;185(1):1–8. doi: 10.1006/jcis.1996.4528. [DOI] [PubMed] [Google Scholar]
- Lo CM, Keese CR, et al. Impedance analysis of MDCK cells measured by electric cell-substrate impedance sensing. Biophysical Journal. 1995;69(6):2800–2807. doi: 10.1016/S0006-3495(95)80153-0. [DOI] [PMC free article] [PubMed] [Google Scholar]
- Newbold C, Richardson R, et al. An in vitro model for investigating impedance changes with cell growth and electrical stimulation: implications for cochlear implants. Journal of Neural Engineering. 2004;1(4):218–227. doi: 10.1088/1741-2560/1/4/005. [DOI] [PubMed] [Google Scholar]
- Ni D, Shepherd RK, et al. Cochlear pathology following chronic electrical stimulation of the auditory nerve. I: Normal hearing kittens. Hearing Research. 1992;62(1):63–81. doi: 10.1016/0378-5955(92)90203-y. [DOI] [PubMed] [Google Scholar]
- Robblee LS, McHardy J, et al. Electrical stimulation with Pt electrodes. V. The effect of protein on Pt dissolution. Biomaterials. 1980;1(3):135–139. doi: 10.1016/0142-9612(80)90035-6. [DOI] [PubMed] [Google Scholar]
- Schindler RA, Merzenich MM. Chronic intracochlear electrode implantation: cochlear pathology and acoustic nerve survival. Annals of Otology, Rhinology & Laryngology. 1974;83:202–216. doi: 10.1177/000348947408300208. [DOI] [PubMed] [Google Scholar]
- Seligman PM. Internal Technical Memo. Melbourne: Cochlear Ltd; 2002. Electrode impedance vs Current level and pulse width; pp. 1–30. [Google Scholar]
- Shen M, Horbett TA. The effects of surface chemistry and adsorbed proteins on monocyte/macrophage adhesion to chemically modified polystyrene surfaces. Journal of Biomedical Materials Research. 2001;57(3):336–345. doi: 10.1002/1097-4636(20011205)57:3<336::aid-jbm1176>3.0.co;2-e. [DOI] [PubMed] [Google Scholar]
- Shepherd RK, Clark GM, et al. Acta Oto-Laryngologica - Supplement. Supplement 399. 1983. Chronic electrical stimulation of auditory nerve in cats: physiological and histopathologic results; pp. 19–31. [DOI] [PubMed] [Google Scholar]
- Shepherd RK, Franz BK-H, et al. The biocompatibility and safety of cochlear prostheses. In: Clark GM, Tong YC, Patrick JF, editors. Cochlear Prostheses. Melbourne: Churchill Livingstone; 1990. pp. 69–98. [Google Scholar]
- Shepherd RK, Matsushima J, et al. Cochlear pathology following chronic electrical stimulation of the auditory nerve: II. Deafened kittens. Hearing Research. 1994;81(1–2):150–166. doi: 10.1016/0378-5955(94)90162-7. [DOI] [PubMed] [Google Scholar]
- Sousa SR, Moradas-Ferreira P, et al. Human serum albumin adsorption on TiO2 from single protein solutions and from plasma. Langmuir. 2004;20(22):9745–9754. doi: 10.1021/la049158d. [DOI] [PubMed] [Google Scholar]
- Tang L, Eaton JW. Natural responses to unnatural materials: A molecular mechanism for foreign body reactions. Molecular Medicine. 1999;5(6):351–358. [PMC free article] [PubMed] [Google Scholar]
- Thalmann I, Kohut RI, et al. Protein profile of human perilymph: in search of markers for the diagnosis of perilymph fistula and other inner ear disease. Otolaryngology - Head & Neck Surgery. 1994;111(3 Pt 1):273–280. doi: 10.1177/01945998941113P117. [DOI] [PubMed] [Google Scholar]
- Tykocinski M, Cohen LT, et al. Measurement and analysis of access resistance and polarization impedance in cochlear implant recipients. Otology & Neurotology. 2005;26(5):948–956. doi: 10.1097/01.mao.0000185056.99888.f3. [DOI] [PubMed] [Google Scholar]
- Tykocinski M, Duan Y, et al. Chronic electrical stimulation of the auditory nerve using high surface area (HiQ) platinum electrodes. Hearing Research. 2001;159(1–2):53–68. doi: 10.1016/s0378-5955(01)00320-3. [DOI] [PubMed] [Google Scholar]
- Valagao Amadeu do Serro AP, Fernandes AC, et al. Bovine serum albumin adsorption on titania surfaces and its relation to wettability aspects. Journal of Biomedical Materials Research. 1999;46(3):376–381. doi: 10.1002/(sici)1097-4636(19990905)46:3<376::aid-jbm10>3.0.co;2-t. [DOI] [PubMed] [Google Scholar]
- Weaver DL, Leslie KO. Normal Inflammatory Response to Injury; Normal Inflammatory Responses to Microorganisms; Undesirable Inflammatory Responses. New York: McGraw-Hill Inc; 1995. [Google Scholar]
- Wegener J, Sieber M, et al. Impedance analysis of epithelial and endothelial cell monolayers cultured on gold surfaces. J Biochem Biophys Methods. 1996;32(3):151–170. doi: 10.1016/0165-022x(96)00005-x. [DOI] [PubMed] [Google Scholar]
- Wegener J, Sieber M, et al. Impedance analysis of epithelial and endothelial cell monolayers cultured on gold surfaces. Journal of Biochemical & Biophysical Methods. 1996;32(3):151–170. doi: 10.1016/0165-022x(96)00005-x. [DOI] [PubMed] [Google Scholar]
- Xu J, Shepherd RK, et al. Chronic electrical stimulation of the auditory nerve at high stimulus rates: a physiological and histopathological study. Hearing Research. 1997;105(1–2):1–29. doi: 10.1016/s0378-5955(96)00193-1. [DOI] [PubMed] [Google Scholar]