

Abstract
The use of physical activity monitors in population-based research has increased dramatically in the past decade. In this report we review the major purpose for using physical activity monitors in different types of population-based study (i.e., surveillance, intervention, association studies) and discuss the strengths and weaknesses for the various behavioral outcomes derived from monitors for each study type. We also update and extend previous recommendations for use of these instruments in large-scale studies, particularly with respect to selecting monitor systems in the context of technological advances that have occurred in recent years. The current state of the science with respect to optimal measurement schedules for use of physical activity monitors is also discussed. A Checklist and Flow Chart are provided so that investigators have more guidance when reporting key elements of monitor use in their studies.
Keywords: behavior, energy expenditure, sedentary, measurement, health
INTRODUCTION
Population-based research can include purely observational study designs (i.e., surveillance or association studies) and experimental studies (i.e., interventions), often employing sample sizes ranging from hundreds to thousands. Requirements for large and representative samples present unique challenges for using accelerometers to gather information about relevant characteristics of physical activity behaviors, and necessitate many pragmatic decisions when planning studies and analyzing the resulting data. These decisions can have important implications for the estimates of behavior obtained for the populations studied (18). We present information that will help simplify physical activity monitor implementation for new users and aid the ability of readers of published studies to easily identify successful methods that will increase the quality and efficiency of future population-based studies.
Because population-based studies vary substantially in their measurement objectives, we first outline common indicators of physical activity obtained from physical activity monitors, summarize the major purpose of physical activity assessment for each type of study, and discuss the strengths and weaknesses of using these monitors in the context of different population-based study designs. We update and extend previous recommendations for using physical activity monitors in field-based research outlined by Trost, McIver, and Pate in 2005 (33), including information about selecting a monitor in light of technological advances that have occurred in recent years. Approaches that have been used successfully in large population-based studies are highlighted and we provide a Checklist and Flow Chart for selecting physical activity monitors and reporting their use.
COMMON PHYSICAL ACTIVITY INDICATORS OBTAINED FROM PHYSICAL ACTIVITY MONITORS
In this section we briefly outline the most common indicators of activity behavior obtained from physical activity monitors, and highlight important elements of the estimates as they relate to population-based studies. For a more detailed treatment of this content, please see the paper by Butte and colleagues in this issue (ref). Physical activity monitors may be used to estimate total or physical activity energy expenditure in absolute units (e.g., kcal/d) or indices that are expressed relative to body mass. They also can provide direct measures of specific behaviors (e.g., steps per day) and classes of behavior based on intensity or body posture (9;17;30;40), or indirect measures through inference from activity counts (6;29). Activity counts represent raw movement signals and characterize the duration and intensity of movement of the device. These elemental movement signals can be translated into estimates of energy expenditure using regression-based models (8;19). Increasingly sophisticated modeling of densely sampled monitor data (e.g., raw acceleration or 1-second epochs) recently have been used to identify specific types of behavior (6;25;29;40) and energy expenditure (6;26;29;39). Common indicators obtained from physical activity monitors are listed in Table 1, with distinctions made between absolute and relative values.
Table 1.
Common estimates of behavior obtained from physical activity monitors.
| Types of Estimates* | Types of Summary Values | |
|---|---|---|
| Absolute | Relative* | |
| Activity Count-based Measures | Total counts (counts/d) | Average counts (counts/min/d) |
| Expenditure-based Measures | ||
| Total energy expenditure | kcal/d | kcal/hr monitored |
| Physical activity energy expenditure | MET-min or MET-hr/d | MET-min/d/hr monitored |
| Intensity-based Measures | ||
| Sedentary (< 2.0 METS) | hrs/d | % wear/monitored time |
| Light (2.0-2.9 METS) | hrs/d | % wear/monitored time |
| Moderate (3.0-5.9 METS) | hrs/d | % wear/monitored time |
| Vigorous (≥ 6.0 METS) | hrs/d | % wear/monitored time |
| Posture-based Measures | ||
| Lying | hrs/d | % wear/monitored time |
| Sitting | hrs/d | % wear/monitored time |
| Standing | hrs/d | % wear/monitored time |
| Stepping | hrs/d | % wear/monitored time |
| Steps | per day | per day/hr monitored |
values are obtained directly or estimated using prediction equations
Information obtained from individual days of observation also can be translated into summaries of an activity pattern over the course of a 7-day measurement period, or relative to patterns within an observed day. For example, accelerometers can estimate the prevalence of meeting moderate-to-vigorous activity guidelines (10;20;32), the number and length of activity bouts (10;32), breaks in sedentary time (12), or transitions between sitting and standing (11). Finally, while the availability of contextual information (e.g., location, purpose of behavior) is frequently absent from physical activity monitor output, such information can be incorporated with monitor data by synchronizing other contextual information with the data using information from logs or the Global Positioning System (GPS).
PHYSICAL ACTIVITY MONITOR USE CONSIDERATIONS BY STUDY TYPE
Given the distinct measurement objectives of different population-based study designs, we next describe three designs and emphasize nuances related to physical activity monitor use in each. The main distinction is the unit of analysis and whether the objective is to estimate values for a population or for an individual.
Surveillance and Intervention Studies: A Focus on Data at the Population Level
In general, these studies are designed to estimate characteristics of physical activity behaviors in a population at a specific point in time. The important indicators of behavior in these studies are at the level of the population (e.g., group means, prevalence estimates).
Public health surveillance studies provide information for public health planning and are designed to quantify and track the distribution of risk factors and health outcomes in the population (31). Information about the location and purpose of activity behaviors are desirable in surveillance because public health objectives frequently focus on specific types of activity, such as the proportion of trips adults make by walking.
Intervention studies are designed to test the effectiveness of an intervention to change specific activity behaviors or health outcomes in groups of individuals. Here, the populations of interest are the experimental groups. Change in behavior is evaluated by comparing mean values of the behavioral outcome within groups over time, or by comparing mean differences between groups during follow-up. In studies using physical activity monitors, the assumption is that the intervention will change the behavior targeted by the intervention (e.g., walking for exercise 3 d/wk), and that this will result in a change in level of overall behavior. It is conceivable that an intervention could be effective in changing targeted behaviors, but real changes in these behaviors could have little or no effect on the overall levels measured by the monitors because of compensation in related behaviors, the dilution of the effect due to averaging several days of observation, or because they do not always adequately measure some behaviors (e.g., cycling).
As noted previously, the main objective of these studies is to estimate values at the population level from representative samples. For this reason, less stringent inclusion criteria (e.g., fewer valid days) and a higher level of random error in the measurements at the individual level may be acceptable because these errors may not bias the population averages, and loss of precision may be overcome by increasing sample size (3). Surveillance and intervention studies are unique in that they have a compelling need to retain a high level of representativeness of their original study sample in the final analysis. It may be reasonable to use less stringent physical activity monitor inclusion criteria in these studies to advance this objective.
Association Studies: A Focus on Data at the Individual Level
Association studies test hypotheses that an activity-related behavior, such as sitting time or moderate-to-vigorous physical activity, is associated with an outcome of interest. Etiologic studies evaluate the relations between levels of behavior and risk of disease, or putative risk factors for disease, and less emphasis may be placed on the means by which an individual achieved their level of behavior. Most hypothesis tests in these studies involve an evaluation of linear trends in the relation between activity and the outcome of interest, but the dose-response relation also can be of interest. Similarly, correlative studies seek to understand the association between selected psychosocial constructs (e.g., self-efficacy) that may predict specific types of physical activity behavior (e.g., exercise), or environmental factors within a given context (e.g., sidewalks in the neighborhood) that may influence certain behaviors (e.g., walking for exercise or transportation). Physical activity monitors may be particularly well-suited for such studies, although issues related to the most appropriate exposure window, natural variability in behavior over time (e.g., months or years), and the need for contextual information must be considered (34;37).
The internal validity of association studies may be more susceptible to errors at the individual level than surveillance or intervention studies, particularly for dose-response studies (3). Errors at the individual level lead to misclassification of exposure, resulting in loss of statistical power and attenuation of the effect sizes (14). The primary means of reducing these errors is through use of a physical activity monitor that is highly precise and by sufficiently reducing levels of intra-individual variation. Measurement error correction methods may be useful for minimizing the influence of intra-individual variation (28;34).
STRENGTHS AND WEAKNESSES OF PHYSICAL ACTIVITY MONITOR MEASURES
Physical activity monitors have a number of overarching strengths. First, they provide objective measures of physical activity behaviors that are free of the random and systematic errors associated with self-report. As such they are generally believed to provide better assessments for many activities, particularly activities that have proved difficult to measure by self-report (e.g., walking). In the past decade, physical activity monitors have been successfully used in many large-scale population-based studies (e.g., (10;23;32)). The instruments used in these studies, typically worn for 7-day periods, have proven to be acceptable to participants. For example, the National Health and Nutrition Examination Survey (NHANES) includes a US population-based sample of individuals aged 6 to 85 years. Among NHANES participants who wore the devices for at least 10 hours on at least one day, 79% provided 3 or more days of valid data (21), although compliance varied by age group (32). From a technical perspective, the instruments used in these studies have generally proven to be reliable and rugged on repeated use, and the number of instruments lost has been acceptable.
Newer physical activity monitor methods that have employed direct measures of body posture have provided new insights into the relation between activity patterns and health. The amount of time adults spend standing upright can be as high as 5 to 8 hours per day (11;15) and the difference between time spent in sitting and standing behaviors is an important determinant of physical activity energy expenditure (17;36) and metabolic health (13). Furthermore breaks in sedentary time appear to influence metabolic risk factors (12). We have noted similarly high levels of upright behaviors using the activPAL (PAL Technologies, LTD, Glasgow, UK) (9) among healthy middle aged adults and cancer survivors entering an exercise intervention (Figure 1). Of the approximately 16 hours of daily monitoring, these adults engaged in roughly 48 individual bouts of active and sedentary behavior (i.e., transitions between sitting and standing/stepping), spent an average of about 5 hours upright, and about 70% of upright time was spent standing still.
Figure 1.
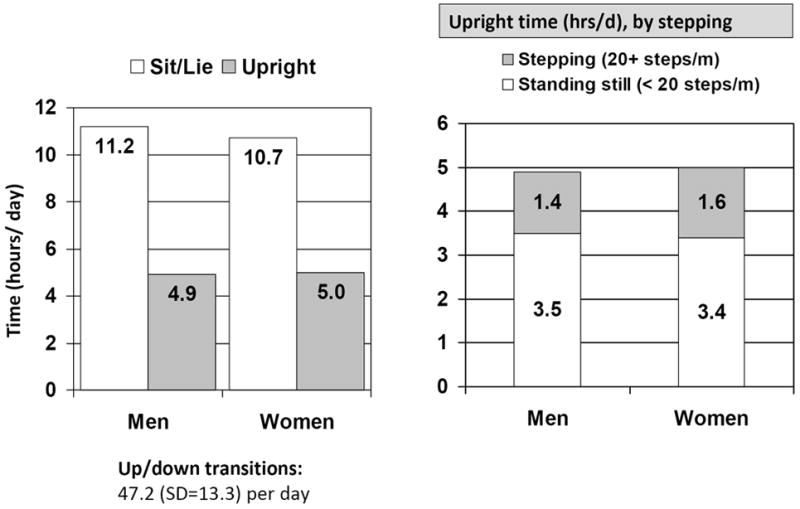
Distribution of time in upright/active and sedentary behaviors in healthy controls and cancer survivors (N=95)
However, physical activity monitors also have at least three weaknesses that should be recognized. First, the accuracy and precision of instruments that are currently available in the marketplace—largely single monitor devices worn on the waist or upper arm—can be limited for certain types of upright behaviors that have a low ambulatory component and that may involve upper body work. The amount of time spent in these behaviors is only now being described (e.g., Figure 1), and future monitor calibration efforts should include common upright activities in their calibration protocols. In recent years, a considerable effort has been made to enhance the ability of physical activity monitors to capture these behaviors, and methods that have used sophisticated treatment of densely sampled data (e.g., 1- to 10-second epochs) to select appropriate prediction equations (8), classify types of behavior (6;30) or derive expenditure (26) appear to be more successful than were initial efforts to develop a single regression equation to account for a wide range of behaviors (19).
Second, information about the location or purpose of individual activities is limited, unless information from other sources is integrated with information from the monitor. Lack of information about where and why behavior is done may be a greater weakness for surveillance and intervention designs than association studies because of the need for surveillance studies to specifically classify behavior. Technological solutions using GPS are being developed, but behavioral logs that allow integration of location and purpose of behavior with physical activity monitor data also may be useful. However, the use of additional monitoring systems can add to the burden on participants and study staff.
Third, a particular challenge for large population-based studies is that the infrastructure to use the instruments and process the large volumes of data obtained from the field using automated high throughput data reduction methods remains limited. Available software from the monitors generally do an excellent job interacting with the device during the initialization and downloading steps, and provide a means of visualizing results from the individual date files. However, post-processing of the data requires staff to carry out of a number of quality control checks, and determine participants’ wearing time and compliance with the initial protocol. Standardized quality control procedures are needed to identify and flag bad data that may result from monitor malfunctions, participant tampering, unknown responses (e.g., out of range values), and human error (e.g., errors at time of initialization). Integrating a core set of quality control indicators and estimates of wearing time into the data download (or export) process could serve to simplify use of the devices in large population-based studies and further standardize the methods employed by different research groups.
BEST PRACTICES RECOMMENDATIONS FOR USING PHYSICAL ACTIVITY MONITORS IN STUDIES
In this portion of this paper we seek to update previous monitor selection recommendations (33), comment on recent developments regarding physical activity monitor measurement schedules, add additional detail related to the distribution and retrieval of devices in studies, and provide a Checklist and Flow Chart with guidance for reporting in future studies.
Selecting a Physical Activity Monitor
Selecting a physical activity monitor system for a particular project depends on the objectives of the study and the resources available to purchase and use the instruments. The needs of, and resources available to, individual studies can vary substantially, so general selection recommendations necessarily must reflect a diversity of useful options for researchers while considering the burden on participants and staff in the implementation phase. A wide range of high-quality instruments are currently available in the marketplace. Given the rapid technological advancements in the field, we refer the reader to other papers in this supplement for these details and offer only general monitor selection recommendations here. Waist-mounted single sensor/unit devices have been the mainstay of activity monitoring, but instruments placed on the upper arm (35), wrist (24), thigh (9), ankle (5), and foot are now available. Multi- and single-site systems that evaluate both body posture and motion (9;40) and multi-sensor systems that monitor physiologic signals (7;35) have emerged in recent years.
Earlier recommendations indicating that use of multiple sensors did not add enough additional information to warrant their implementation (33) has fortunately given way to physical activity monitor systems that can translate densely sampled movement data from multiple sensors and provide highly accurate representations of many activities. The relatively new ability to store densely sampled movement information in memory as either raw acceleration data or information in 1-second epochs now appears to provide the opportunity to mine a rich data source and make better estimates about activity type and intensity. The earliest of these multi-sensor systems (16;40) appear to have better measurement properties than previous single-sensor waist-mounted devices.
Several important questions remain to be answered, however. First, will single unit (single placement site) devices perform as well as systems that employ sensors in multiple sites? Will use of physiological signals, such as body heat or heart rate, provide additional useful information above and beyond the movement information? Preliminary evidence suggests that better differentiation between sitting and standing may be obtained from multiple sensors located on different parts of the body (30), or in carefully selected anatomical locations (9), compared to single devices worn at the waist (29). In one small study that used sensors in multiple sites, heart rate added very little above and beyond the collective information from the sensors (30).
As noted by Trost et al. (33), one must consider the cost of obtaining the monitoring systems (i.e., hardware and software), supplies to attach the devices (e.g., belts, or adhesives), availability and cost of technical support and repairs, and the ease of use and flexibility of each system’s analysis software. The emergence of multi-sensor systems also warrants consideration of acceptable levels of participant burden. Investigators selecting physical activity monitors will face trade-offs between simpler systems that may offer less precision for certain behaviors and more accurate but potentially more burdensome and costly systems. Accordingly, monitors should be selected to have an acceptable level of burden and for their ability to assess the characteristics of behavior that are of greatest interest to the investigative team. This characteristic could be step counts through relatively low-cost pedometry, moderate-to-vigorous ambulatory activity through waist-mounted accelerometers, or body position and energy expenditure through an array of sensors.
Determining the Measurement Schedule
In planning a study, investigators must first establish the goals for the amount of time monitored each day (i.e., a valid day), the number of days of monitoring in the target sampling period, and possibly the number of monitoring periods required.
How Many Hours of Monitoring Each Day?
Two sampling frames have typically been used in physical activity monitor studies. Investigators have employed either a 24-hour sampling period, which encompass both sleep and waking time, or they have used only the waking day as the sampling period. Sampling behavior within the waking day is perhaps the most commonly employed approach in activity-oriented monitor studies. Some consensus has emerged around the use of a 10-hour per day minimum to determine adequate wearing in most studies, but some studies may select alternate thresholds depending on their objectives and the population studied.
How Many Days of Monitoring?
The “number of days needed” problem has typically been approached by quantifying the variability in repeated measures of behavior and then using these measurements to estimate the number of days required to minimize intra-individual variation (33). Behavioral variation in physical activity monitor measures have traditionally been estimated using the classical measurement error model and the intra-class correlation coefficient (ICC; ICC = σB2 / (σB2 + σW2 / n)), where σB2 is the between subjects (inter-individual) variance,σW2 is the within subjects (intra-individual) variance, and n is the number of days. Total variation (denominator) is reduced by increasing the number of days (n). More sophisticated measurement error models have recently been proposed that account for correlations in behavior between days over the measurement period (2). It has been suggested that earlier estimates of the number of days needed to reliably measure activity behavior may have been overestimated by use of simpler measurement error models and the intra-class coefficient (2) because of violations in the assumptions associated with these models. However, it is unclear how large the violations in the model assumptions may have been or the extent to which estimates of the number of days required may have been biased. Studies are needed to clarify whether initial estimates that 7 days of monitoring capture a sufficiently high level of inter-individual variation are reasonable for surveillance and intervention studies, or if a larger number of days of observation or multiple measurement periods are appropriate.
However, determining the optimal monitoring period depends in part on the study design and purpose. For example, 7-day monitoring periods have been routinely used in physical activity monitor studies because they provide a sufficiently large number of days to achieve intra-class correlations of more than 80% in most populations, while also providing the opportunity to sample behavior on both week and weekend days. For surveillance and intervention studies that are interested in levels of behavior in a specific time-frame, we see no compelling reason at present to recommend alternate measurement schedules, particularly given the cost of using monitors even once in large-scale studies. Optimization of measurement schedules in these studies requires balancing the number of days of measurement and the cost of using monitors in one or more measurement periods (4).
In contrast, association studies may be interested in determining habitual (or long-term) patterns of behavior. The relevant exposure window for a given outcome may be the past year, past 5 years, or a longer time period. Here the question is not only, “How many days are needed?” but, “How many assessment periods, spaced over what time period, are needed?” The answer to this question will depend in part on the etiologic question being investigated. When multiple assessment periods are not possible in the full study sample, measurement error correction methods that employ multiple assessments in a sub-group of the cohort may enable adjustment for natural variation in behavior over time (28;34).
Using Physical Activity Monitors in Studies
In this section, we discuss how to estimate the number of physical activity monitors required for a study, monitor placement, initialization and downloading, distribution and retrieval of the devices, contact with participants, and data processing after it is downloaded.
Determining the Number of Monitors Needed
The number of physical activity monitors needed for a particular study is determined by the maximum number of participants in the study in a given measurement period (e.g., 7 days); the speed with which the monitors can be distributed, worn, retrieved, and prepared for subsequent use; and the number of monitors that are lost or fail. For example, if a study plans to measure 500 participants for one 7-day period evenly spaced over 50 weeks, the maximum number of participants measured in a given week would be 10. If it takes an average of 2 weeks to collect data for one participant and prepare the monitor for distribution for the next, the study would need to maintain at least 20 working physical activity monitors to maintain data collection. If 3 monitors were lost or broken in 100 administrations (3% loss/failure rate), the study would need an additional 15 devices over 500 administrations in order to maintain its stock of monitors. Thus, about 35 devices would be required to complete the study comfortably.
Placing Monitors
Physical activity monitors can be placed on the body in several positions, and validity has been evaluated for data obtained from monitors worn at the waist, back, ankle, and wrist. The choice of position on the body depends on the characteristics of behavior desired and the monitor selected. They can be affixed to participants using adhesive pads placed on the skin, waistband clips, and elastic belts. Vinyl bracelets, like those used in hospitals for patient identification, can be used for waterproof wrist-worn physical activity monitors. Monitors can be worn under or over clothing, but should be fit snugly against the body.
Initializing Monitors
Initialization is the process of preparing a physical activity monitor to collect data. Depending on the make and model, researchers must make decisions about parameters for data collection that are programmed during the initialization process. First, researchers must program a date and time to begin recording data. As a general rule, the monitor should be programmed to begin recording at midnight on the first day it is to be worn by the participant, and should be set to record for the maximum amount of time in case the monitoring period needs to be extended to make up for days of non-wear.
Second, researchers must define, if possible, how often the motion signals recorded by the instruments should be aggregated (i.e., epoch length). When selecting a physical activity monitor for purchase or use, researchers must consider the capability and extent to which a given monitor may allow modification of the epoch length. Shorter epochs provide finer data resolution, but may limit the number of days of observation that are possible, if memory capacity or battery life are substantially reduced.
Increasingly, the technical capabilities of physical activity monitors allow for sampling acceleration in smaller epochs. Epoch lengths should be set to values that are as short as possible, preferably less than 10 seconds, but that allow the device to capture data over the number of days of monitoring established as the goal. Densely sampled data can be converted to 1-minute epochs and processed using conventional analytic methods until more robust methods for processing the shorter epochs are widely available.
Distributing Physical Activity Monitors
Methods for distributing monitors to participants will largely be dictated by cost, study design, and sample size. Face-to-face distribution is more feasible for smaller studies, but mail-out distribution may be more efficient for larger studies. An advantage of face-to-face distribution is that staff can demonstrate the proper placement of the physical activity monitor on the participant’s body and answer questions about the wearing procedure. After the monitoring period ends, participants may return the device personally, or mail it back to the researcher using a postage-paid pre-addressed mailing envelope with protective packaging.
Regardless of how physical activity monitors are distributed, study staff should give participants an instruction sheet describing proper care for the device while it is in their possession. Contact information for study personnel should be provided in case participants have questions or problems during the monitoring period. A photo depicting proper placement on the body should be included on the instruction sheet, and note on the device which way is up to indicate proper positioning. All participants should be given a logbook to record the time they put on and take off the monitor during each monitoring day. It also is advisable to ask participants to record the time they get out of bed in the morning and go to bed at night. If the physical activity monitor is removed during the day, participants should record how long it was not worn and the activity they were doing during that period. The logbook can be completed at the end of each day of monitoring. The logbook is an important tool to verify compliance with monitoring protocols or to troubleshoot reasons for problem data after information has been downloaded. If participants are mailing monitors back to the study center, they should be reminded to include their logs in the package.
Tracking Monitors and Participant Contact
Based on our experiences, 5% of physical activity monitors may be lost when distributing through the mail if participants are not contacted by telephone and reminded to wear and return monitors. The time for circulating monitors in the field for 7 days can be up to 4 weeks from initialization to initialization when distributed by mail, or as short as 2 weeks for exclusively in-person contacts. Creating a database is helpful for tracking physical activity monitors, and should include monitor serial numbers, critical dates, initials of the study personnel who had contact with monitor and participant. Staff should call, email, or text message participants to remind participants to wear and return the instruments. If a participant is unable to wear the physical activity monitor during the designated period, a date suitable for re-administration should be arranged. If the monitor and/or logbook is not returned within 5 working days after the end of a monitoring period, staff should follow up with the participant by telephone. If the monitor still has not been returned, another telephone call is warranted and staff may need to arrange to pick up the monitor, if possible.
Retrieving Monitor Data
After the physical activity monitor is returned, staff should follow the manufacturer’s instructions for downloading the collected data. Once the data are downloaded to the data repository, they should be visually reviewed by study personnel to provide an initial compliance and quality control check. If compliance or technical problems are identified at this step, study staff may choose to arrange a second attempt at wearing the monitor if the participant remains amenable. Next, the data file should be prepared for import into a statistical analysis program for careful quality control and compliance checking and analysis.
Enhancing Compliance
Participant compliance with the protocol has important implications for the precision of the estimates obtained and maintaining representation in the final analytic sample. Although overall compliance in studies of large populations has been high, there is substantial room for improvement. For example, in the 2003-2004 NHANES, 26% of children and adults provided fewer than 4 valid days of observation. Similarly, 21% of a population-based sample of Swedish adults provided fewer than 4 valid days of wear time (10). Some large studies conducted in children (22) and in challenging study populations (e.g., individuals with Alzheimer’s disease (38)) have had poorer compliance compared to healthy populations. Relatively little systematic research has been conducted in this area, but Sirard et al. (27) evaluated four strategies to achieve monitoring compliance in high school students, and found that monetary compensation was best (96% compliance), followed by keeping a daily journal (85%), receipt of three phone calls in the monitoring period (72%), and a control condition (70%). Although monetary compensation was clearly the most successful method in this study, it was notable that a lower cost method (daily journal) also was effective. Collective experience of several large-scale studies additionally indicates that good compliance can be achieved by providing clear instructions for wearing the instruments and use of time on/off logs, and that additional financial incentive may be useful.
BEST PRACTICES RECOMMENDATIONS FOR REPORTING METHODOLOGICAL DECISIONS
In recent years, and particularly after the publication of several influential papers (18;33), investigators have been more consistent in reporting and standardizing methods when using physical activity monitors in population-based studies. This has been a welcome advance.
In an effort to further strengthen the body of literature from future studies we developed the following Checklist (Table 2) and Flow Chart (Figure 2) to aid new investigators in using physical activity monitors and to help authors develop an approach to reporting monitor use in population-based studies. These tools also are designed to help support decisions made in the peer review process and facilitate the ability of readers to evaluate implementation procedures and identify successful approaches for use in future studies. Reporting these methodological decisions will further enhance comparability across studies and clearly define why study teams made potentially substantive decisions. We would like to emphasize that the Checklist presented in Table 2 is not designed to be a mandate for reporting. It is designed to highlight key issues that should be addressed in an appropriate place and in a reasonable level of detail for a particular manuscript, mindful of word limits for manuscripts. Finally, inclusion of this information in a particular study should not be used as an indicator of quality, but rather as key information that outlines the rationale for use of a particular monitor, the initial study plans, and the ability of the researchers to achieve their initial monitoring goals.
Table 2.
Checklist for reporting use of physical activity monitors in population-based studies
|
Figure 2.
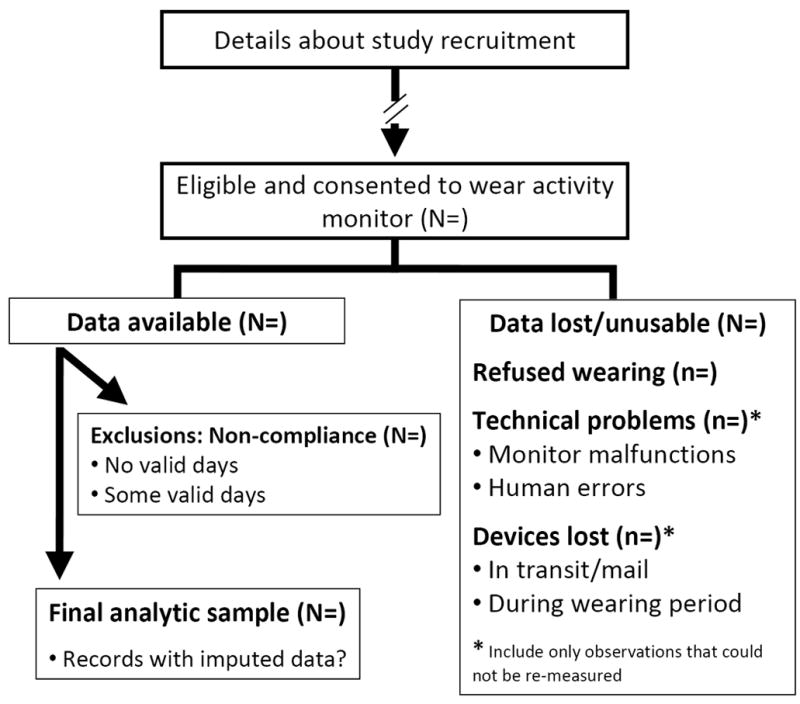
Flow Chart for reporting physical activity monitoring results
The Flow Chart that may be used when results of physical activity monitoring operations for a particular study are reported. We recommend that authors provide an overview of their overall physical activity monitor use, starting from the time informed consent for participation is obtained from the initial sample and ending with the number of individuals in the final analytic sample. Investigators are encouraged to report the number of individuals who were eligible for the study and signed informed consent. Among these participants, information about the number of data files that were not obtained from participants (refusals), or that were unusable due to technical problems should be reported. These technical problems may be due to monitor malfunctions or human errors. An indication of the number of lost devices that occur in transit to and from participants, or that were lost during the wearing period by participants also is valuable. For the apparently usable data files from participants, the number of files excluded from analysis due to non-compliance should be reported, and it also may be useful to indicate the number of files where there was no compliance (< 1 day of obvious wearing) and the number of records with some compliance (> 1 day), but that did not meet the study goal. If imputation is used, information about the number of files and/or number of days of observation affected should be reported.
FUTURE DIRECTIONS FOR RESEARCH WITH PHYSICAL ACTIVITY MONITORS
In this final section, we briefly review some prominent gaps in our current understanding related to use of physical activity monitors in population-based studies, and the associated needs for future research. The needs are presented for physical activity monitor engineers and manufacturers, measurement scientists, and end users.
Physical Activity Monitors Engineers and Manufacturers
Physical activity monitor malfunctioning and human error during data collection contributes to loss of data and cost of administering the devices in large population-based studies. Further refinement of systems to minimize malfunctioning and the potential for human error are needed.
Making a determination whether a monitor is likely to have been worn by a participant, or when a device may have experienced a malfunction requires a moderate to high level of technical expertise for many end users. Physical activity monitors have unique data “signatures” that are associated with wearing the device or with monitor malfunctions. Integrating automated estimates of wearing time and quality control checks that flag malfunctions into the data download and summary output provided by the manufacturers would reduce the technical demands for many end users. It also would serve to standardize data summaries across studies.
Historically, physical activity monitor systems have varied in the level of detail provided to users with respect to data acquisition processes, access to the raw data collected by a given instrument, and the specifics of the calibration studies used to translate acceleration signals to relevant behavioral outcomes. Providing access to the raw acceleration signals and more transparency to the calibration methods for estimates derived from proprietary models is needed and would serve to enhance comparability across studies.
As noted above, lack of compliance is another source of lost data and increased cost of administration in large studies. New technologies offer the potential to deliver wearing instructions, cues to put on the instruments, and troubleshoot problems that may be reported or detected during the wearing period. Engineering solutions to these problems could enhance compliance, reduce data losses, and possibly financial costs associated with data collection.
Measurement Scientists
Recent research has questioned the validity of initial estimates of the number of days of observation required to achieve a sufficiently high level of inter-individual variation in the behavior studied in the population. More definitive work to estimate the optimal measurement schedules, in terms of the number of days and/or measurement periods for population-based studies is needed. Determination of the optimal (for precision) and most cost effective measurement schedules for surveillance, intervention, and association studies are needed.
A substantial challenge for administering physical activity monitors in large-scale studies resides in the processing of a large number of increasingly complex and bulky data files. Currently, the infrastructure to implement automated quality control checking and data summary methods in a “high throughput” fashion is limited. Development of such an infrastructure that could be shared by many users may advance use of monitors in large-scale studies and enhance comparability between studies.
Historically, calibration studies used to develop algorithms that translate raw data to relevant indicators have been relatively small and focused on a narrow range of activities in selected populations. A repository of standardized and publicly available calibration data collected from more representative samples is needed to facilitate the development of algorithms that can be applied in population-based studies.
End Users
Participant refusals and device removals are a large source of data loss (1), and the cost implications are magnified for large-sample studies. Qualitative data about why participants choose not to wear an instrument, or to remove it prematurely, are needed. Factors associated with sensor size, placement site, sensor number, and methods of attachment should be investigated.
Acknowledgments
We are grateful to our colleagues for sharing accelerometry protocols from their research studies: Genevieve Healy, University of Queensland, Australia; Ulf Ekelund, MRC Epidemiology Unit, United Kingdom; Steven Hooker, University of South Carolina, USA; Kong Chen and Robert Brychta, National Institute of Diabetes and Digestive and Kidney Diseases, USA; Tamara Harris and Annemarie Koster, National Institute on Aging, USA; and Richard Troiano, National Cancer Institute, USA.
References
- 1.Algase DL, Beattie ERA, Leitsch SA, Beel-Bates CA. Biomechanical activity devices to index wandering behaviour in dementia. Am J Alzheimer’s Dis Other Demen. 2003;18(2):85–92. doi: 10.1177/153331750301800202. [DOI] [PMC free article] [PubMed] [Google Scholar]
- 2.Baranowski T, Mâsse LC, Ragan BWG. How many days was that? We’re still not sure, but we’re asking the question better! Med Sci Sports Exerc. 2008;40(7 Suppl):S544–S9. doi: 10.1249/MSS.0b013e31817c6651. [DOI] [PMC free article] [PubMed] [Google Scholar]
- 3.Beaton G. Approaches to analysis of dietary data: relationship between planned analyses and choices of methodology. Am J Clin Nutr. 1994;59(Suppl):S253–S61. doi: 10.1093/ajcn/59.1.253S. [DOI] [PubMed] [Google Scholar]
- 4.Beaton GH, Milner J, Corey P, McQuire V, Cousins M, Stewart E, et al. Sources of variance in 24-hour dietary recall data: implications for nutrition study design and interpretation. Am J Clin Nutr. 1979;32(12):2546–59. doi: 10.1093/ajcn/32.12.2546. [DOI] [PubMed] [Google Scholar]
- 5.Bergman RJ, Bassett DJ, Muthukrishnan S, Klein DA. Validity of 2 devices for measuring steps taken by older adults in assisted-living facilities. J Phys Act Health. 2008;5(Suppl 1):S166–S75. doi: 10.1123/jpah.5.s1.s166. [DOI] [PubMed] [Google Scholar]
- 6.Bonomi AG, Plasqui G, Goris AHC, Westerterp KR. Improving assessment of daily energy expenditure by identifying types of physical activity with a single accelerometer. J Appl Physiol. 2009;107(3):655–61. doi: 10.1152/japplphysiol.00150.2009. [DOI] [PubMed] [Google Scholar]
- 7.Brage S, Brage N, Franks PW, Ekelund U, Wong MY, Andersen LB, et al. Branched equation modeling of simultaneous accelerometry and heart rate monitoring improves estimate of directly measured physical activity energy expenditure. J Appl Physiol. 2004;96(1):343–51. doi: 10.1152/japplphysiol.00703.2003. [DOI] [PubMed] [Google Scholar]
- 8.Crouter SE, Clowers KG, Bassett DR., Jr A novel method for using accelerometer data to predict energy expenditure. J Appl Physiol. 2006;100(4):1324–31. doi: 10.1152/japplphysiol.00818.2005. [DOI] [PubMed] [Google Scholar]
- 9.Grant PM, Ryan CG, Tigbe WW, Granat MH. The validation of a novel activity monitor in the measurement of posture and motion during everyday activities. Br J Sports Med. 2006;40(12):992–7. doi: 10.1136/bjsm.2006.030262. [DOI] [PMC free article] [PubMed] [Google Scholar]
- 10.Hagströmer M, Oja P, Sjöström M. Physical activity and inactivity in an adult population assessed by accelerometry. Med Sci Sports Exerc. 2007;39(9):1502–8. doi: 10.1249/mss.0b013e3180a76de5. [DOI] [PubMed] [Google Scholar]
- 11.Harris AM, Lanningham-Foster LM, McCrady SK, Levine JA. Nonexercise movement in elderly compared with young people. Am J Physiol Endocrinol Metab. 2007;292(4):E1207–E1212. doi: 10.1152/ajpendo.00509.2006. [DOI] [PubMed] [Google Scholar]
- 12.Healy GN, Dunstan DW, Salmon J, Cerin E, Shaw JE, Zimmet PZ, et al. Breaks in sedentary time: beneficial associations with metabolic risk. Diabetes Care. 2008;(31):661–66. doi: 10.2337/dc07-2046. [DOI] [PubMed] [Google Scholar]
- 13.Healy GN, Dunstan DW, Salmon J, Cerin E, Shaw JE, Zimmet PZ, et al. Objectively measured light-intensity physical activity is independently associated with 2-h plasma glucose. Diabetes Care. 2007;30(6):1384–9. doi: 10.2337/dc07-0114. [DOI] [PubMed] [Google Scholar]
- 14.Kipnis V, Subar AF, Midthune D, Freedman LS, Ballard-Barbash R, Troiano RP, et al. Structure of dietary measurement error: results of the OPEN biomarker study. Am J Epidemiol. 2003;158(1):14–21. doi: 10.1093/aje/kwg091. [DOI] [PubMed] [Google Scholar]
- 15.Levine JA, McCrady SK, Lanningham-Foster L, Kane PH, Foster RC, Manohar CU. The role of free-living daily walking in human weight gain and obesity. Diabetes. 2008;57(3):548–54. doi: 10.2337/db07-0815. [DOI] [PubMed] [Google Scholar]
- 16.Levine JA, Eberhardt NL, Jensen MD. Role of nonexercise activity thermogenesis in resistance to fat gain in humans. Science. 1999;283(5399):212–4. doi: 10.1126/science.283.5399.212. [DOI] [PubMed] [Google Scholar]
- 17.Levine JA, Lanningham-Foster LM, McCrady SK, Krizan AC, Olson LR, Kane PH, et al. Interindividual variation in posture allocation: possible role in human obesity. Science. 2005;307(5709):584–6. doi: 10.1126/science.1106561. [DOI] [PubMed] [Google Scholar]
- 18.Mâsse LC, Fuemmeler BF, Anderson CB, Matthews CE, Trost SG, Catellier DJ, et al. Accelerometer data reduction: a comparison of four reduction algorithms on select outcome variables. Med Sci Sports Exerc. 2005;37(11 Suppl):S544–S54. doi: 10.1249/01.mss.0000185674.09066.8a. [DOI] [PubMed] [Google Scholar]
- 19.Matthews CE. Calibration of accelerometer output for adults. Med Sci Sports Exerc. 2005;37(11):S512–S22. doi: 10.1249/01.mss.0000185659.11982.3d. [DOI] [PubMed] [Google Scholar]
- 20.Matthews CE, Ainsworth BE, Hanby C, Pate RR, Addy C, Freedson PS, et al. Development and testing of a short physical activity recall questionnaire. Med Sci Sports Exerc. 2005;37(6):986–94. [PubMed] [Google Scholar]
- 21.Matthews CE, Chen KY, Freedson PS, Buchowski MS, Beech BM, Pate RR, et al. Amount of time spent in sedentary behaviors - United States 2003- 2004. Am J Epidemiol. 2008;167(7):875–81. doi: 10.1093/aje/kwm390. [DOI] [PMC free article] [PubMed] [Google Scholar]
- 22.Mattocks C, Ness A, Leary S, Tilling K, Blair SN, Shield J, et al. Use of accelerometers in a large field-based study of children: protocols, design issues, and effects on precision. J Phys Act Health. 2008;5(Suppl 1):S98–S111. doi: 10.1123/jpah.5.s1.s98. [DOI] [PubMed] [Google Scholar]
- 23.Pate RR, Stevens J, Pratt C, Sallis JF, Schmitz KH, Webber LS, et al. Objectively measured physical activity in sixth-grade girls. Arch Pediatric Adolesc Med. 2006;160(12):1262–8. doi: 10.1001/archpedi.160.12.1262. [DOI] [PMC free article] [PubMed] [Google Scholar]
- 24.Pati AK, Parganiha A, Kar A, Soni R, Roy S, Choudhary V. Alterations of the characteristics of the circadian rest-activity rhythm of cancer in-patients. Chronobiology International: The Journal of Biological and Medical Rhythm Research. 2007;24(6):1179–97. doi: 10.1080/07420520701800868. [DOI] [PubMed] [Google Scholar]
- 25.Pober DM, Staudenmayer J, Raphael C, Freedson PS. Development of novel techniques to classify physical activity mode using accelerometers. Med Sci Sports Exerc. 2006;38(9):1626–34. doi: 10.1249/01.mss.0000227542.43669.45. [DOI] [PubMed] [Google Scholar]
- 26.Rothney MP, Neumann M, Beziat A, Chen KY, Rothney MP, Neumann M, et al. An artificial neural network model of energy expenditure using nonintegrated acceleration signals. J Appl Physiol. 2007;103(4):1419–27. doi: 10.1152/japplphysiol.00429.2007. [DOI] [PubMed] [Google Scholar]
- 27.Sirard JR, Slater M. Compliance with wearing physical activity accelerometers in high school students. J Phys Act Health. 2009;6(Suppl 1):S148–S155. doi: 10.1123/jpah.6.s1.s148. [DOI] [PMC free article] [PubMed] [Google Scholar]
- 28.Spiegelman D, Zhao B, Kim J, Spiegelman D, Zhao B, Kim J. Correlated errors in biased surrogates: study designs and methods for measurement error correction. Stat Med. 2005;24(11):57–1682. doi: 10.1002/sim.2055. [DOI] [PubMed] [Google Scholar]
- 29.Staudenmayer J, Pober D, Crouter SE, Bassett DR, Freedson P. An artificial neural network to estimate physical activity energy expenditure and identify physical activity type from an accelerometer. J Appl Physiol. 2009;107(4):1300–7. doi: 10.1152/japplphysiol.00465.2009. [DOI] [PMC free article] [PubMed] [Google Scholar]
- 30.Tapia EM, Intille SS, Haskell W, Larson K, Wright J, King A, et al. Real-time recognition of physical activities and their intensities using wireless accelerometers and a heart rate monitor. 11th IEEE International Symposium on Wearable Computers; 2007. pp. 1–4. [Google Scholar]
- 31.Teutsch SM. Considerations in Planning a Surveillance System. In: Teutsch SM, Churchill RE, editors. Principles and Practice of Public Health Surveillance. New York: Oxford; 2000. pp. 17–29. [Google Scholar]
- 32.Troiano RP, Berrigan D, Dodd KW, Masse LC, Tilert T, McDowell M. Physical activity in the United States measured by accelerometer. Med Sci Sports Exerc. 2008;40(1):181–8. doi: 10.1249/mss.0b013e31815a51b3. [DOI] [PubMed] [Google Scholar]
- 33.Trost SG, McIver KL, Pate RR. Conducting accelerometer-based activity assessments in field-based research. Med Sci Sports Exerc. 2005;7(11 Suppl):S531–S43. doi: 10.1249/01.mss.0000185657.86065.98. [DOI] [PubMed] [Google Scholar]
- 34.Wareham NJ, Wong MY, Hennings S, Mitchell J, Rennie K, Cruickshank K, et al. Quantifying the association between habitual energy expenditure and blood pressure. Int J Epidemiol. 2000;29(4):655–60. doi: 10.1093/ije/29.4.655. [DOI] [PubMed] [Google Scholar]
- 35.Welk GJ, McClain JJ, Eisenmann JC, Wickel EE. Field validation of the MTI Actigraph and BodyMedia Armband monitor using the IDEEA monitor. Obesity (Silver Spring) 2007;15(4):918–28. doi: 10.1038/oby.2007.624. [DOI] [PubMed] [Google Scholar]
- 36.Westerterp KR. Pattern and intensity of physical activity. Nature. 2001;410(6828):539. doi: 10.1038/35069142. [DOI] [PubMed] [Google Scholar]
- 37.White E, Armstrong BK, Saracci R. Principles of Exposure Measurement in Epidemiology: Collecting, Evaluating, and Improving Measures of Disease Risk Factors. 2. Oxford: Oxford University Press; 2008. [Google Scholar]
- 38.White HK, McConnell ES, Bales CW, Kuchibhatla M. A 6-month observational study of the relationship between weight loss and behavioral symptoms in institutionalized Alzheimer’s disease subjects. J Am Med Dir Assoc. 2003;5(2):89–97. doi: 10.1097/01.JAM.0000110646.48753.EF. [DOI] [PubMed] [Google Scholar]
- 39.Zhang K, Pi-Sunyer FX, Boozer CN. Improving energy expenditure estimation for physical activity. Med Sci Sports Exerc. 2004;36(5):883–9. doi: 10.1249/01.mss.0000126585.40962.22. [DOI] [PubMed] [Google Scholar]
- 40.Zhang K, Werner P, Sun M, Pi-Sunyer FX, Boozer CN. Measurement of human daily physical activity. Obes Res. 2003;11(1):33–40. doi: 10.1038/oby.2003.7. [DOI] [PubMed] [Google Scholar]