

Abstract
AIM: To identify genes potentially involved in Helicobacter pylori (H. pylori)-induced gastric carcinogenesis.
METHODS: GES-1 cells were co-cultured with H. pylori strains isolated from patients with gastric carcinoma (GC, n = 10) or chronic gastritis (CG, n = 10) for in vitro proliferation and apoptosis assays to identify the most and least virulent strains. These two strains were cagA-genotyped and used for further in vivo carcinogenic virulence assays by infecting Mongolian gerbils for 52 wk, respectively; a broth free of H. pylori was lavaged as control. Genomic profiles of GES-1 cells co-cultured with the most and least virulent strains were determined by microarray analysis. The most differentially expressed genes were further verified using quantitative real-time polymerase chain reaction in GES-1 cells infected with the most and least virulent strains, and by immunohistochemistry in H. pylori positive CG, precancerous diseases, and GC biopsy specimens in an independent experiment.
RESULTS: GC-derived H. pylori strains induced a potent proliferative effect in GES-1 cells in co-culture, whereas CG-derived strains did not. The most (from a GC patient) and least (from a CG patient) virulent strains were cagA-positive and negative, respectively. At week 52, CG, atrophy, metaplasia, dysplasia, and GC were observed in 90.0%, 80.0%, 80.0%, 90%, and 60.0%, respectively, of the animals lavaged with the most virulent strain. However, only mild CG was observed in 90% of the animals lavaged with the least virulent strain. On microarray analysis, 800 differentially expressed genes (49 up- and 751 down-regulated), involving those associated with cell cycle regulation, cell apoptosis, cytoskeleton, immune response, and substance and energy metabolisms, were identified in cells co-cultured with the most virulent strain as compared with those co-cultured with the least virulent strain. The six most differentially expressed genes (with a betweenness centrality of 0.1-0.2) were identified among the significant differential gene profile network, including JUN, KRAS, BRCA1, SMAD2, TRAF1, and HDAC6. Quantitative real-time polymerase chain reaction analyses verified that HDAC6 and TRFA1 mRNA expressions were significantly more up-regulated in GES-1 cells co-cultured with the most virulent strain than in those co-cultured with the least virulent strain. Immunohistochemistry of gastric mucosal specimens from H. pylori-positive patients with CG, intestinal metaplasia (IM), dysplasia, and GC showed that moderately positive and strongly positive HDAC6 expression was detected in 21.7% of CG patients, 30.0% of IM patients, 54.5% of dysplasia patients, and 77.8% of GC patients (P < 0.001). The up-regulation of TRAF1 expressions was detected in 34.8%, 53.3%, 72.7%, and 88.9% specimens of CG, IM, dysplasia, and GC, respectively (P < 0.001).
CONCLUSION: The overexpression of HDAC6 and TRAF1 in GES-1 cells co-cultured with the GC-derived strain and in H. pylori-positive dysplasia and GC suggests that HDAC6 and TRAF1 may be involved in H. pylori-induced gastric carcinogenesis.
Keywords: Helicobacter pylori, Gastric carcinoma, Proliferation, Genomic profiles
INTRODUCTION
Helicobacter pylori (H. pylori) is a pathogenic bacterium colonizing gastric mucosae, especially in the antrum. It has been accepted to be the primary cause of upper gastrointestinal disorders, such as acute and chronic gastritis, peptic ulcer disease, and gastric cancer[1]. H. pylori infection is common worldwide with a prevalence of approximately 50%, especially in Eastern Asian populations, and the infection is usually a life-long event[2]. However, over 80% of H. pylori-infected individuals remain asymptomatic for their whole lifetime despite the presence of chronic gastric inflammation or chronic gastritis (CG), caused by H. pylori infection[3]. The subsequent outcomes of persistent H. pylori infection are highly variable. Approximately, 10%-20% of H. pylori-infected individuals are subject to peptic ulcer disease, including gastric and duodenal ulcers[4]. Of note, individuals infected by H. pylori are at a higher risk of gastric carcinoma (GC) (1%-2%) and mucosa-associated lymphoid tissue (MALT) lymphoma (< 1%)[5]. Therefore, gastric cancer may well be an infectious disease[6]. Additionally, it has been reported that H. pylori infection is associated with esophageal diseases, such as gastroesophageal reflux disease, Barrett’s esophagus, and esophageal carcinoma, as well as extra-gastrointestinal diseases, such as cardiovascular diseases, although controversies exist[7,8]. Such variation in clinicopathological outcomes of H. pylori infection is believed to result from the variations in the virulence of different strains, genetic background of the host, and more importantly, the host-to-pathogen interactions.
It has been widely accepted that H. pylori is the major cause of GC in most (65%-80%) patients[9]. Dietary risks, such as nitrate- and nitrite-enriched smoked or salted foods, are attributed to the in vivo biochemical activities of H. pylori[10]. Genetic susceptibility has also been identified in 10% of GC patients[11]. The canonical paradigm of gastric carcinogenesis has been established for more than two decades as a consecutive but dynamic progression of H. pylori infection, namely, CG, gastric atrophy (GA), intestinal metaplasia (IM), dysplasia, and finally GC[12]. Thus, H. pylori infection plays a leading role in the pathogenesis of GC[13].
It is likely that H. pylori strains themselves are highly variable in virulence to gastric mucosal epithelia, especially in terms of the carcinogenic effect. Genomic profiling analyses have identified a wide range of genetic variations among H. pylori strains isolated from patients with different gastric pathologies. Global gene expression profiles also vary greatly in human gastric epithelial immortalized cells infected with spiral vs coccoid H. pylori[14]. These findings suggest that gastric epithelial cells tune in the expression of their genes, especially those associated with tumorigenesis, in response to specific H. pylori strains or a specific virulent factor of the strain. In addition to the core genes, strain-specific genes are thought to play an essential role in H. pylori propagation and pathogenesis.
How gastric epithelial cells respond to H. pylori clinical isolates derived from patients with different pathologies, such as GC and CG specimens, at the genome-wide level remains unknown. Therefore, this study was carried out to identify genes potentially involved in H. pylori-induced gastric carcinogenesis, by comparing the genomic profiles between gastric epithelial cells co-cultured with H. pylori strains isolated from patients with GC and those co-cultured with strains from patients with CG.
MATERIALS AND METHODS
Patients and specimens
The study protocol was approved by the Institutional Review Boards at the Third Xiangya Hospital of Central South University and Hunan Provincial Hospital, respectively. All patients gave written informed consent prior to the enrollment. A total of 350 outpatients who underwent upper gastrointestinal endoscopy at the Department of Gastroenterology, the Third Xiangya Hospital of Central South University, and the Department of Gastroenterology of Hunan Provincial Hospital were consecutively enrolled. Gastric mucosal biopsy specimens were obtained from 182 patients. Three gastric biopsy specimens, 3-5 cm to the pylorus, were collected for the rapid urease test and the histological examination. The rapid urease test was performed using a rapid urease test kit (Sanqiang Biotechnology, Sanming, China). Of the 182 patients, 113 patients were found positive for H. pylori infection as detected by the rapid urease test. The histological classification followed the updated Sydney system[15]; the most serious pathology was documented as the histological diagnosis of each patient with concomitant mucosal pathologies. Thus, 23 patients were histologically diagnosed with CG, 30 with intestinal metaplasia (IM), 33 with dysplasia, and 27 with GC. In the present study, gastric specimens from CG and GC patients were used for H. pylori isolation and subculture.
H. pylori isolation and subculture
Gastric mucosal specimens from patients with CG and GC were ground into homogenates and inoculated onto a Columbia agar plate (Sangong Biotech, Shanghai, China) supplemented with 6% sheep blood. Plates were incubated at a mixed atmosphere of 10% CO2, 5% O2, and 85% N2, at 37 °C for 72 h. H. pylori colonies were validated by using colony identification, Gram staining, light microscopy, and urease test (Fujian Sanqiang Biochemical Co. Ltd., Sanming, China) prior to further use. Subculture of H. pylori was performed as described above. Twenty H. pylori strains were isolated from 10 CG and 10 GC patients, and used for further experiments.
Identification of the most and least virulent strains isolated from CG and GC specimens
GES-1 cell culture and co-culture with H. pylori: GES-1 cell line, a human gastric epithelium immortalized cell line, was purchased from Ai-yan Biotechnology Co., Ltd., Shanghai, China. GES-1 cells were cultured in high-glucose Dulbecco’s modified Eagle’s medium (Invitrogen, Carlsbad, CA) containing 10% fetal bovine serum (Invitrogen, Carlsbad, CA), at 37 °C and in a humidified atmosphere of 5% CO2. GES-1 cells at the exponential growth phase were harvested and seeded onto 96-well plates, at a density of 5 × 10³ cells per well. H. pylori strains were resuspended in phosphate buffer solution (PBS) at a density of 3.0 × 10⁸ cfu/mL using a spectrophotometer (Eppendorf, Hamburg, Germany). Following the cell cycle synchronization with 2% serum starvation, GES-1 cells were co-cultured with H. pylori strains in GES-1 cell culture media at a cell/bacterium ratio of 5:1, 1:1, 1:50, and 1:200, respectively. The number of bacteria was examined using a spectrometer, whilst that of cells was determined using TC10 automated cell counter (Bio-Rad Laboratories, Philadelphia, PA). A mono-culture of GES-1 cells in the absence of H. pylori was used as a control. The number of GES-1 cells was fixed among co-cultures as well as mono-culture. The experiments were performed in duplicate and repeated in triplicate independently.
3-(4,5-dimethylthiazol-2)-2,5-diphenyltetrazolium bromide cell proliferation assay: Following 12 h, 24 h, and 48 h of co-culture, 20 μL 3-(4,5-dimethylthiazol-2)-2,5-diphenyltetrazolium bromide (MTT) solution (Sangong Biotech, Shanghai, China) was added into the culture medium for a further 4-h incubation at 37 °C prior to the supplementation of 150 μL dimethyl sulfoxide (Invitrogen, Carlsbad, CA). The optical density at the wavelength of 490 nm (A490 nm) was determined using an ELISA microplate reader (Bio-Tek, Winooski, VT). The experiments were performed in duplicate and repeated in triplicate independently.
Identification of cagA gene in H. pylori strains with real-time polymerase chain reaction: The DNA samples were isolated using a bacterial DNA extraction kit (Boehringer Ingelheim GmbH, Ingelheim, Germany). Briefly, the most and least virulent H. pylori strains were resuspended in GTEL buffer and pre-incubated in TESK buffer at 55 °C for 2 h. The RNA contained in the H. pylori strains was eliminated using 20-μg/mL RNase at 55 °C for 10 min. The DNA samples were isolated using the phenol-chloroform-isopentanol (25:24:1) extraction technique. Genotyping for cagA was performed using the primers of the following sequences (Sangon Biotech Co., Ltd., Shanghai, China): sense, 5’-ATGGAAAATATCATACAACCCC-3’, and antisense, 5’-CATCTTCTAAATGGGAAACGCC-3’; length, 268 bp. The thermal cycling condition was as follows: pre-denatured at 96 °C for 1 min; denatured at 94 °C for 1 min and annealed at 60 °C for 1 min, 35 cycles; and extended at 94 °C for 1 min. Polymerase chain reaction (PCR) products were separated on 1% agarose gels containing 0.5 g/mL ethidium bromide and visualized by ultraviolet transillumination. H. pylori strain NCTC 11639 (Institute of Digestive Disease, Shanghai, China) was used as a positive control and H. pylori strain NCTC 12908 (Institute of Digestive Disease, Shanghai, China) as a negative control.
Cell apoptosis analysis with flow cytometry: Following 12, 24, and 48 h of co-culture, GES-1 cells were collected, washed in chilled PBS, and fixed in 70% pre-chilled (-20 °C) ethanol at 4 °C for 18 h, and resuspended at a density of 1 × 10⁶/mL. Fixed GES-1 cells were washed in PBS three times and stained with propidium iodide (Sigma, St Louis, MO) for 30 min prior to the analysis using an EPICS® ALTRA™ flow cytometer (Beckman Coulter, Inc., Brea, CA). The experiments were performed in duplicate and repeated in triplicate independently.
The H. pylori strain that exhibited the most significant cell proliferative effect on MTT assay over 24 h of co-culture (36.8% increase) was harvested from a GC specimen and deemed as the most virulent strain, while a strain from a CG specimen that exhibited the least significant cell proliferative effect on MTT assay over 24 h of co-culture (15.0% increase) was deemed the least virulent.
In vivo carcinogenicity assay in Mongolian gerbils
The two representative strains, the most and the least virulent, were subsequently used to establish a H. pylori infection animal model[16]. The animal care and use complied with the regulations established and approved by the Animal Research Committee at Central South University. Seven-week-old specific-pathogen-free male Mongolian gerbils (n = 30) were purchased from the Laboratory Animal Center, Zhejiang Provincial Institute of Medical Sciences, Hangzhou, China. Gerbils were housed in an environment constantly maintained at a temperature of 25 °C, a relative humidity of 55%, and a 12 h/12 h light/dark cycle. Animals had no access to rodent chow for 12 h and drinking water for 4 h prior to the pretreatment with 0.3 mL 50% ethanol lavage per animal. H. pylori strains were cultured for three days using the aforementioned protocol, and resuspended in 7.5% (w/v) heat-inactivated brain heart infusion broth (Sangong Biotech, Shanghai, China) at a density of 1.0 × 10⁹ cfu/mL using a spectrophotometer (Eppendorf). Fasted animals were lavaged with 0.5-mL suspension of the most or least virulent H. pylori strain (n = 10 for each strain) per animal three times, at a 12 h interval. Ten animals that were lavaged with the broth alone using the same protocol served as the control. Animals were allowed to resume oral intake two hours following the last lavage. Animals were sacrificed by cervical dislocation 4, 16, 28, 40 and 52 wk (n = 2 at each time point) following the lavage with H. pylori suspensions or broth. Fresh gastric mucosal specimens were collected from the gastric antrum and body for the rapid urease test, and the duplicate specimens were fixed in 4% paraformaldehyde for histological examination using hematoxylin and eosin staining.
Determination of the differentially expressed genes between GES-1 cells co-cultured with the most and least virulent strains
Total RNA extraction: The two representative H. pylori strains were co-cultured with GES-1 cells for 24 h, respectively, at a cell/bacterium ratio of 1:50, the optimal ratio for H. pylori-induced cell proliferation as determined in MTT assay. Mono-cultured GES-1 cells were used as a control. Total cellular RNA was extracted from infected and non-infected cells using Qiagen RNeasy Mini kit (Invitrogen, Carlsbard, CA) for further microarray analysis and quantitative real-time (qRT)-PCR verification. RNA concentration and purity were determined using an ultraviolet spectrometer (Eppendorf). Denaturing agarose gel electrophoresis was performed to validate the integrity of RNA samples. The experiments were performed in duplicate and repeated in triplicate independently.
Oligonucleotide microarray: The GeneChip Human Genome U133 Plus 2.0 Array (Affymetrix, Santa Clara, CA, United States), containing 48 000 transcript probes, was used to assess the global gene expression of GES cells in response to H. pylori infection. Microarray analysis was performed as instructed by the manufacturer. Chip scanning and data analysis were processed using Affymetrix Microarray Suit Software 5.0 to identify significant differential gene expression profiles. A gene with a signal ratio of more than 2.0 (up-regulated) or less than 0.5 (down-regulated) was defined to be a differentially expressed gene when co-cultured GES-1 cells were compared with control cells, or when cells co-cultured with the most virulent strain were compared with those co-cultured with the least virulent strain.
Validation of potential carcinogenesis-associated genes among the most differentially expressed genes
Quantitative real-time polymerase chain reaction in GES cells: Two carcinogenesis-associated genes that encode histone deacetylase 6 (HDAC6) and tumor necrosis factor receptor-associated factor 1 (TRAF1)[17,18] were among the most differentially expressed genes. Due to their unknown roles in the pathogenesis of GC, the transcriptions of HDAC6 and TRAF1 were evaluated using quantitative real-time polymerase chain reaction (qRT-PCR). Primer pairs for qRT-PCR were listed in Table 1. GAPDH, as an internal control, was co-amplified with the specific genes. Briefly, total cellular RNA was extracted from GES cells infected with the most and least virulent strains as well as uninfected GES cells, and reversely transcribed into cDNA by M-MLV reverse transcriptase and random hexamer primer (Invitrogen, Carlsbard, CA). The cDNAs were amplified by 30 PCR cycles of denaturation at 94 °C for 30 s, annealing at 53 °C for 45 s, and extension at 72 °C for 30 s. As a final step, the extension was at 72 °C for 1 min. PCR products were separated on 1% agarose gels containing 0.5 g/mL ethidium bromide and visualized by ultraviolet transillumination. SYBR qPCR Mix (Invitrogen, Carlsbard, CA) was used to monitor DNA synthesis. The experiments were performed in duplicate and repeated in triplicate independently.
Table 1.
Primer pairs for quantitative real-time polymerase chain reaction
| Gene | Primer Sequence (5’ to 3’) | Size of PCR product (bp) | |
| Sense | Anti-sense | ||
| HDAC6 | ACCGCTACGAGCAGGGTA | CGAGACGTGCAGGAAAGC | 155 |
| TARF1 | TCCCGTAACACCTGATTAA | ACAACTCCCAAACCATACAC | 146 |
| GAPDH | AACGGATTTGGTCGTATTGGG | TCGCTCCTGGAAGATGGTGAT | 216 |
PCR: Polymerase chain reaction.
Immunohistochemistry in gastric biopsy specimens: In an independent experiment, H. pylori-positive gastric mucosal specimens from the 113 patients were used for immunohistochemistry (IHC) to verify the expression of HDAC6 and TRAF1 in different gastric pathologies. Briefly, goat-anti-HDAC6 (1:100; Santa Cruz Biotechnology, Inc., Heidelberg, Germany) and rabbit-anti-TRAF1 (1:100; BIOSS, Beijing, China) were used as primary antibodies. Conjugated biotin was identified by using horseradish peroxide-labeled streptavidin (1:200; Santa Cruz Biotechnology, Inc.) and visualized by using 3,3’-diaminobenzidine (1:200; Santa Cruz Biotechnology, Inc.). Overall, at least 200 cells in ten randomly selected fields were counted, and the percentages of positive cells against the total counted cells were calculated for each specimen. The IHC staining intensity was semiquantitatively determined as negative (positive cells < 10%), moderately positive (10%-50%), and strongly positive (> 50%). The experiments were performed in duplicate and repeated in triplicate independently.
Statistical analysis
SPSS ver. 13.0 (SPSS Inc., Chicago, IL) was used for the statistical analysis. All numerical data were expressed as mean ± SD, and compared by using the Student’s t-test or analysis of variance, when appropriate. All categorical data were expressed as percentage and compared by using the χ2-test or Fisher’s exact probability test, when appropriate. A P value of less than 0.05 was considered statistically significant.
RESULTS
GC-derived H. pylori strains induced potent proliferation in GES-1 cells
As shown in Figure 1A, GES-1 cells exhibited an overall cell proliferative response over time to the co-culture with H. pylori isolated from GC. A low-concentration (5:1) GC-derived H. pylori infection in vitro had minimal effect on GES-1 cell proliferation. At a cell/H. pylori ratio of 1:1 or 1:50, GES-1 cells co-cultured with GC-derived H. pylori strains had a significantly higher proliferation rate relative to those with CG-derived H. pylori strains and control cells. In contrast, CG-derived H. pylori co-culture at a ratio of 5:1, 1:1, and 1:50 had no significant impact on cell proliferation over time. Of note, the co-culture at a higher concentration (1:200) H. pylori isolated from either GC or CG compromised the proliferation capability of GES-1 cells.
Figure 1.
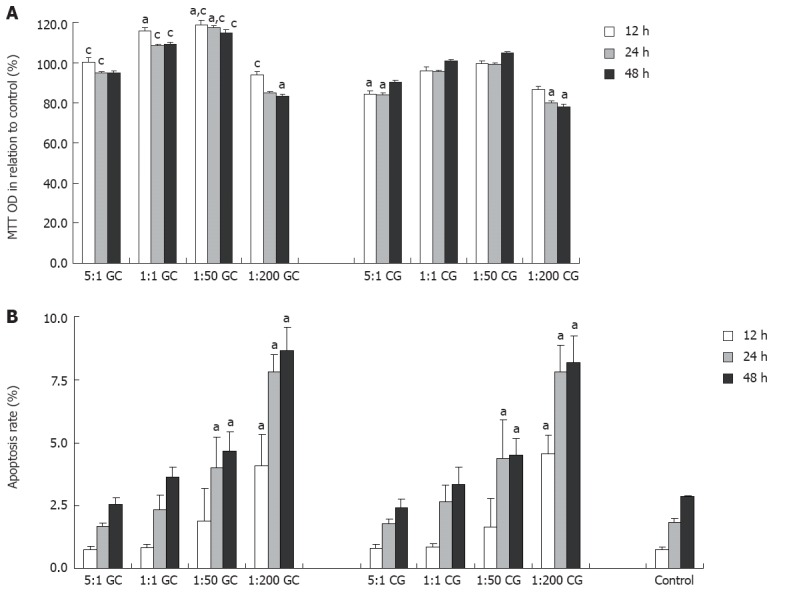
GES-1 cell proliferation as determined by 3-(4,5-dimethylthiazol-2)-2,5-diphenyltetrazolium bromide assay (A) and cell apoptosis as determined by flow cytometry (B) after co-culture with helicobacter pylori isolated from patients with gastric carcinoma (GC, n = 10) or chronic gastritis (CG, n = 10) for 48 h in relation to control cells. The ratio denotes the ratio of GES-1 cells vs Helicobacter pylori cells. aP < 0.05 vs control group; cP < 0.05 vs CG group. OD: Optical density.
GC- and CG-derived H. pylori strains induced comparable apoptosis in GES-1 cells
Flow cytometry analysis showed that the apoptosis rate increased over time in cells co-cultured with H. pylori and non-infected cells (Figure 1B). In comparison with the control cells, GES-1 cells co-cultured with GC- or CG-derived H. pylori strains had a significantly increased apoptotic rate at 24 and 48 h at the ratios of 1:50, and at all time points at the ratio of 1:200. However, there was no significant difference in the increase of apoptotic rate between GES-1 cells co-cultured with GC-derived H. pylori strains and those co-cultured with CG-derived H. pylori strains.
The most virulent GC-derived H. pylori strain induced gastric mucosal carcinogenesis in the animal model
The most virulent strain, which was derived from a GC patient, and the least virulent strain, which was derived from a CG patient, were genotyped to be cagA positive and cagA negative, respectively (Figure 2). H. pylori rapid urease testing was found positive in 60.0% (6/10), 70.0% (7/10), and 0.0% (0/10) of the animals lavaged with the most virulent strain, least virulent strain, and control lixivium, respectively. No animals, except one in the group infected with most virulent strain that died at week 3, accidentally died during the experiment. H. pylori infection was present in all animals lavaged with H. pylori, but in none of the control animals, as shown by histological examination. The animals lavaged with the most virulent strain were more prone to precancerous diseases and gastric carcinoma than those lavaged with the least virulent strain and control lixivium. At week 52, CG, atrophy, metaplasia, dysplasia, and GC were observed in 90.0% (9/10), 80.0% (8/10), 80.0% (8/10), 90% (9/10), and 60.0% (6/10), respectively, of the animals lavaged with the most virulent strain (Table 2). Precancerous lesions including gastric atrophy, intestinal metaplasia, and dysplasia were observed from the 4th week, and gastric cancer occurred as early as at week 28 (Figure 3A, Table 2). However, only mild CG was observed in 90% (9/10) of the animals lavaged with the least virulent strain (Figure 3B, Table 2). In addition, gastric ulceration was observed in 50.0% (5/10) and 40.0% (4/10), respectively, in the two groups. The gastric mucosa was within normal limits in all control animals at any time points (Figure 3C, Table 2).
Figure 2.
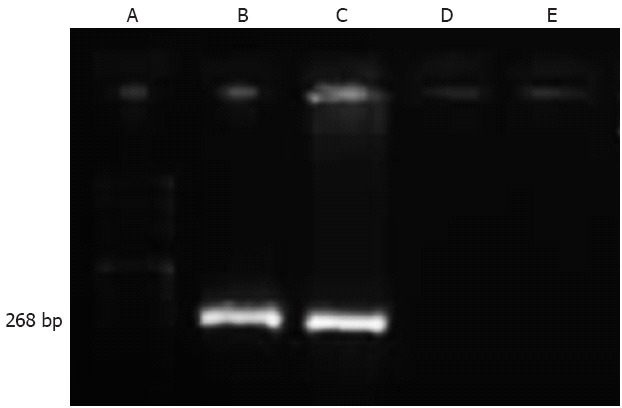
Identification of status of cagA gene in Helicobacter pylori strains using real-time polymerase chain reaction. A: DNA ladder; B: Helicobacter pylori (H. pylori) stain NCTC 11639 (positive control); C: The most virulent gastric carcinoma-derived strain; D: The least virulent chronic gastritis-derived strain; E: H. pylori stain NCTC 12908 (negative control).
Table 2.
Pathological outcomes of gastric mucosae from Mongolian gerbils lavaged with the most virulent gastric carcinoma-derived strain, the least virulent chronic gastritis-derived strain, and the control broth over 52 wk
| Pathological outcomes | |||||
| Chronic gastritis | Gastric atrophy | Intestinal metaplasia | Gastric dysplasia | Gastric carcinoma | |
| GC (n = 10) | 9 (90.0%)b | 8 (80.0%)bd | 8 (80.0%)bd | 9 (90.0%)bd | 6 (60.0%)bd |
| CG (n = 10) | 9 (90.0%)b | 0 (0.0%) | 0 (0.0%) | 0 (0.0%) | 0 (0.0%) |
| Control (n = 10) | 0 (0.0%) | 0 (0.0%) | 0 (0.0%) | 0 (0.0%) | 0 (0.0%) |
P < 0.01 vs control group;
P < 0.01 vs CG group. GC: Gastric carcinoma; CG: Chronic gastritis.
Figure 3.

Representative histological microphotographs (hematoxylin and eosin staining, 200 ×, scale bar = 100 μm) of gastric mucosal specimens collected from Mongolian gerbils lavaged with the GC-derived Helicobacter pylori strain (A: gastric carcinoma), the CG-derived strain (B: chronic gastritis), and the control lixivium (C) at the 28th week.
Microarray analysis identified significant differential gene expression profiles in GES-1 cells co-cultured with the most versus least virulent H. pylori strains
Microarray analysis identified 2834 and 314 differentially expressed genes in GES-1 cells co-cultured with most or least virulent H. pylori strain, respectively, compared with non-infected cells (Figure 4). Furthermore, 800 differentially expressed genes (49 up- and 751 down-regulated), involving those associated with cell cycle regulation, cell apoptosis, cytoskeleton, immune response, and substance and energy metabolisms, were identified in cells co-cultured with the most virulent strain compared with those co-cultured with the least virulent strain (Table 3). Six most differentially expressed genes (with a betweenness centrality of 0.1-0.2) were identified among the significant differential gene profile network, including JUN, KRAS, BRCA1, SMAD2, TRAF1, and HDAC6 (Table 4).
Figure 4.

Cluster analysis of gene expression profiles in GES-1 cells in response to the most and least virulent Helicobacter pylori strains. The red, green, and black colors indicate up-regulated, down-regulated, and equivalent expression. 1-1: Uninfected GES-1 cells (control); 2-2: GES-1 cells co-cultured with the GC-derived strain; 3-2: GES-1 cells co-cultured with the CG-derived strain. GC: Gastric carcinoma; CG: Chronic gastritis.
Table 3.
Differentially expressed genes with a fold change of > 2.0 or < 0.5 in GES-1 cells co-cultured with the most virulent gastric carcinoma-derived strain vs the least virulent chronic gastritis-derived strain
| Gene name (n = 185) | Fold change GC/CG | Accession number |
| Cell cycle related genes | ||
| AMN1 | 4.748 | BG031897 |
| HDAC6 | 2.025 | NM_006044 |
| CCNE2 | 0.464 | AF112857 |
| KIF20B | 0.462 | NM_016195 |
| DOCK8 | 0.456 | AL161725 |
| ASPM | 0.452 | AK001380 |
| CENPF | 0.450 | U30872 |
| NIPBL | 0.432 | NM_015384 |
| SYCP2 | 0.424 | NM_014258 |
| ASPM | 0.414 | NM_018123 |
| SGOL2 | 0.401 | N31731 |
| CENPE | 0.398 | NM_001813 |
| CEP70 | 0.382 | NM_024491 |
| SGOL2 | 0.375 | AW965339 |
| DOCK11 | 0.363 | AI742838 |
| SERPINB3 | 0.290 | BC005224 |
| Apoptosis-related genes | ||
| TRAF1 | 2.254 | NM_005658 |
| TIA1 | 0.496 | AL567227 |
| OPA1 | 0.474 | AB011139 |
| PIK3CA | 0.450 | NM_006218 |
| NUDT12 | 0.408 | AL136592 |
| PEG10 | 0.367 | BE858180 |
| Cytoskeleton and sports | ||
| ADD3 | 0.450 | AI818488 |
| KIAA0774 | 0.429 | AI818409 |
| KIF14 | 0.379 | AW183154 |
| KIF14 | 0.370 | NM_014875 |
| ADD3 | 0.344 | BE545756 |
| ADD3 | 0.316 | NM_019903 |
| Intracellular transport | ||
| VPS13A | 0.435 | AW629014 |
| VPS13A | 0.438 | AW629014 |
| IFT74 | 0.431 | NM_025103 |
| GOLGA4 | 0.425 | NM_002078 |
| ANKRD10 | 0.419 | BE670056 |
| IFT80 | 0.414 | AB037795 |
| FAM8A1 | 0.412 | NM_016255 |
| SNX2 | 0.406 | NM_003100 |
| ANKRD32 | 0.355 | AL136560 |
| DNA synthesis, repair, recombination | ||
| RAD50 | 0.472 | NM_005732 |
| SFPQ | 0.457 | AV705803 |
| FAM8A1 | 0.412 | NM_016255 |
| LIN9 | 0.338 | BF697734 |
| DNA-binding ,transcription, transcription factor | ||
| ZNF253 | 5.254 | NM_021047 |
| KLF11 | 3.598 | AA149594 |
| SMARCA1 | 0.496 | NM_003069 |
| GOLGB1 | 0.492 | NM_004487 |
| KLF9 | 0.462 | NM_001206 |
| CHD1 | 0.459 | NM_001270 |
| PBX1 | 0.455 | AL049381 |
| TRIP11 | 0.434 | AF007217 |
| SMARCA1 | 0.433 | NM_003069 |
| C8orf83 | 0.433 | BE962119 |
| EPM2AIP1 | 0.430 | BF432224 |
| ELL2 | 0.420 | AI745624 |
| GLCCI1 | 0.400 | AA058770 |
| ARID5B | 0.395 | BG285011 |
| ZNF644 | 0.390 | NM_016620 |
| BAZ2B | 0.365 | NM_013450 |
| SAMD9 | 0.352 | AA741307 |
| SAMD9 | 0.345 | NM_017654 |
| TPR | 0.346 | BF110993 |
| TPR | 0.344 | AK023111 |
| LCORL | 0.339 | AI807408 |
| TPR | 0.300 | AW235355 |
| Cell signal and transduction | ||
| PRKCB | 0.498 | M13975 |
| DST | 0.493 | NM_001723 |
| FARP1 | 0.462 | BF725250 |
| GMFB | 0.461 | NM_004124 |
| PPM1A | 0.454 | AA886888 |
| IFT81 | 0.444 | NM_014055 |
| PDE10A | 0.442 | AI143879 |
| ICK | 0.428 | NM_014920 |
| ANKRD10 | 0.419 | BE670056 |
| IFT80 | 0.414 | AB037795 |
| SNX2 | 0.406 | NM_003100 |
| CNTLN | 0.386 | AA280904 |
| MAP2K6 | 0.384 | NM_002758 |
| ANKRD32 | 0.355 | AL136560 |
| ARHGAP18 | 0.307 | BE644830 |
| Protein translation, synthesis, decomposition | ||
| RHOBTB3 | 0.500 | NM_014899 |
| ST13 | 0.490 | U17714 |
| EEF2K | 0.488 | W68180 |
| TSHZ2 | 0.476 | AW953679 |
| TMF1 | 0.417 | AI767750 |
| HMMR | 0.410 | U29343 |
| CCDC88A | 0.387 | AB033038 |
| NSBP1 | 0.321 | BC005342 |
| Protein-coding gene | ||
| CXorf39 | 0.499 | AI590719 |
| LOC286052 | 0.478 | AA278233 |
| FLJ40113/LOC440295 | 0.411 | AI632181 |
| LOC100133781 | 0.374 | AA973100 |
| LOC100130360 | 0.346 | BG231554 |
| LOC643401 | 0.300 | BC039509 |
| Ion channel and transport | ||
| IFT74 | 0.496 | AI610355 |
| SLC5A3 | 0.493 | AK024896 |
| SLC2A13 | 0.489 | AL565362 |
| STEAP4 | 0.488 | NM_024636 |
| TMEM56 | 0.469 | AI004375 |
| EXOC5 | 0.466 | BF509391 |
| CACNB2 | 0.465 | AI040163 |
| SLC2A13 | 0.455 | NM_052885 |
| TMEM133 | 0.435 | AF247167 |
| DMXL2 | 0.405 | AB020663 |
| SNX13 | 0.401 | R75838 |
| SEC62 | 0.397 | NM_153039 |
| ATP11C | 0.382 | BF475862 |
| TMEM106B | 0.380 | BF513060 |
| PEG10 | 0.367 | BE858180 |
| SORBS2 | 0.222 | AI659533 |
| Cell proliferation, angiogenesis | ||
| ANGPTL4 | 2.460 | NM_016109 |
| TPR | 0.492 | NM_003292 |
| TPR | 0.492 | NM_003292 |
| PNN | 0.487 | U59479 |
| PNN | 0.428 | U59479 |
| ROCK2 | 0.404 | AL049383 |
| TTK | 0.347 | NM_003318 |
| Immune-related genes | ||
| CFI | 0.477 | NM_000204 |
| SERPINB4 | 0.431 | AB046400 |
| PIBF1 | 0.423 | NM_006346 |
| Metabolize-related genes | ||
| AK7 | 0.477 | NM_152327 |
| TTC3 | 0.471 | AI652848 |
| HS2ST1 | 0.438 | NM_012262 |
| MANEA | 0.427 | AI587307 |
| PLA2G12A | 0.416 | AV714268 |
| TTC3 | 0.413 | D83077 |
| PPP1CB | 0.407 | W67887 |
| NUDT12 | 0.408 | AL136592 |
| TTC3 | 0.403 | NM_003316 |
| TTC3 | 0.403 | AI885338 |
| RNF150 | 0.398 | AA722069 |
| SEPP1 | 0.396 | NM_005410 |
| CRYZ | 0.387 | NM_001889 |
| PDK4 | 0.374 | AV707102 |
| ABAT | 0.359 | AF237813 |
| PLA2G12A | 0.331 | AI767751 |
| AGXT2L1 | 0.326 | NM_031279 |
| CYP1B1t | 0.314 | NM_000104 |
| METTL7A | 0.274 | NM_014033 |
| Cell structure-related genes | ||
| ARMCX3 | 0.385 | AL121883 |
| ANK3 | 0.225 | NM_020987 |
| Cell Adhesion-related genes | ||
| KITLG | 0.447 | AI446414 |
| PIK3CA | 0.450 | NM_006218 |
| ANKRD10 | 0.419 | BE670056 |
| ANKRD32 | 0.355 | AL136560 |
| Stress-related genes | ||
| DNAJB4 | 0.400 | BG252490 |
| LXN | 0.294 | NM_020169 |
| DNAJB4 | 0.471 | NM_007034 |
| Protein regulation | ||
| LOC727770 | 0.426 | AI359676 |
| TBC1D8B | 0.368 | AW172431 |
| Cell differentiation | ||
| LIFR | 0.374 | AA701657 |
| RNA processing | ||
| SR140 | 0.413 | AU152088 |
| Protein receptor | ||
| LANCL1 | 0.412 | NM_006055 |
| Oxidation | ||
| DIO2 | 0.434 | AI038059 |
| Cell growth-related genes | ||
| ITCH | 0.441 | AA868238 |
| TGFBR3 | 0.450 | AW193698 |
| TGFBR3 | 0.422 | NM_003243 |
| Cytokine receptor | ||
| LTB | 2.001 | NM_002341 |
Table 4.
Most differentially expressed genes in GES-1 cells co-cultured with the most virulent gastric carcinoma-derived strain vs the least virulent chronic gastritis-derived strain
| Gene name | Betweenness centrality | Description | Identified or proposed function |
| JUN | 0.201780 | Jun oncogene | Cell growth and/or maintenance, signal transduction molecules, and transcription factors |
| KRAS | 0.185944 | v-Ki-ras2 Kirsten rat sarcoma viral oncogene homolog | Regulation of cell cycle, cell growth and/or maintenance |
| BRCA1 | 0.162070 | Breast cancer 1, early onset | DNA damage checkpoint; p53/ATM signaling, and induction of apoptosis |
| SMAD2 | 0.121460 | SMAD family member 2 | Transcription factors |
| TRAF1 | 0.092496 | Tumor necrosis factor receptor-associated factor 1 | DNA damage checkpoint, p53/NF-KB signaling, and cell cycle control |
| HDAC6 | 0.092239 | Histone deacetylase 6 | Cell proliferation and tumor angiogenesis |
Up-regulated expressions of HDAC6 and TRAF1 in GES-1 cells co-cultured with the most vs least virulent H. pylori strains
qRT-PCR analyses verified significant up-regulations of HDAC6 and TRFA1 mRNA expression in GES-1 cells co-cultured with the most virulent strain or least virulent H. pylori strain, compared with the control cells (Figure 5A). Furthermore, HDAC6 and TRFA1 mRNA expressions were more significantly up-regulated in GES-1 cells co-cultured with the most virulent strain than in those co-cultured with the least virulent strain (Figure 5B).
Figure 5.

Verification of HDAC6 and TRAF1 up-regulation in GES-1 cells in response to the most and least virulent Helicobacter pylori strains as determined by quantitative real-time polymerase chain reaction analysis. A: Representative quantitation of mRNA expression of GAPDH, HDAC6 and TRAF1 in GES-1 cells (a), GES-1 cells co-cultured with the CG-derived Helicobacter pylori (H. pylori) strain (b) and GES-1 cells co-cultured with the GC-derived H. pylori strain (c); B: Graphic analysis showing mRNA expression of HDAC6 and TRAF1 expressions in GES-1 cells in GES-1 cells, GES-1 cells co-cultured with the CG-derived H. pylori strain and GES-1 cells co-cultured with the GC-derived H. pylori strain. bP < 0.01 vs the control; dP < 0.01 vs cells co-cultured with the CG-derived H. pylori strain.
Progressive over-expression of HDAC6 and TRAF1 in CG, precancerous disease, and GC specimens on immunohistochemistry
The histology and immunohistochemistry of gastric mucosal specimens from H. pylori-positive patients with CG (Figure 6A, E and I), IM (Figure 6B, F and J), dysplasia (Figure 6C, G and K), and GC (Figure 6D, H and L) showed that moderately positive and strongly positive HDAC6 expression were detected in 5 (21.7%) of 23 CG patients, 10 (30.0%) of 33 IM patients, 18 (54.5%) of 33 dysplasia patients, and 21 (77.8%) of 27 GC patients (P < 0.001). Furthermore, the positive rate of HDAC6 expression was significantly higher in dysplasia and GC, compared to that in CG (P = 0.014; P < 0.001) and in IM (P = 0.049; P < 0.001). However, there was no difference in the positive rate between CG and IM, and between dysplasia and GC. Similarly, the up-regulation of TRAF1 expressions was detected in 8/23 (34.8%), 16/33 (53.3%), 24/33 (72.7%), and 24/27 (88.9%) specimens of CG, IM, dysplasia, and GC, respectively (P < 0.001). The positive rate of TRAF1 expression was significantly greater in dysplasia and GC vs CG (P = 0.005; P < 0.001) and in GC vs IM (P = 0.003), whereas there was no difference between CG and IM and between dysplasia and GC.
Figure 6.

Histology and immunohistochemistry (400 ×, scale bar = 50 μm) of HDAC6 and TRAF1 in gastric specimens of patients with chronic gastritis (CG, n = 23), intestinal metaplasia (IM, n = 30), dysplasia (n = 33), and gastric carcinoma (GC, n = 27).
DISCUSSION
Gastric carcinogenesis is a pathological process of cell cycle disorder and uncontrolled growth resulting from multiple aberrant gene alterations in response to extrinsic stimulus like H. pylori infection. The dysregulation of the balance between cell proliferation and apoptosis plays a pivotal role in this pathogenesis[19]. The proliferation rate of epithelial cells that are co-cultured with H. pylori isolated from gastric mucosal biopsy specimens is shown to be two-fold higher than that of the normal control. H. pylori eradication can reverse the proliferative effect on gastric mucosal epithelia though[20]. Moreover, both H. pylori intracellular extracts and secretions are found to directly stimulate epithelial growth. Our results indicate that the effects of H. pylori co-culture on GES-1 cell proliferation are H. pylori concentration dependent, preferably at a cell/H. pylori ratio of 1:50; however, the presence of high-concentration H. pylori suppresses GES-1 growth instead. The antiproliferative effect of high-concentration H. pylori has been reported in multiple cell lines. This inhibitive effect is associated with the production of massive cytotoxic factors, which cause DNA damage, induce cell apoptosis, increase the synthesis of induced nitric oxide synthase, and upregulate p53 expression[21-23]. Of note, GC-derived H. pylori strains produced a more potent proliferative effect on GES-1 cells than CG-derived H. pylori strains, which is consistent with the findings of Yu et al[24]. Moreover, both GC- and CG- H. pylori strains had a mild and comparable effect on apoptosis of GES-1 cells in a concentration-dependent but not strain-specific manner as shown by flow cytometry. These findings suggest that H. pylori strain-specific virulence may not be associated with gastric epithelial apoptosis, at least in vitro.
H. pylori strains isolated from humans are capable of colonizing the gastric mucosa of Mongolian gerbils[16,25]. Additionally, Hirayama et al[26] reported that H. pylori-infected Mongolian gerbils exhibited a gastric mucosal pathology similar to human H. pylori infection. In the present study, infection with the most virulent GC-derived H. pylori strain in Mongolian gerbils resulted in a series of mucosal pathologies that manifest as chronic inflammation, atrophy, intestinal metaplasia, or dysplasia more frequently than did the infection with the CG-derived strain over 52 wk. Moreover, GC developed as early as 28 wk following the infection with the GC-derived strain. This observation may be of significant clinical implications. First, previous studies have reported that the time to develop GC is approximately 62 wk[24] or even 72 wk after infection[27]. We assume that less virulent or less carcinogenic strains may have been used in the previous studies, and we propose that more carcinogenic strains should be used in animal experiments related to H. pylori-induced carcinogenesis and prevention of H. pylori-induced GC. Second and more importantly, it is suggested that the H. pylori strains that exhibit a potent epithelial proliferative effect are highly virulent and carcinogenic, and that individuals infected with these strains are at high risk for the development of GC and should receive appropriate H. pylori eradication therapy.
Human whole-genome microarray analysis identifies a large number of significant differentially expressed genes in GES-1 cells co-cultured with H. pylori strains vs non-infected control cells, which clearly indicates that H. pylori activates and inactivates a series of gene transcription of GES-1 cells in vitro. Our transcriptional profiling results were generally consistent with the previous reports. Liu et al[14] reported that H. pylori infection induced the up-regulated expression of multiple chemokines and chemokine receptors, such as IL-8 and CCL5, as well as of apoptosis-related genes, such as GADD45A. Eftang et al[28] reported that interleukin-8 was the single most up-regulated gene in whole genome profiling of H. pylori exposed gastric epithelial cells. MAPK and NF-κB cellular pathways were also powerfully activated; the marked up-regulation of TP53BP2 corresponding to ASPP2 protein may interact with H. pylori CagA, and cause marked p53 suppression of apoptosis. Sohn et al[29] suggested that the intracellularly translocated CagA may be involved in epithelial mesenchymal transition. However, the present study, for the first time, reports that the expression of HDAC6 and TRAF1 is up-regulated in gastric mucosal cells upon co-culture with GC-derived, cagA-positive H. pylori strain, and the expressions of these two proteins are progressively up-regulated in CG, intestinal metaplasia, dysplasia, and GC. Furthermore, such response seems to be strain-specific for many genes as the number of differentially expressed genes in cells co-cultivated with the GC-derived strain is 9-fold that in those co-cultured with the CG-derived strain. These significant differentially expressed genes involve genes that are known to be associated with tumorigenesis, among which HDAC6 and TRAF1 are the most prominent ones. The upregulation of HDAC6 and TRAF1 expressions in response to the GC-derived H. pylori-strain and in relation to H. pylori infection in patients with GC was verified by qRT-PCR in GES-1 cells in vitro and by immunohistochemistry in gastric specimens taken from patients with different gastric pathologies. To our best knowledge, this is the first study to identify the overexpression of HDAC6 and TRAF1 in H. pylori-associated GC, and to suggest a potential role of these genes in H. pylori-induced gastric carcinogenesis.
Histone is an important component of eukaryotic chromatin. Acetylation and deacetylation of histone are essential for the regulation and modification of gene expression[30]. A newly-discovered mechanism of carcinogenesis is that HDAC family proteins aberrantly binding to a specific promoter region may cause cryptic transcription and inhibit normal gene transcription, initiating the malignant transformation[31]. HDAC6 functions to modulate gene expression by removing the acetyl group from histones, which contributes to oncogenic cell transformation[32]. Aoyagi et al[33] reported that HDAC6 could directly regulate HSP90 expression via deacetylation. The targeted inhibition of HDAC6 reduces the deacetylation of HSP90 but increases the acetylation simultaneously, destroying HSP90 chaperones and resulting in molecular function failure. HDAC6 synergizes with HDAC10 to regulate vascular endothelial growth factor receptors through heat shock protein mediation as well[34]. HDAC6 has been found to be implicated in multiple malignancies, such as esophageal cancer, lung cancer, breast cancer, and oral squamous cell carcinoma[35,36]. Zhang et al[35] reported that high-HDAC6-expressing premenopausal breast cancer patients exhibited a favorable tumor-free survival and a sensitive response to endocrine therapy. HDAC is also thought to be associated with breast cancer metastasis as it de-acylates microtubules, whereas the combined use of estrogen antagonist and paclitaxel significantly suppresses the de-acylation of microtubules[37,38]. In the present study, the expression of HDAC6 mRNA was highly up-regulated in GES-1 cells co-cultured with the GC-derived H. pylori strain compared with those co-cultured with the CG-derived strain and uninfected control cells. It is likely that H. pylori infection activates HDAC6 to dysregulate the synthesis of histones in gastric epithelial cells[39]. However, further investigation is required to elucidate the exact mechanisms of H. pylori infection and the functional roles of H. pylori-activated HDAC6 overexpression in gastric carcinoma.
TRAF is a new member of the tumor necrosis factor (TNF) family[40]. Seven TRAF isoforms have been reported to interact directly with cell-surface receptors and regulate cell survival/death balance[41]. TRAF1 activates NF-κB to gradually initiate immortalization and tumorigenesis in GC[42]. Sughra et al[43] reported that TRAF1 functions primarily to up-regulate the transcription of IKKβ, an inhibitor of NF-κB and to enhance the activity of IKKβ as well. Therefore, TRAF1 activates and interacts with NF-κB simultaneously. The overexpression of TRAF1 has been identified in nasopharyngeal carcinoma and lymphoma[44,45]. The variation in TRAF1 expression is associated with the occurrence, metastasis, and induction of chemotherapy resistance of malignant tumors[46]. Similar to HDAC6, TRAF1 is verified by qRT-PCR to be up-regulated in GES-1 cells co-cultured with H. pylori strains, especially the GC-derived strain in the present study. Again, how H. pylori infection up-regulates TRAF1 expression and what downstream genes are activated and/or deactivated by H. pylori-induced TRAF1 overexpression require further investigation.
The roles of HDAC6 and TRAF1 in H. pylori-associated GC remain to be elucidated although their expression is significantly up-regulated in epithelial cells stimulated with GC-derived cagA positive H. pylori strain. Our GC animal model experiment showed that the proliferative effect in vitro of GC-derived cagA positive H. pylori strain can contribute to the carcinogenesis of gastric mucosa in vivo. However, the up-regulated expression of HDAC6 and TRAF1 may not be causative of proliferative or carcinogenic effect of the GC-derived H. pylori strain as no “loss-of-function” or “gain-of-function” experiment has been performed to elaborate the pathogenetic effect of HDAC6 and TRAF1 in GC. Moreover, we were unable to follow up GC patients in subsequent treatment period as they were referred to various general surgeons among multiple institutions at the patients’ own will. Therefore, the clinicopathological values of HDAC6 and TRAF1 are yet to be investigated, which are expected to be clinically useful for the prediction of prognosis and treatment resistance.
In conclusion, GC-derived H. pylori strains induce a more potent proliferative but comparable apoptotic effect in GES-1 cells as compared to CG-derived strains. HDAC6 and TRAF1 are identified to be up-regulated in GES-1 cells co-cultured with the GC-derived strain, which are further verified in vivo. These findings indicate that these two genes may be involved in H. pylori induced gastric carcinogenesis, although their exact roles require further investigation.
ACKNOWLEDGMENTS
We thank Medjaden Bioscience Limited for assisting in the preparation of this manuscript.
COMMENTS
Background
Helicobacter pylori (H. pylori) is a pathogenic bacterium colonizing gastric mucosae. It has been accepted to be the primary cause of upper gastrointestinal disorders, such as acute and chronic gastritis, peptic ulcer disease, and gastric cancer. However, the subsequent outcomes of persistent H. pylori infection are highly variable. Such variation in clinicopathological outcomes of H. pylori infection is believed to result from the variations in the virulence of different strains, genetic background of the host, and more importantly, the host-to-pathogen interactions. How gastric epithelial cells respond to H. pylori clinical isolates derived from patients with different pathologies, such as chronic gastritis (CG) and gastric cancer (GC) specimens, at the genome-wide level remains unknown. Therefore, this study was carried out to identify genes potentially involved in H. pylori-induced gastric carcinogenesis, by comparing the genomic profiles between gastric epithelial cells co-cultured with H. pylori strains isolated from patients with GC and those co-cultured with strains from patients with CG.
Research frontiers
It is likely that H. pylori strains themselves are highly variable in virulence to gastric mucosal epithelia, especially in terms of the carcinogenic effect. Genomic profiling analyses have identified a wide range of genetic variations among H. pylori strains isolated from patients with different gastric pathologies. Global gene expression profiles also vary greatly in human gastric epithelial immortalized cells infected with spiral versus coccoid H. pylori. These findings suggest that gastric epithelial cells tune in the expression of their genes, especially those associated with tumorigenesis, in response to specific H. pylori strains or a specific virulent factor of the strain. In addition to the core genes, strain-specific genes are thought to play an essential role in H. pylori propagation and pathogenesis.
Innovations and breakthroughs
This observation may be of significant clinical implications. First, previous studies have reported that the time to develop GC is approximately 62 wk or even 72 wk after infection. The authors assume that less virulent or less carcinogenic strains may have been used in the previous studies, and the authors propose that more carcinogenic strains should be used in animal experiments related to H. pylori-induced carcinogenesis and prevention of H. pylori-induced GC. Second and more importantly, it is suggested that the H. pylori strains that exhibit a potent epithelial proliferative effect are highly virulent and carcinogenic, and that individuals infected with these strains are at high risk for the development of GC and should receive appropriate H. pylori eradication therapy.
Applications
The roles of HDAC6 and TRAF1 in H. pylori-associated GC remain to be elucidated although their expression is significantly up-regulated in epithelial cells stimulated with GC-derived cagA positive H. pylori strain. These findings indicate that these two genes may be involved in H. pylori induced gastric carcinogenesis, although their exact roles require further investigation.
Peer review
The authors performed DNA microarray analysis comparing gene expression profiles between GES-1 cell lines co-cultured with highly virulent (cagA+) and low virulent (cagA-) H. pylori strains isolated from human gastric mucosa tissue with CG and GC tissue, respectively. These two strains showed different effect on the GES-1 cell line in cell proliferation activity but similar effect on the cell lines in apoptotic property. They identified 800 differentially expressed genes, and from six most differentially expressed genes, they selected TRAF1 and HDAC6. The authors examined HDAC1 and TRAF1 expression at the mRNA level in GES-1 cells co-cultured with the H. pylori strains above, and confirmed that these expressions were up-regulated in these cell lines. They also examined the expressions of these molecules immunohistochemically in surgically resected or biopsied specimens. These works are laborious and are considered to be scientifically of significant value.
Footnotes
Supported by Grants from the Department of Science and Technology, No. 2011FJ6087; the Natural Science Foundation of Hunan Province, China, No. 10JJ5035
Peer reviewer: Hitoshi Tsuda, MD, PhD, Diagnostic Pathology Section,Clinical Laboratory Division, National Cancer Center Hospital, 5-1-1 Tsukiji, Chuo-ku, Tokyo 104-0045, Japan
S- Editor Lv S L- Editor A E- Editor Zhang DN
References
- 1.Makola D, Peura DA, Crowe SE. Helicobacter pylori infection and related gastrointestinal diseases. J Clin Gastroenterol. 2007;41:548–558. doi: 10.1097/MCG.0b013e318030e3c3. [DOI] [PubMed] [Google Scholar]
- 2.Hongo M, Nagasaki Y, Shoji T. Epidemiology of esophageal cancer: Orient to Occident. Effects of chronology, geography and ethnicity. J Gastroenterol Hepatol. 2009;24:729–735. doi: 10.1111/j.1440-1746.2009.05824.x. [DOI] [PubMed] [Google Scholar]
- 3.Cave DR. Chronic gastritis and Helicobacter pylori. Semin Gastrointest Dis. 2001;12:196–202. [PubMed] [Google Scholar]
- 4.Lai LH, Sung JJ. Helicobacter pylori and benign upper digestive disease. Best Pract Res Clin Gastroenterol. 2007;21:261–279. doi: 10.1016/j.bpg.2006.10.002. [DOI] [PubMed] [Google Scholar]
- 5.Guindi M. Role of Helicobacter pylori in the pathogenesis of gastric carcinoma and progression of lymphoid nodules to lymphoma. Can J Gastroenterol. 1999;13:224–227. doi: 10.1155/1999/487098. [DOI] [PubMed] [Google Scholar]
- 6.Piazuelo MB, Epplein M, Correa P. Gastric cancer: an infectious disease. Infect Dis Clin North Am. 2010;24:853–69, vii. doi: 10.1016/j.idc.2010.07.010. [DOI] [PMC free article] [PubMed] [Google Scholar]
- 7.Fujimori T, Kawamata H, Ichikawa K, Ono Y, Okura Y, Tomita S, Imura J. Pathological issues of gastric and lower esophageal cancer: helicobacter pylori infection and its eradication. J Gastroenterol. 2002;37 Suppl 13:28–33. doi: 10.1007/BF02990096. [DOI] [PubMed] [Google Scholar]
- 8.Leontiadis GI, Sharma VK, Howden CW. Non-gastrointestinal tract associations of Helicobacter pylori infection. Arch Intern Med. 1999;159:925–940. doi: 10.1001/archinte.159.9.925. [DOI] [PubMed] [Google Scholar]
- 9.Hatakeyama M. Helicobacter pylori and gastric carcinogenesis. J Gastroenterol. 2009;44:239–248. doi: 10.1007/s00535-009-0014-1. [DOI] [PubMed] [Google Scholar]
- 10.Chen CN, Hsieh FJ, Cheng YM, Chang KJ, Lee PH. Expression of inducible nitric oxide synthase and cyclooxygenase-2 in angiogenesis and clinical outcome of human gastric cancer. J Surg Oncol. 2006;94:226–233. doi: 10.1002/jso.20372. [DOI] [PubMed] [Google Scholar]
- 11.Robertson EV, Jankowski JA. Genetics of gastroesophageal cancer: paradigms, paradoxes, and prognostic utility. Am J Gastroenterol. 2008;103:443–449. doi: 10.1111/j.1572-0241.2007.01574.x. [DOI] [PubMed] [Google Scholar]
- 12.Smith MG, Hold GL, Tahara E, El-Omar EM. Cellular and molecular aspects of gastric cancer. World J Gastroenterol. 2006;12:2979–2990. doi: 10.3748/wjg.v12.i19.2979. [DOI] [PMC free article] [PubMed] [Google Scholar]
- 13.McNamara D, El-Omar E. Helicobacter pylori infection and the pathogenesis of gastric cancer: a paradigm for host-bacterial interactions. Dig Liver Dis. 2008;40:504–509. doi: 10.1016/j.dld.2008.02.031. [DOI] [PubMed] [Google Scholar]
- 14.Liu ZF, Chen CY, Tang W, Zhang JY, Gong YQ, Jia JH. Gene-expression profiles in gastric epithelial cells stimulated with spiral and coccoid Helicobacter pylori. J Med Microbiol. 2006;55:1009–1015. doi: 10.1099/jmm.0.46456-0. [DOI] [PubMed] [Google Scholar]
- 15.Dixon MF, Genta RM, Yardley JH, Correa P. Classification and grading of gastritis. The updated Sydney System. International Workshop on the Histopathology of Gastritis, Houston 1994. Am J Surg Pathol. 1996;20:1161–1181. doi: 10.1097/00000478-199610000-00001. [DOI] [PubMed] [Google Scholar]
- 16.Watanabe T, Tada M, Nagai H, Sasaki S, Nakao M. Helicobacter pylori infection induces gastric cancer in mongolian gerbils. Gastroenterology. 1998;115:642–648. doi: 10.1016/s0016-5085(98)70143-x. [DOI] [PubMed] [Google Scholar]
- 17.Park SY, Jun JA, Jeong KJ, Heo HJ, Sohn JS, Lee HY, Park CG, Kang J. Histone deacetylases 1, 6 and 8 are critical for invasion in breast cancer. Oncol Rep. 2011;25:1677–1681. doi: 10.3892/or.2011.1236. [DOI] [PubMed] [Google Scholar]
- 18.Wang X, Wang Q, Hu W, Evers BM. Regulation of phorbol ester-mediated TRAF1 induction in human colon cancer cells through a PKC/RAF/ERK/NF-kappaB-dependent pathway. Oncogene. 2004;23:1885–1895. doi: 10.1038/sj.onc.1207312. [DOI] [PubMed] [Google Scholar]
- 19.Maeda S, Mentis AF. Pathogenesis of Helicobacter pylori infection. Helicobacter. 2007;12 Suppl 1:10–14. doi: 10.1111/j.1523-5378.2007.00529.x. [DOI] [PubMed] [Google Scholar]
- 20.Hoshi T, Sasano H, Kato K, Ohara S, Shimosegawa T, Toyota T, Nagura H. Cell damage and proliferation in human gastric mucosa infected by Helicobacter pylori--a comparison before and after H pylori eradication in non-atrophic gastritis. Hum Pathol. 1999;30:1412–1417. doi: 10.1016/s0046-8177(99)90161-2. [DOI] [PubMed] [Google Scholar]
- 21.Obst B, Wagner S, Sewing KF, Beil W. Helicobacter pylori causes DNA damage in gastric epithelial cells. Carcinogenesis. 2000;21:1111–1115. [PubMed] [Google Scholar]
- 22.Perfetto B, Buommino E, Canozo N, Paoletti I, Corrado F, Greco R, Donnarumma G. Interferon-gamma cooperates with Helicobacter pylori to induce iNOS-related apoptosis in AGS gastric adenocarcinoma cells. Res Microbiol. 2004;155:259–266. doi: 10.1016/j.resmic.2004.01.007. [DOI] [PubMed] [Google Scholar]
- 23.Ito K, Yamaoka Y, Yoffe B, Graham DY. Disturbance of apoptosis and DNA synthesis by Helicobacter pylori infection of hepatocytes. Dig Dis Sci. 2008;53:2532–2540. doi: 10.1007/s10620-007-0163-0. [DOI] [PMC free article] [PubMed] [Google Scholar]
- 24.Yu XW, Xu Y, Gong YH, Qian X, Yuan Y. Helicobacter pylori induces malignant transformation of gastric epithelial cells in vitro. APMIS. 2011;119:187–197. doi: 10.1111/j.1600-0463.2010.02709.x. [DOI] [PubMed] [Google Scholar]
- 25.Wirth HP, Beins MH, Yang M, Tham KT, Blaser MJ. Experimental infection of Mongolian gerbils with wild-type and mutant Helicobacter pylori strains. Infect Immun. 1998;66:4856–4866. doi: 10.1128/iai.66.10.4856-4866.1998. [DOI] [PMC free article] [PubMed] [Google Scholar]
- 26.Hirayama F, Takagi S, Kusuhara H, Iwao E, Yokoyama Y, Ikeda Y. Induction of gastric ulcer and intestinal metaplasia in mongolian gerbils infected with Helicobacter pylori. J Gastroenterol. 1996;31:755–757. doi: 10.1007/BF02347631. [DOI] [PubMed] [Google Scholar]
- 27.Honda S, Fujioka T, Tokieda M, Satoh R, Nishizono A, Nasu M. Development of Helicobacter pylori-induced gastric carcinoma in Mongolian gerbils. Cancer Res. 1998;58:4255–4259. [PubMed] [Google Scholar]
- 28.Eftang LL, Esbensen Y, Tannæs TM, Bukholm IR, Bukholm G. Interleukin-8 is the single most up-regulated gene in whole genome profiling of H. pylori exposed gastric epithelial cells. BMC Microbiol. 2012;12:9. doi: 10.1186/1471-2180-12-9. [DOI] [PMC free article] [PubMed] [Google Scholar]
- 29.Sohn SH, Lee YC. The genome-wide expression profile of gastric epithelial cells infected by naturally occurring cagA isogenic strains of Helicobacter pylori. Environ Toxicol Pharmacol. 2011;32:382–389. doi: 10.1016/j.etap.2011.08.006. [DOI] [PubMed] [Google Scholar]
- 30.Mottet D, Castronovo V. Histone deacetylases: anti-angiogenic targets in cancer therapy. Curr Cancer Drug Targets. 2010;10:898–913. doi: 10.2174/156800910793358014. [DOI] [PubMed] [Google Scholar]
- 31.Voelter-Mahlknecht S, Mahlknecht U. Cloning and structural characterization of the human histone deacetylase 6 gene. Int J Mol Med. 2003;12:87–93. [PubMed] [Google Scholar]
- 32.Lee YS, Lim KH, Guo X, Kawaguchi Y, Gao Y, Barrientos T, Ordentlich P, Wang XF, Counter CM, Yao TP. The cytoplasmic deacetylase HDAC6 is required for efficient oncogenic tumorigenesis. Cancer Res. 2008;68:7561–7569. doi: 10.1158/0008-5472.CAN-08-0188. [DOI] [PMC free article] [PubMed] [Google Scholar]
- 33.Aoyagi S, Archer TK. Modulating molecular chaperone Hsp90 functions through reversible acetylation. Trends Cell Biol. 2005;15:565–567. doi: 10.1016/j.tcb.2005.09.003. [DOI] [PubMed] [Google Scholar]
- 34.Park JH, Kim SH, Choi MC, Lee J, Oh DY, Im SA, Bang YJ, Kim TY. Class II histone deacetylases play pivotal roles in heat shock protein 90-mediated proteasomal degradation of vascular endothelial growth factor receptors. Biochem Biophys Res Commun. 2008;368:318–322. doi: 10.1016/j.bbrc.2008.01.056. [DOI] [PubMed] [Google Scholar]
- 35.Zhang Z, Yamashita H, Toyama T, Sugiura H, Omoto Y, Ando Y, Mita K, Hamaguchi M, Hayashi S, Iwase H. HDAC6 expression is correlated with better survival in breast cancer. Clin Cancer Res. 2004;10:6962–6968. doi: 10.1158/1078-0432.CCR-04-0455. [DOI] [PubMed] [Google Scholar]
- 36.Sakuma T, Uzawa K, Onda T, Shiiba M, Yokoe H, Shibahara T, Tanzawa H. Aberrant expression of histone deacetylase 6 in oral squamous cell carcinoma. Int J Oncol. 2006;29:117–124. [PubMed] [Google Scholar]
- 37.Hubbert C, Guardiola A, Shao R, Kawaguchi Y, Ito A, Nixon A, Yoshida M, Wang XF, Yao TP. HDAC6 is a microtubule-associated deacetylase. Nature. 2002;417:455–458. doi: 10.1038/417455a. [DOI] [PubMed] [Google Scholar]
- 38.Saji S, Kawakami M, Hayashi S, Yoshida N, Hirose M, Horiguchi S, Itoh A, Funata N, Schreiber SL, Yoshida M, et al. Significance of HDAC6 regulation via estrogen signaling for cell motility and prognosis in estrogen receptor-positive breast cancer. Oncogene. 2005;24:4531–4539. doi: 10.1038/sj.onc.1208646. [DOI] [PubMed] [Google Scholar]
- 39.Yoshida N, Omoto Y, Inoue A, Eguchi H, Kobayashi Y, Kurosumi M, Saji S, Suemasu K, Okazaki T, Nakachi K, et al. Prediction of prognosis of estrogen receptor-positive breast cancer with combination of selected estrogen-regulated genes. Cancer Sci. 2004;95:496–502. doi: 10.1111/j.1349-7006.2004.tb03239.x. [DOI] [PMC free article] [PubMed] [Google Scholar]
- 40.Wang Y, Zhang P, Liu Y, Cheng G. TRAF-mediated regulation of immune and inflammatory responses. Sci China Life Sci. 2010;53:159–168. doi: 10.1007/s11427-010-0050-3. [DOI] [PubMed] [Google Scholar]
- 41.Chung JY, Park YC, Ye H, Wu H. All TRAFs are not created equal: common and distinct molecular mechanisms of TRAF-mediated signal transduction. J Cell Sci. 2002;115:679–688. doi: 10.1242/jcs.115.4.679. [DOI] [PubMed] [Google Scholar]
- 42.Wu CY, Wang CJ, Tseng CC, Chen HP, Wu MS, Lin JT, Inoue H, Chen GH. Helicobacter pylori promote gastric cancer cells invasion through a NF-kappaB and COX-2-mediated pathway. World J Gastroenterol. 2005;11:3197–3203. doi: 10.3748/wjg.v11.i21.3197. [DOI] [PMC free article] [PubMed] [Google Scholar]
- 43.Sughra K, Birbach A, de Martin R, Schmid JA. Interaction of the TNFR-receptor associated factor TRAF1 with I-kappa B kinase-2 and TRAF2 indicates a regulatory function for NF-kappa B signaling. PLoS One. 2010;5:e12683. doi: 10.1371/journal.pone.0012683. [DOI] [PMC free article] [PubMed] [Google Scholar]
- 44.Wang C, Ai M, Ren W, Xiao H, Li X, Tang F, Gu H, Yi W, Weng X, Deng X, et al. Epstein-Barr virus encoded latent membrane protein 1 induces TRAF1 expression to promote anti-apoptosis activity via NF-kappaB signaling pathway in nasopharyngeal carcinoma. Chin Med J (Engl) 2003;116:1022–1028. [PubMed] [Google Scholar]
- 45.Guo F, Sun A, Wang W, He J, Hou J, Zhou P, Chen Z. TRAF1 is involved in the classical NF-kappaB activation and CD30-induced alternative activity in Hodgkin’s lymphoma cells. Mol Immunol. 2009;46:2441–2448. doi: 10.1016/j.molimm.2009.05.178. [DOI] [PubMed] [Google Scholar]
- 46.Zapata JM, Krajewska M, Krajewski S, Kitada S, Welsh K, Monks A, McCloskey N, Gordon J, Kipps TJ, Gascoyne RD, et al. TNFR-associated factor family protein expression in normal tissues and lymphoid malignancies. J Immunol. 2000;165:5084–5096. doi: 10.4049/jimmunol.165.9.5084. [DOI] [PubMed] [Google Scholar]