

Abstract
Purpose
MicroRNAs are short noncoding RNAs that regulate gene expression and are over- or under-expressed in most tumors, including colorectal adenocarcinoma. MicroRNAs are potential biomarkers and therapeutic targets and agents, but limited information on microRNAome alterations during progression in the well-known adenoma-adenocarcinoma sequence is available to guide their usage.
Experimental Design
We profiled 866 human microRNAs by microarray analysis in 69 matched specimens of microsatellite-stable adenocarcinomas, adjoining precursor adenomas including areas of high- and low-grade dysplasia, and nonneoplastic mucosa.
Results
We found 230 microRNAs that were significantly differentially expressed during progression, including 19 not reported previously. Altered microRNAs clustered into two major patterns of early (type I) and late (type II) differential expression. The largest number (n = 108) was altered at the earliest step from mucosa to low-grade dysplasia (subtype IA) prior to major nuclear localization of β-catenin, including 36 microRNAs that had persistent differential expression throughout the entire sequence to adenocarcinoma. Twenty microRNAs were intermittently altered (subtype IB), and six were transiently altered (subtype IC). In contrast, 33 microRNAs were altered late in high-grade dysplasia and adenocarcinoma (subtype IIA), and 63 in adenocarcinoma only (subtype IIB). Predicted targets in 12 molecular pathways were identified for highly altered microRNAs, including the Wnt signaling pathway leading to low-grade dysplasia. β-catenin expression correlated with downregulated microRNAs.
Conclusions
Our findings suggest that numerous microRNAs play roles in the sequence of molecular events, especially early events, resulting in colorectal adenocarcinoma. The temporal patterns and complexity of microRNAome alterations during progression will influence the efficacy of microRNAs for clinical purposes.
Introduction
Colorectal cancer is the second most common cause of cancer deaths in the United States (1) and results from progressive genetic and epigenetic alterations in the epithelial cells of the large bowel mucosa (2–6). The adenoma with epithelial dysplasia is the usual benign precursor neoplasm in a well-known morphologic and temporal nonneoplastic mucosa-adenoma-adenocarcinoma (NM-A-AC) sequence that provides an opportunity to determine alterations that are important in progression during tumorigenesis.
Numerous alterations in oncogenes and tumor suppressor genes described in adenocarcinomas are also found in adenomas, including mutation of APC, KRAS, BRAF, and P53 genes (2, 4). Tumors with chromosomal instability manifested by gains and losses of chromosomes and their parts are by far the most frequent molecular subtype of colorectal neoplasms and often have KRAS or P53 mutation. In contrast, microsatellite instability is seen in a small subset of colorectal adenocarcinomas due to loss of function of the DNA nucleotide mismatch repair system usually caused by silencing of MLH1 by hypermethylation. These tumors often have BRAF mutation (2, 4–6).
Molecular biomarkers in colorectal neoplasms have the potential to improve screening, aid in patient surveillance and diagnosis, indicate prognosis, predict response to chemotherapy, and serve as therapeutic targets or agents. MicroRNAs (miRNAs) are 17- to 22-nucleotide long non-coding endogenous single-stranded functional RNAs that regulate gene expression by regulating messenger RNA translation and degradation (7). MiRNAs can function as tumor suppressors or oncogenes depending upon the characteristics of their downstream targets, and alterations of miRNA expression in colorectal neoplasms have been well documented, especially differential miRNA profiles in adenocarcinoma as contrasted with nonneoplastic mucosa (8–22). Furthermore, differences in miRNA expression have been identified between microsatellite-stable and microsatellite instability high colorectal cancers (15, 21, 22).
Several studies have examined the colorectal adenoma that is the usual precursor to adenocarcinoma for expression of small numbers of selected miRNAs (9–13), and one study has used a global miRNA microarray approach (14). No previous study has addressed the small subset of adenomas that progress to adenocarcinoma. The paucity of data on miRNA alterations during the NM-A-AC sequence and the implications for the potential use of miRNAs as biomarkers and in therapeutic approaches led us to evaluate the differential expression of 866 human miRNAs by microarray analysis in 20 microsatellite-stable colorectal adenocarcinomas, their contiguous microdissected precursor adenoma, and nearby nonneoplastic mucosa. The aim of this study was to identify for the first time the patterns of variations in miRNA expression during the neoplastic progression that leads to the most frequent molecular subtype of colorectal cancer.
Materials and Methods
Patients and sample preparation
We searched the database of the Department of Pathology at The University of Texas MD Anderson Cancer Center and selected 21 patients who had invasive microsatellite-stable colorectal adenocarcinoma arising from a pre-existing adenoma and adjacent nonneoplastic mucosa in a resection specimen to permit pairwise analyses, and who had informed consent for research use of their residual tissue. In one of these patients, adenocarcinoma was no longer present in the sections cut for RNA extraction and only adenoma and nonneoplastic mucosa were analyzed. All 20 adenocarcinomas and the 21 adenomas were microsatellite stable by immunohistochemical analysis for nuclear expression of MLH1, MSH2, PMS2, and MSH6 mismatch repair proteins. Ten of the adenocarcinomas with remaining tissue were also microsatellite stable on testing of DNA by PCR amplification of a panel of 6 National Cancer Institute Workshop recommended microsatellite markers, as described elsewhere (23).
A hematoxylin and eosin-stained slide from each formalin-fixed, paraffin-embedded tissue block was used to select one block that had invasive adenocarcinoma and adenoma with low- and high-grade dysplasia with minimal contamination by stromal and inflammatory cells, and adjacent full thickness nonneoplastic mucosa including the surface epithelium and proliferative zone. This approach provided intraspecimen consistency, and 9 blocks contained all 4 tissue types. The hematoxylin and eosin slide from each selected block was then marked with insoluble ink on the coverslip to delineate the tissue for extraction. Unstained recut slides with 5-mm sections and no coverslip were laid over the marked slide, and the corresponding demarcated areas were manually microdissected. Clinical and pathologic characteristics are provided in Supplementary Table S1. The study was approved by The University of Texas MD Anderson Cancer Center Institutional Review Board.
Total RNA labeling and hybridization
All specimens from each case were processed and analyzed simultaneously to avoid bias. Total RNA, including miRNAs, was isolated from the microdissected deparaffinized tissue with the RecoverALL TM Total Nucleic Acid Isolation Kit (Ambion, Inc.) and labeled using the miRNA Complete Labeling and Hyb Kit (Agilent Technologies). Each labeled sample was hybridized to the Human miRNA Microarray Kit (V3, Agilent) containing oligonucleotide probes for 866 human miRNAs and 89 human viral miRNAs (product number G4470C, Design ID 021827) according to the miRNA Microarray System Protocol version 2.1. Twelve viral miRNAs were found to have statistically significant differences in expression, but their relevance was uncertain and these were not considered further.
MicroRNA data processing and statistical methods
Microarray data were processed using the statistical R package, Limma (Linear Models for Microarray Data; ref. 24). A linear mixed-effects model was fitted to the expression of each miRNA to identify differentially expressed miRNAs in the adenoma-adenocarcinoma sequence. The Beta-Uniform Mixture method was applied to control false discovery rate (FDR; ref.25). Hierarchical clustering analysis was done using Pearson correlation coefficients as distance metric and Ward's linkage rule. The robustness of sample clusters was verified by a bootstrapping method with 200 iterations. Principle component analysis was conducted to examine the data structure composed of multiple miRNA expressions. Pairwise comparisons were done by the simultaneous inference procedure (26). Values of P ≤ 0.05 were considered statistically significant. Further details are provided in Supplementary Text S2.
Real-time quantitative PCR for miRNA expression
To confirm the miRNA signature derived from the microarray analysis, ABI TaqMan miRNA assays (Applied Biosystems, Inc.) were done with the manufacturer's protocol for 6 selected miRNAs. Briefly, 7 ng of total RNA were reverse transcribed with RNase inhibitor, MultiScribe RT enzyme, and miRNA-specific stem-loop primer (Applied Biosystems). The RT reaction was used subsequently in TaqMan miRNA real-time PCR with the manufacturer's protocol and an ABI 7900 Sequence Detection Instrument and associated software. Each sample was run in triplicate. RNU48 pre-developed assay (Applied Biosystems) was used as the normalizer. Further details are provided in Supplementary Text S2.
Immunohistochemistry and quantitative image analysis for nuclear expression of β-catenin
Archival paraffin-embedded blocks of buffered formalin-fixed tissue from each case were used for immunohistochemistry with the polymeric biotin-free horseradish peroxide (HRP) method (Leica Microsystems) on a Bond Max Stainer (Vision Biosystems). Briefly, sections were cut at 4-μm thickness onto positively charged slides, pretreated with enzyme-induced epitope retrieval, and incubated with primary β-catenin antibody (mouse antibody clone 14, 1:500, BD Biosciences). The Refine Polymer Detection Kit was used for immunostaining with 3, 3-diamiobenzidine serving as chromagen.
Immunohistochemical sections were evaluated by light microscopy for nuclear expression of β-catenin. Areas of histopathologically identified nonneoplastic mucosa, low-grade and high-grade dysplasia in adenoma, and adenocarcinoma were demarcated with permanent ink on the coverslips. No nuclear expression was found in nonneoplastic mucosa. Nuclei positive for β-catenin in adenomas and adenocarcinomas were quantitated by automated image analysis at 20× magnification using the Aperio ScanScope XT (Aperio Technologies, Inc.) and Aperio Genie Pattern Recognition software with a custom Genie Training Macro that was 98% sensitive and specific in separating tumor from stroma. Genie Nuclear Algorithm version 9.1 was then used to create a custom β-catenin classifier with curvature threshold adjustment to decluster closely apposed nuclei and with reduced cytoplasmic intensity to avoid false-positives. All algorithm adjustments were tested to assure accurate detection of positive and negative nuclei as visualized by light microscopy. Nuclear labeling index, defined as number of immunohistochemically positive nuclei divided by total number of nuclei and expressed as percentage, was calculated for each adenocarcinoma, high-grade dysplasia, and low-grade dysplasia. Further details are provided in Supplementary Text S2.
The Friedman rank sum test was applied to test the null hypothesis of no difference in the β-catenin labeling index in the progression from nonneoplastic mucosa to adenocarcinoma. Correlation between miRNA expression and labeling index in each tissue type of all specimens was measured using Spearman rank correlation coefficient.
miRNA target prediction and pathway identification
The P values of the miRNAs differentially expressed between nonneoplastic mucosa and low-grade dysplasia and between high-grade dysplasia and adenocarcinoma were rank ordered to identify the first 10 miRNAs, all of which were upregulated. Three miRNAs were statistically significantly differentially expressed in the comparison between low- and high-grade dysplasia, and these were downregulated. We first made a graphical presentation of the comparisons to distinguish the 5 “common” steps in the NM-A-AC sequence from the 3 “specific” steps, as shown in Fig. 1. The comparison between low- and high-grade dysplasia was not included in the common steps because only 3 miRNAs were statistically significantly differentially expressed.
Figure 1.
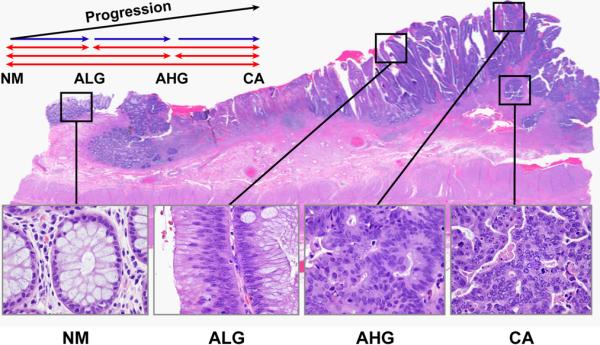
Photomicrograph illustrating the NM-A-AC sequence and histopathologic identification of tissue areas for microdissection, RNA extraction, and microRNAome profiling. The 4 boxes from left to right indicate nonneoplastic mucosa, villous adenoma with low-grade dysplasia, high-grade dysplasia in the adenoma, and contiguous adenocarcinoma invading submucosa, respectively. Graphic presentation of comparisons to distinguish “common” pathways (red arrows) from “specific” pathways (blue arrows) for our pathway analysis is also illustrated.
We used the http://www.microrna.org resource to retrieve the genes predicted by the algorithm MIRANDA to be targeted by the statistically significant miRNAs considered above. We used PERL to sort the genes based on the number of common miRNAs that targeted them and generated 4 gene lists as follows: First, genes targeted in common by at least 3 of the 11 miRNAs significant in at least 4 pairwise comparisons (the 10 most significantly differentiated miRNAs in 4 comparisons together with let-7i that was the only significantly differentiated miRNA in 5 comparisons, designated as the common steps). Second, genes targeted in common by at least 3 miRNAs of the 10 most significant for the transition from nonneoplastic mucosa to low-grade dysplasia, designated specific step 1 (Fig. 1). Third, genes targeted in common by the 2 miRNAs significant for the transition between low- and high-grade dysplasia, designated specific step 2, and for which the microrna.org database provided results. Fourth, genes targeted in common by at least 3 miRNAs of the 10 most significant for the transition from high-grade dysplasia to adenocarcinomas, designated specific step 3. We then used “DAVID” Bioinfomatics Resources 6.7 (http://david.abcc.ncifcrf.gov/) to determine the pathways involving these genes (Supplementary Table S3). To confirm the involvement of the Wnt signaling pathway during the earliest transition from nonneoplastic mucosa to low-grade dysplasia, we also examined the results from other miRNA target prediction algorithms:microT(http://diana.cslab.ece.ntua.gr/microT/), TargetScan (http://www.targetscan.org/), and PITA (http://genie.weizmann.ac.il/pubs/mir07/; Supplementary Table S4).
Results
Altered miRNA expression in the NM-A-AC sequence
We evaluated the microRNAome in 69 matched specimens microdissected from one histopathologic section with a microsatellite-stable colorectal adenocarcinoma arising in a contiguous precursor adenoma and nearby nonneoplastic mucosa of 21 patients (Fig. 1). In one of the patients with adenocarcinoma, the histopathologic sections recut for the study had only nonneoplastic mucosa and villous adenoma with low- and high-grade dysplasia remaining (Supplementary Table S1). The adenocarcinoma therefore could not be analyzed for miRNA expression, resulting in a study set with 20 cancers.
A total of 230 miRNAs were identified to be differentially expressed in the NM-A-AC sequence by the linear mixed-effect model (FDR < 0.01). Two-way unsupervised hierarchical cluster analysis of the expression of these miRNAs resulted in discovery of 3 major clusters of tissue types (Fig. 2). The clusters were confirmed by the bootstrapping method. The first cluster was composed exclusively of nonneoplastic mucosae; the second mainly of nonneoplastic mucosae and low-grade dysplasias in adenomas with a few high-grade dysplasias and adenocarcinomas; and the third mainly of adenocarcinomas with a few admixed lowand high-grade dysplasias. The association between these clusters and disease progression as represented by the 4 tissue types was highly statistically significant (P < 0.001 by Fisher exact test). Principle component analysis revealed that nonneoplastic mucosae and adenocarcinomas were relatively separable from each other, and that samples with high- or low-grade dysplasia in adenomas were generally mixed together with the adenocarcinomas (Supplementary Fig. S5).
Figure 2.

Two-way unsupervised hierarchical clustering of the 230 differentially expressed miRNAs in the 4 tissue types with nonneoplastic mucosa indicated by orange bars, low-grade dysplasia in adenoma by cyan green bars, high-grade dysplasia in adenoma by purple bars, and invasive adenocarcinoma by blue bars. Black represents median expression; pure red, +3 and higher expression; and pure green, −3 and lower expression. Three clusters of tissue types are evident. The first is composed exclusively of nonneoplastic mucosae; the second mainly of nonneoplastic mucosae and low-grade dysplasias in adenomas and a few high-grade dysplasias and adenocarcinomas; and the third mainly of adenocarcinomas with a mixture of low-grade and high-grade dysplasias. The association between these clusters and disease progression represented by the 4 tissue types was highly significant (P < 0.001, Fisher exact test).
Pairwise comparisons among the 4 tissue types in the NM-A-AC sequence identified marked differences in the number of differentially expressed miRNAs (Fig 3). The largest number, 216 of the 230 altered miRNAs, was differentially expressed between nonneoplastic mucosa and adenocarcinoma, followed by 144 between mucosa and high-grade dysplasia in adenomas, 134 between mucosa and low-grade dysplasia, 99 between low-grade dysplasia and adenocarcinoma, 25 between high-grade dysplasia and adenocarcinoma, but only 3 between low-grade and high-grade dysplasia.
Figure 3.
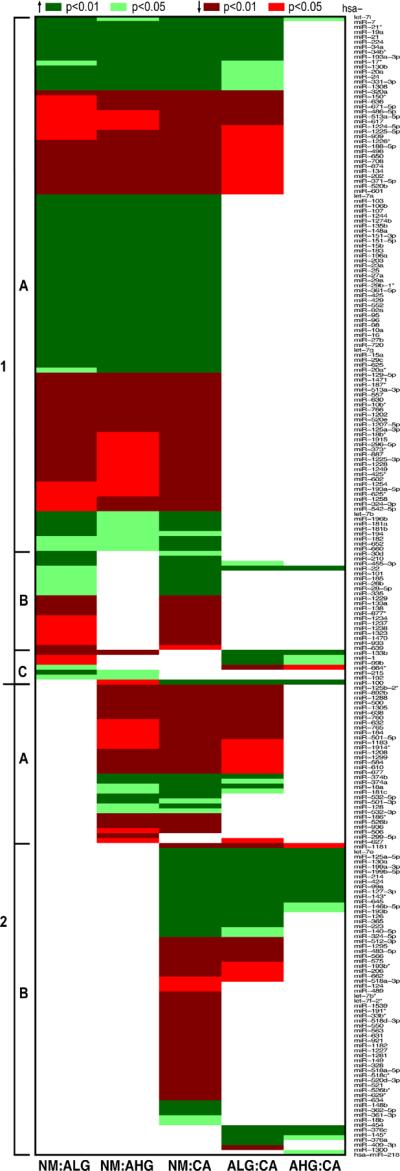
Pairwise comparisons of nonneoplastic mucosa with low-grade dysplasia in adenoma (NM:ALG), with high-grade dysplasia in adenoma (NM:AHG), and with adenocarcinoma (NM:CA); and between low-grade 2 or high-grade dysplasia and adenocarcinoma (ALG:CA and AHG:CA, respectively). Each row represents the P values for each pairwise comparison for the miRNA listed in the right column 1. The type 1 pattern is 1 defined by miRNAs that are altered between mucosa and low-grade dysplasia and includes 3 subtypes of miRNAs with early persistent (1A), early intermittent (1B), and early transient (1C) alterations. The type 2 pattern is evident for miRNAs that are not altered in expression between mucosa and low-grade dysplasia but are altered late in the NM-A-AC sequence. MiRNAs with late intermediate (2A) and late (2B) alterations are illustrated.
Thirty-six miRNAs were significantly differentially expressed along the entire sequence as represented by all 4 comparisons between nonneoplastic mucosa paired with the 3 types of neoplasm and low-grade dysplasia paired with adenocarcinoma (Fig. 3). Upregulated and downregulated miRNAs were found among the 36, and the extent of changes was variable. Of the 16 upregulated miRNAs, 11 were increased 2-fold or greater during progression (miR-7, -19a, -20a, -21, -22, -24, -34a, -34b, -224, and -331-3p and let-7i; range 2–6 fold), including 5 that were increased more than 2-fold at the earliest step between mucosa and low-grade dysplasia (miR-20a, -21, -24, -34a, and -224), and 8 that were increased from 2- to 4-fold between mucosa and high-grade dysplasia (miR-7, -19a, -20a, -21, -24, -34a, -34b, and -224). Three miRNAs were decreased at least 2-fold (miR-188-5p, -650, and -671-5p). Nineteen of the miRNAs were not previously described as altered in colorectal adenocarcinoma, to our knowledge (miR-130b, -188-5p, -202, -331-3p, -371-5p, -455-3p, -520b, -513a-5p, -601, -617, -636, -650, -671-5p, -708, -939, -1224-5p, -1225-5p, -1226, and -1308). None of the 36 miRNAs was significantly differentially expressed when analyzed for site in the colorectum, age, gender, or stage of disease after adjustment for within-patient correlation.
Confirmation of altered expression of selected miRNAs
The differential expression detected by microarray analysis was evaluated by quantitative real-time PCR (qRT-PCR) for 6 selected miRNAs. Two were chosen to confirm miRNAs previously described as altered in colorectal adenomas and/or adenocarcinomas (miRs-17 and -224; refs. 8, 12, 14, 18, 19, 27) and 4 (miR-130b, -601, -939, and -1225-5p) to confirm miRNAs not previously described as altered in colorectal neoplasms. [MiR-130b is a paralogous sequence of miR-130a that had been described previously as altered (28).] The microarray results were confirmed for all 6 miRNAs (Supplementary Table S6).
Patterns of altered miRNA expression in the NM-A-AC sequence
Grouping of the pairwise comparisons among the 4 tissue types that had statistically significant differences revealed 2 major patterns of altered miRNA expression (Fig. 3, Fig. 4, and Supplementary Table S7). The first major pattern resulted from 134 miRNAs with early altered expression in which significant changes occurred at the first step in the NM-A-AC sequence, that is, between mucosa and low-grade dysplasia in adenomas, and was designated as type I pattern. The second major pattern was composed of 96 miRNAs with later alteration of expression, designated as type II pattern that was not present in low-grade dysplasia.
Figure 4.

Illustration of the 5 patterns of altered miRNA expression for individual patients. The type I pattern is defined by miRNAs that are altered between nonneoplastic mucosa and low-grade dysplasia and includes 3 subtypes of miRNAs with early persistent (IA), early intermittent (Ib), and early transient (IC) alterations. The type II pattern is evident for miRNAs that are not altered in expression between mucosa and low-grade dysplasia but are altered late in the NM-A-AC sequence. MiRNAs with late intermediate (IIA) and late (IIB) alterations are evident. Asterisk on 877 indicates low expression relative to the opposite arm of the hairpin.
Subgroups were evident within these 2 major groups. In the type I pattern, 108 miRNAs had altered expression that persisted throughout the progression from low-grade dysplasia through high-grade dysplasia to adenocarcinoma, termed the early persistent pattern that was composed of subtype IA miRNAs (Figs. 3 and 4). This group included the 36 miRNAs identified from the pairwise comparisons of the 4 tissue types, along with 72 others. A second subgroup of 20 miRNAs had an early intermittent pattern of alteration during progression and was designated as subtype IB miRNAs. These miRNAs had significant changes in expression between mucosa and low-grade dysplasia and between mucosa and adenocarcinoma that did not persist between mucosa and high-grade dysplasia. The third subgroup consisting of 6 miRNAs had an early transient pattern of differential expression and was termed subtype IC miRNAs. Although different between mucosa and adenoma, the early altered expression in these 6 miRNAs did not persist between mucosa and adenocarcinoma.
Within the group of miRNAs with the type II late pattern (n = 96) that lacked altered expression at the earliest step between mucosa and low-grade dysplasia, 33 miRNAs were altered in the mid portion of the NM-A-AC sequence, resulting in a late intermediate pattern of subtype IIA miRNAs. These miRNAs differed between mucosa and high-grade dysplasia and adenocarcinoma (Figs. 3 and 4). The final subgroup of 63 miRNAs was altered only late, at the step of adenocarcinoma. This late pattern, resulting from subtype IIB miRNAs, had significantly altered expression between adenocarcinoma and mucosa or dysplasia, but not between mucosa and the premalignant tissue types.
Patterns of altered miRNA expression and β-catenin localization
We compared the miRNA alteration patterns to nuclear β-catenin localization because dysregulation of the WNT signaling pathway resulting from mutation of the APC gene is well known to be an important early step in colorectal tumorigenesis and leads to abnormal β-catenin translocation into tumor cell nuclei, although Wnt activation can also occur in the absence of detectable nuclear β-catenin accumulation (29–31). We found no nuclear localization of β-catenin in nonneoplastic mucosa. The means and standard deviations of the β-catenin nuclear labeling indices by immunohistochemistry and morphometric image analysis were 3.8% ± 1.4% (range 1.6%–6.5%) for low-grade dysplasia in adenomas, 7.1% ± 2.7% (range 2.9%–10.7%) for high-grade dysplasia in adenomas, and 9.1% ± 7.8% (range 1.2%–30.5%) for adenocarcinomas (P = 0.01 by Friedman rank sum test). Thus, the type I early alterations in miRNA expression preceded major nuclear localization of β-catenin.
In our exploratory analysis, we found statistically significant correlation (P < 0.05, absolute value of Spearman correlation coefficients > 0.56) between nuclear labeling index for β-catenin and expression levels of 23 miRNAs, most included in subtype 1I, in adenomas with low-grade dysplasia. Thirteen of these miRNAs were positively correlated with nuclear β-catenin expression (let-7a and miR-22, -30d, -95, -98, -99b, -127-3p, -130a, -133a, -151-3p, -185, -196b, and -425), and 10 were inversely correlated (miR-184, -498, -500, -501-5p, -520-3p, -617, -877, -921, -1288, and -1305). In addition, we observed that the correlation between miRNA expression and labeling index was stronger in adenomas with low-grade dysplasia than in adenocarcinoma (bimodal distribution of correlation coefficients in adenomas as contrasted with distribution around zero in carcinomas; Fig. 5).
Figure 5.
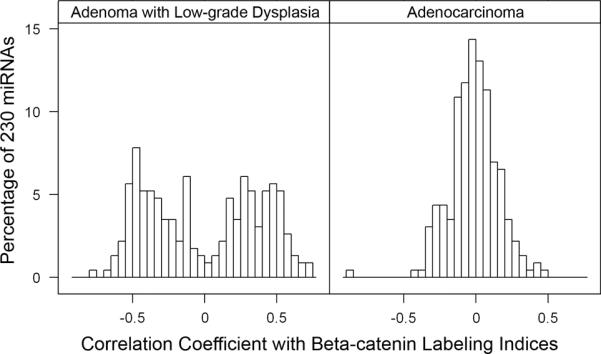
Histograms of Spearman rank correlation coefficients between levels of miRNA expression and nuclear β-catenin labeling indices. The X-axis has the correlation coefficient values, and the Y-axis indicates the percentage of the 230 miRNAs that were differentially expressed in the NM-A-AC sequence with the corresponding correlation coefficient values. A biomodal distribution is evident in adenomas with low-grade dysplasia (ALG) indicating that numerous miRNAs have positive or inverse correlation of their expression with β-catenin expression. In contrast, carcinomas (CA) have a normal distribution with only small numbers of miRNAs with expression correlated with β-catenin expression. The findings indicate the importance of miRNA alterations at the earliest step in tumorigenesis.
MiRNA-targeted pathways in the NM-A-AC sequence
To gain further insight into the possible roles of abnormally expressed miRNAs during the NM-A-AC sequence, we used the http://www.microrna.org/ data resource and “DAVID” Bioinformatics Resources version 6.7 to carry out searches for the predicted targets, followed by Gene Ontology Pathway Analysis of the commonly predicted targets (Fig. 6 and Supplementary Table S3). We identified let-7i as the only miRNA differentially expressed in all 5 pairwise comparisons (P < 0.05; max value of P = 2.87E-02). Ten additional miRNAs were significantly differentially expressed in 4 of 6 pairwise comparisons (P < 0.01). Eight of these miRNAs (miR-7, -21*, -224, -34b*, -34a, -193a-3p, -21, -19a) were upregulated during all steps from mucosa to low-grade dysplasia to high-grade dysplasia to adenocarcinomas, whereas one (miR-320a) was downregulated. These 9 miRNAs were members of subtype IA. The tenth miRNA (miR-133b) was downregulated from mucosa to low-grade dysplasia and from mucosa to high-grade dysplasia, but upregulated from both low- and high-grade dysplasia to adenocarcinoma.
Figure 6.

Members of WNT signaling pathway predicted by MIRANDA algorithm to be targeted by miRNAs that are significantly differential expressed early in the NM-A-AC sequence (yellow) or that are significantly correlated with nuclear expression of β-catenin (orange).
Upon further analysis of let-7i and the 10 miRNAs described above, we identified significantly enriched (P < 0.05) targets in 12 pathways, including the mitogen-activated protein kinase signaling pathway (P < 0.001) that contains the FGRBR1 gene and 35 other members. We also identified 3 pathways in common (Wnt signaling pathway, melanoma, and pathways in cancer) during the early 2-step transition from mucosa to high-grade dysplasia (Supplementary Table S3). More importantly, when we determined the gene pathways affected by altered miRNAs in the 3 specific steps from mucosa to low-grade dysplasia, low- to high-grade dysplasia, and high-grade dysplasia to adenocarcinoma, we found that in the earliest step of colorectal tumorigenesis (mucosa compared with low-grade dysplasia) the Wnt pathway that is well known to be aberrant in colorectal adenocarcinoma was involved (P = 0.001). In addition, 8 of the altered miRNAs (miR-20a, -23a, -25, -27a, -34a, -92a, -148a, and -203) had 9 identified targets in the canonical, planar cell polarity, and calcium ion components of the Wnt pathway (Fig. 6, Table 1) with redundancy in the miRNAs affecting each target, and each miRNA having multiple targets in the Wnt pathway. The Wnt signaling pathway also seemed significant when using the following algorithms: microT (http://diana.cslab.ece.ntua.gr/microT/), TargetScan (http://www.targetscan.org/), and PITA (http://genie.weizmann.ac.il/pubs/mir07/; Supplementary Table S4).
Table 1.
Summary of identified miR targets in the Wnt signaling pathway illustrating redundant relationships in the functional pathway components.
| Designation | Frizzled | Ebil | CBP | NLK | CycD | Prickle | PLC | CaMKII | NFAT |
|---|---|---|---|---|---|---|---|---|---|
| Pathway | Can., PCP, Ca++ | Canonical | PCP | Calcium Ion | |||||
| miR | |||||||||
| −20a | + | + | + | + | + | ||||
| −23a | + | + | |||||||
| −25 | + | + | + | ||||||
| −27a | + | + | + | + | |||||
| −34a | + | + | + | ||||||
| −92a | + | + | + | + | + | + | |||
| −148a | + | + | + | + | + | + | |||
| −203 | + | + | + | + | |||||
| Designation | Gene Symbol | Name |
|---|---|---|
| Frizzled | FZD4 | frizzled homolog 4 (Drosophila) |
| FZD7 | frizzled homolog 7 (Drosophila) | |
| Ebil | TBL1XR1 | transducin (beta)-like 1 X-linked receptor 1 |
| CBP | EP300 | E1A binding protein p300 |
| NLK | NLK | nemo-like kinase |
| CycD | CCND1 | cyclin D1 |
| Prickle | PRICKLE2 | prickle homolog 2 (Drosophila) |
| PLC | PLCB1 | phospholipase C, beta 1 (phosphoinositide-specific) |
| CaMKII | CAMK2A | calcium/calmodulin-dependent protein kinase II alpha |
| NFAT | NFAT5 | nuclear factor of activated T-cells 5, tonicity-responsive |
Can. = Canonical pathway; PCP = Planar polarity pathway; Ca++ = Calcium ion pathway
Pathway analysis of targets for miRNAs we found were correlated with β-catenin nuclear expression revealed that downregulated miRs-617 and -498 (subtype IA) were predicted to regulate β-catenin (Fig. 6). These predictions affirm the seminal importance of altered Wnt signaling in colorectal tumorigenesis and indicate that variations in expression of multiple genes in the pathway provide a mechanism for dysregulation. Because APC mutation is uncommon in adenomas, our findings also suggest that abnormal regulation by miRNAs is among the earliest steps in colorectal adenoma development.
Discussion
Our study expands understanding of the complex roles of miRNAs in colorectal tumorigenesis. Numerous published studies have addressed miRNAs in colorectal cancer (reviewed in ref. 8), but few have reported on the NM-A-AC sequence (9–14). These studies have evaluated small numbers of selected miRNAs (9–13) or a miRNA profile (14) without concentration on pairwise comparison of precursor tissues from the same neoplasm to reduce intertumoral heterogeneity within individual patients (9–14), the microsatellite instability status of the cancers (9–13), or the subset of adenomas that give rise to adenocarcinoma (9–14). In contrast, our study used a microRNAome profiling approach for paired specimens of microsatellite-stable adenocarcinomas that represent the most frequent molecular subtype and their contiguous precursor adenomas. We showed extensive alterations in miRNA expression with frequent early changes (n = 134 type I miRNAs) and found 5 subpatterns that indicate the complexity of the miRNA alterations, including the timing of the alterations during progression.
Previous studies of colorectal adenomas that addressed specific miRNAs have reported alterations compared with nonneoplastic mucosa for 6 members of the miR-17-92 cluster (12) and miR-21 (11), -135a and -135b (10), -137 (13), and -143 and -145 (9). The previously reported profiling study (14) evaluating 735 miRNAs identified 31 that had more than 2-fold change in expression in adenomas, including miR-135a, -135b, and -137 from the earlier reports, although miR-135a was found to have decreased expression in contrast to increased expression in the earlier report. We found among 866 miRNAs that miR-19a, -20a, -21, -92a, and -135b from the previous reports were altered. In addition to confirming the alteration of these miRNAs in adenomas, we expanded upon these previous results by identifying that all of these miRNAs had the early persistent pattern (subtype IA), suggesting that their alteration occurred early in tumorigenesis and was maintained. These repeatedly identified miRNAs, therefore, are likely drivers rather than consequences of neoplastic progression. Comparison of our findings with the other published profile analysis (14) identified 453 probes in common between the 2 studies. Eleven miRNAs (miR-1, -96, -100, -133a, -135b, -182, -183, -224, -299-5p, -552, and -584) were altered in adenomas in both profiling studies, and 328 miRNAs were unaltered in adenomas in both (Supplementary Table S8). The concordance of results for 339 miRNAs occurred despite methodologic differences in analysis platforms, miRNA annotation, and criteria for change in expression, as well as study design differences in patient populations, tissue types (frozen or formalin-fixed, paraffin-embedded), sample sizes, and relationship of the studied adenomas to adenocarcinoma (separate or contiguous). In addition, fifty of the miRNAs that were altered between nonneoplastic mucosa and adenoma in our study were reported previously to be altered in colorectal cancer (reviewed in reference 8). Our findings therefore emphasize the importance of numerous miRNAs in the early phase of colorectal tumorigenesis.
The biological meaning and clinical implications of the 5 subpatterns of miRNA alterations we observed remain to be explored fully. The majority of alterations occurred between nonneoplastic mucosa and adenomas with low-grade dysplasia when mutations of intensely studied genes, including APC, and other structural DNA alterations are uncommon (2) and before nuclear localization of β-catenin was a prominent feature in our study. Intratumoral heterogeneity poses a challenge in understanding these cellular events because miRNA expression represents the net result of levels in the population of evaluated cells, and mechanistic studies are therefore needed to explain our observations. From the clinical perspective, we identified among the large number of type I miRNAs a set of 36 that had significantly increased or decreased expression throughout the entire progression from nonneoplastic mucosa to adenoma and adenocarcinoma. These miRNAs are likely to be of interest for exploration as markers and as therapeutic targets (32) and agents (33) due to their ubiquitous changes. We identified throughout progression the deregulated expression of 19 miRNAs not previously described in colorectal adenocarcinoma to our knowledge. In addition, we describe for the first time the relationships among the individual steps in morphologic progression along the NM-A-AC sequence and dysregulation of numerous miRNAs. These subtypes of miRNAs have potential as markers and therapeutic targets and agents with greater specificity for steps along progression than the ubiquitously altered miRNAs, although few miRNAs were altered between low-grade and high-grade dysplasia in adenomas that were contiguous with an adenocarcinoma in our study.
The subtypes of altered miRNA expression seem to be associated with propensity of the miRNAs to be detectable in plasma, affected by chemotherapy, and serve as therapeutic targets. Use of plasma miRNAs as biomarkers for early detection of colorectal neoplasia has been proposed (34–38). In plasma samples from patients with advanced adenomas, miR-29a and -92a (34) and miR-17-3p and -92 (36) that are all in our subtype IA were associated with the presence of an adenoma, suggesting that plasma miRNA may have propensity to be derived from the early persistent subtype of miRNA. In addition, several studies have examined the effects of chemotherapy on miRNAs in human colon cancer cell lines (18, 39). Three miRNAs (miR-16, -34a, and -34b) that were increased in 2 human colon cancer cell lines treated with adriamycin (39) are in subtype IA. Among these, miR-34a inhibited cell proliferation, contributed to induction of apoptosis and G1 arrest, downregulated the E2F family of transcription factors, and both upregulated and was a target for the p53 pathway (27). A study of the effects of 5-fluorouracil (5-Fu), the most commonly used chemotherapeutic agent for colorectal cancer, in human colon cancer cell lines (18) found 19 miRNAs upregulated and 3 downregulated. Fifteen of these miRNAs (miR-19a, -20, -21, -23a, -25, -27a, -27b, -29a, -133a, -135b, -151, -182, -185, -210, and -224) are in our subtypes IA and IB.
Among the novel miRNAs we found, we confirmed by qRT-PCR the alteration of 4 of interest, including the upregulation of miR-130b. A recent study described this miRNA as rescuing human mammary epithelial cells from Ras-induced senescence by preventing RasG12V-induced upregulation of the cell cycle inhibitor p21Waf1/Cip1 (40) that is known to downregulate expression of thymidylate synthase, a target enzyme of 5-FU (41). Three other downregulated novel miRNAs, miR-601, -939, and -1225-5p, are in subtype IA and have a variety of targets of interest. Putative targets of miR-601 include tyrosine 3-monooxygenase/tryptophan 5-monooxygenase activation protein zeta polypeptide (YWHAZ) in the 14-3-3 family that mediates signal transduction (Targetscan 5.1) and that is implicated in carcinogenesis (42), and aquaporin-1 that mediates membrane permeability in human colon cancer cell lines and affects invasion and metastasis (43). Reported targets of miR-939 include RasL10B that is downregulated in human breast cancer cell lines, suggesting that this miRNA may be a tumor suppressor (44), and tumor necrosis factor alpha that has been associated with clinical characteristics of colorectal tumors (45). A putative target of miR-1225-5p is HIC2 (hypermethylated in cancer 2)/HRG22 (HIC1-related gene on chromosome 22) that has been identified as a tumor suppressor gene (46) and is transcriptionally inactivated in numerous human cancers including colorectal carcinoma (47, 48). Another possible target is the paternally expressed 10 (PEG10) gene that is overexpressed in hepatic adenomas and hepatocellular carcinomas (49, 50).
In conclusion, we speculate that the 5 patterns of miRNA alterations we identified in the NM-A-AC sequence reflect both primary events and processes that are reactive and adaptive to previous genetic, epigenetic, and miRNA alterations. The large number of miRNAs (n = 134) that we found to be altered between nonneoplastic mucosa and low-grade dysplasia in adenomas (type I pattern) at the outset of the NM-A-AC sequence likely produces early dysregulation of numerous cellular pathways (51). As a result, understanding of the mechanisms for and consequences of these complex early miRNA changes may provide important insights into potential strategies to prevent progression that leads to cancer in the NM-A-AC sequence. The late alterations (type II pattern) may provide information on mechanisms of benign to malignant conversion. Understanding the nature of the alterations is essential to effective use of miRNAs as biomarkers and therapeutic targets or agents because many of the alterations are linked to steps in the sequence.
Supplementary Material
Translational Relevance.
We show for the first time the complex patterns of altered microRNA expression during the mucosa-adenoma-adenocarcinoma sequence in the colorectum. In addition, through bioinformatic analysis of the pathways targeted by the altered microRNAs, we highlight the importance of microRNAs as another mechanism for dysregulation of the Wnt signaling pathway at the earliest step in tumorigenesis between nonneoplastic mucosa and low-grade dysplasia in adenomas. Because microRNAs are of interest as biomarkers and as therapeutic targets and agents, our findings identify specific microRNAs that are altered during the steps in colorectal tumor progression and may guide translation into clinical usage of microRNAs.
Acknowledgments
The authors thank Robert Sherrigan for sharing the updated version of the microrna.org target prediction database; Kim Ahn-Vu and Lynda Corley for graphics and technical assistance.
Grant Support Work in laboratory of G.A. Calin was supported in part by NIH grant 1R01CA135444. G.A. Calin is supported as a Fellow of The University of Texas M. D. Anderson Cancer Center Research Trust, and as a Fellow of The University of Texas System Regents Research Scholar program. Dr. Hamilton was supported by the Frederick F. Becker Distinguished University Chair in Cancer Research from The University of Texas. The study used shared resources of the Cancer Center Support Grant (P30 CA016672).
Footnotes
Supplementary data for this article are available at Clinical Cancer Research Online (http://clincancerres.aacrjournals.org/).
Disclosure of Potential Conflicts of Interest No potential conflicts of interests were disclosed.
References
- 1.Jemal A, Siegel R, Xu J, Ward E. Cancer statistics, 2010. CA Cancer J Clin. 2010;60:277–300. doi: 10.3322/caac.20073. [DOI] [PubMed] [Google Scholar]
- 2.Grady WM, Carethers JM. Genomic and epigenetic instability in colorectal cancer pathogenesis. Gastroenterology. 2008;135:1079–99. doi: 10.1053/j.gastro.2008.07.076. [DOI] [PMC free article] [PubMed] [Google Scholar]
- 3.George B, Kopetz S. Predictive and prognostic markers in colorectal cancer. Curr Oncol Rep. 2011;13:206–15. doi: 10.1007/s11912-011-0162-3. [DOI] [PubMed] [Google Scholar]
- 4.Hureta S. Recent advances in the molecular diagnosis and prognosis of colorectal cancer. Expert Rev Mol Diagn. 2008;8:277–88. doi: 10.1586/14737159.8.3.277. [DOI] [PubMed] [Google Scholar]
- 5.Samowitz WS. Genetic and epigenetic changes in colon cancer. Exp Molec Pathol. 2008;85:64–7. doi: 10.1016/j.yexmp.2008.03.008. [DOI] [PubMed] [Google Scholar]
- 6.Markowitz S, Bertagnolli M. Molecular basis of colorectal cancer. N Eng J Med. 2009;361:2449–60. doi: 10.1056/NEJMra0804588. [DOI] [PMC free article] [PubMed] [Google Scholar]
- 7.Esquela-Kerscher A, Slack FJ. Oncomirs-microRNAs with a role in cancer. Nat Rev Cancer. 2006;6:259–69. doi: 10.1038/nrc1840. [DOI] [PubMed] [Google Scholar]
- 8.Luo X, Burwinkel B, Tao S, Brenner H. MicroRNA signatures: novel biomarkers for colorectal cancer? Cancer Epidemiol Biomarkers Prev. 2011;20:1272–86. doi: 10.1158/1055-9965.EPI-11-0035. [DOI] [PubMed] [Google Scholar]
- 9.Michael MZ, O'Connor SM, van Holst Pellekaan NG, Young GP, James RJ. Reduced accumulation of specific microRNAs in colorectal neoplasia. Mol Cancer Res. 2003;1:882–91. [PubMed] [Google Scholar]
- 10.Nagel R, le Sage C, Diosdado B, van der Waal M, Oude Vrielink JA, Bolijn A, et al. Regulation of the adenomatous polyposis coli gene by the miR-135 family in colorectal cancer. Cancer Res. 2008;68:5795–802. doi: 10.1158/0008-5472.CAN-08-0951. [DOI] [PubMed] [Google Scholar]
- 11.Schetter AJ, Leung SY, Sohn JJ, Zanetti KA, Bowman ED, Yanaihara N, et al. MicroRNA expression profiles associated with prognosis and therapeutic outcome in colon adenocarcinoma. J Am Med Assoc. 2008;299:425–36. doi: 10.1001/jama.299.4.425. [DOI] [PMC free article] [PubMed] [Google Scholar]
- 12.Diosdado B, van de Wiel MA, Terhaar Sive Droste JS, Mongera S, Postma C, Meijerink WJ, et al. MiR-17-92 cluster is associated with 13q gain and c-myc expression during colorectal adenoma to adenocarcinoma progression. Br J Cancer. 2009;101:707–14. doi: 10.1038/sj.bjc.6605037. [DOI] [PMC free article] [PubMed] [Google Scholar]
- 13.Balaguer F, Link A, Lozano JJ, Cuatrecasas M, Nagasaka T, Boland CR, et al. Epigenetic silencing of miR-137 is an early event in colorectal carcinogenesis. Cancer Res. 2010;70:6609–18. doi: 10.1158/0008-5472.CAN-10-0622. [DOI] [PMC free article] [PubMed] [Google Scholar]
- 14.Oberg AL, French AJ, Sarver AL, Subramanian S, Morlan BW, Riska SM, et al. miRNA expression in colon polyps provides evidence for a multihit model of colon cancer. PLoS One. 2011;6:e20465. doi: 10.1371/journal.pone.0020465. [DOI] [PMC free article] [PubMed] [Google Scholar]
- 15.Lanza G, Ferracin M, Gafà R, Veronese A, Spizzo R, Pichiorri F, et al. mRNA/microRNA gene expression profile in microsatellite unstable colorectal cancer. Mol Cancer. 2007;6:54. doi: 10.1186/1476-4598-6-54. [DOI] [PMC free article] [PubMed] [Google Scholar]
- 16.Cummins JM, He Y, Leary RJ, Pagliarini R, Diaz LA, Jr, Sjoblom T, et al. The colorectal microRNAome. Proc Natl Acad Sci U S A. 2006;103:3687–92. doi: 10.1073/pnas.0511155103. [DOI] [PMC free article] [PubMed] [Google Scholar]
- 17.Xi Y, Shalgi R, Fodstad O, Pilpel Y, Ju J. Differentially regulated microNAs and actively translated messenger RNA transcripts by tumor suppressor p53 in colon cancer. Clin Cancer Res. 2006;12:2014–24. doi: 10.1158/1078-0432.CCR-05-1853. [DOI] [PubMed] [Google Scholar]
- 18.Rossi L, Bonmassar E, Faraoni I. Modification of miR gene expression pattern in human colon cancer cells following exposure to 5-fluorouracil in vitro. Pharmacol Res. 2007;56:248–53. doi: 10.1016/j.phrs.2007.07.001. [DOI] [PubMed] [Google Scholar]
- 19.Akao Y, Nakagawa Y, Naoe T. MicroRNA-143 and -145 in colon cancer. DNA Cell Biol. 2007;26:311–20. doi: 10.1089/dna.2006.0550. [DOI] [PubMed] [Google Scholar]
- 20.Akao Y, Nakagawa Y, Naoe T. let-7 microRNA functions as a potential growth suppressor in human colon cancer cells. Biol Pharm Bull. 2006;29:903–6. doi: 10.1248/bpb.29.903. [DOI] [PubMed] [Google Scholar]
- 21.Sarver AL, French AJ, Borralho PM, Thayanithy V, Oberg AL, Silverstein KA, et al. Human colon cancer profiles show differential microRNA expression depending on mismatch repair status and are characteristic of undifferentiated proliferation states. BMC Cancer. 2009;19:401. doi: 10.1186/1471-2407-9-401. [DOI] [PMC free article] [PubMed] [Google Scholar]
- 22.Earle JS, Luthra R, Romans A, Abraham R, Ensor J, Yao H, et al. Association of microRNA expression with microstatellite instability status in colorectal adenocarcinoma. J Mol Diagn. 2010;12:433–40. doi: 10.2353/jmoldx.2010.090154. [DOI] [PMC free article] [PubMed] [Google Scholar]
- 23.Boland CR, Thibodeau SN, Hamilton SR, Sidransky D, Eshleman JR, Burt RW, et al. A National Cancer Institute Workshop on microsatellite instability for cancer detection and familial predisposition: development of international criteria for the determination of microsatellite instability in colorectal cancer. Cancer Res. 1998;58:5248–57. [PubMed] [Google Scholar]
- 24.Smyth GK. Limma: Linear models for microarray data. In: Gentleman R, Carey V, Dudoit S, Irizarry R, Huber W, editors. Bioinformatics and computational biology solutions using R and Bioconductor. Springer; New York: 2005. pp. 397–420. [Google Scholar]
- 25.Pounds S, Morris SW. Estimating the occurrence of false positives and false negatives in microarray studies by approximating and partitioning the empirical distribution of p-values. Bioinformatics. 2003;19:1236–42. doi: 10.1093/bioinformatics/btg148. [DOI] [PubMed] [Google Scholar]
- 26.Hothorn T, Bretz F, Westfall P. Simultaneous inference in general parametric models. Biom J. 2008;50:346–63. doi: 10.1002/bimj.200810425. [DOI] [PubMed] [Google Scholar]
- 27.Tarasov V, Jung P, Verdoodt B, Lodygin D, Epanchintsev A, Menssen A, et al. Differential regulation of microRNAs by p53 revealed by massively parallel sequencing: miR-34a is a p53 target that induces apoptosis and G1-arrest. Cell Cycle. 2007;6:1586–93. doi: 10.4161/cc.6.13.4436. [DOI] [PubMed] [Google Scholar]
- 28.Hol L, Leerdam van M, Boersma AW, Kuipers EJ, Wiemer EA. MicroRNA expression profiling of colorectal cancer and its precancerous lesions using Lna™ oligonucleotide arrays. Gastroenterology. 2008;134:A–748. [Google Scholar]
- 29.Brabletz T, Jung A, Hermann K, Gunther K, Hohenberger W, Kirchner T. Nuclear overexpression of the oncoprotein beta-catenin in colorectal cancer is localized predominantly at the invasion front. Pathol Res Pract. 1998;194:701–4. doi: 10.1016/s0344-0338(98)80129-5. [DOI] [PubMed] [Google Scholar]
- 30.Brabletz T, Jung A, Reu S, Porzner M, Hlubek F, Kunz-Schughart LA, et al. Variable beta-catenin expression in colorectal cancers indicates tumor progression driven by the tumor environment. Proc Natl Acad Sci U S A. 2001;98:1036–61. doi: 10.1073/pnas.171610498. [DOI] [PMC free article] [PubMed] [Google Scholar]
- 31.Yan D, Wiesmann M, Rohan M, Chan V, Jefferson AB, Guo L, et al. Elevated expression of axin2 and hnkd mRNA provides evidence that Wnt/beta-catenin signaling is activated in human colon tumors. Proc Natl Acad Sci U S A. 2001;98:14973–8. doi: 10.1073/pnas.261574498. [DOI] [PMC free article] [PubMed] [Google Scholar]
- 32.Nana-Sinkam SP, Croce CM. MicroRNAs as therapeutic targets in cancer. Transl Res. 2011;157:216–25. doi: 10.1016/j.trsl.2011.01.013. [DOI] [PubMed] [Google Scholar]
- 33.Bader AG, Brown D, Stoudemire J, Lammers P. Developing therapeutic miRNAs for cancer. Gene Ther. 2011 Jun 2; doi: 10.1038/gt.2011.79. Epub ahead of print. [DOI] [PMC free article] [PubMed] [Google Scholar]
- 34.Huang Z, Huang D, Ni S, Peng Z, Sheng W, Du X. Plasma microRNAs are promising novel biomarkers for early detection of colorectal cancer. Int J Cancer. 2010;127:118–26. doi: 10.1002/ijc.25007. [DOI] [PubMed] [Google Scholar]
- 35.Chen X, Ba Y, Ma L, Cai X, Yin Y, Wang K, et al. Characterization of microRNAs in serum: a novel class of biomarkers for diagnosis of cancer and other diseases. Cell Res. 2008;18:997–1006. doi: 10.1038/cr.2008.282. [DOI] [PubMed] [Google Scholar]
- 36.Ng EK, Chong WW, Jin H, Lam EK, Shin VY, Yu J, et al. Differential expression of microRNAs in plasma of patients with colorectal cancer: a potential marker for colorectal cancer screening. Gut. 2009;58:1375–81. doi: 10.1136/gut.2008.167817. [DOI] [PubMed] [Google Scholar]
- 37.Brase JC, Wuttig D, Kuner R, Sültmann H. Serum microRNAs as non-invasive biomarkers for cancer. Mol Cancer. 2010;9:306. doi: 10.1186/1476-4598-9-306. [DOI] [PMC free article] [PubMed] [Google Scholar]
- 38.Dong Y, Wu WK, Wu CW, Sung JJ, Yu J, Ng SS. MicroRNA dysregulation in colorectal cancer: a clinical perspective. Br J Cancer. 2011;104:893–8. doi: 10.1038/bjc.2011.57. [DOI] [PMC free article] [PubMed] [Google Scholar]
- 39.Tazawa H, Tsuchiya N, Izumiya M, Nakagama H. Tumor-suppressive miR-34a induces senescence-like growth arrest through modulation of the E2F pathway in human colon cancer cells. Proc Natl Acad Sci U S A. 2007;104:15472–7. doi: 10.1073/pnas.0707351104. [DOI] [PMC free article] [PubMed] [Google Scholar]
- 40.Borgdorff V, Lleonart ME, Bishop CL, Fessart D, Bergin AH, Overhoff MG, et al. Multiple microRNAs rescue from Ras-induced senescence by inhibiting p21(Waf1/Cip1) Oncogene. 2010;29:2262–71. doi: 10.1038/onc.2009.497. [DOI] [PubMed] [Google Scholar]
- 41.Takagi K, Sowa Y, Cevik OM, Nakanishi R, Sakai T. CDK inhibitor enhances the sensitivity to 5-fluorouracil in colorectal cancer cells. Int J Oncol. 2008;32:1105–10. [PubMed] [Google Scholar]
- 42.Niemantsverdriet M, Wagner K, Visser M, Backendorf C. Cellular functions of 14-3-3 zeta in apoptosis and cell adhesion emphasize its oncogenic character. Oncogene. 2008;27:1315–9. doi: 10.1038/sj.onc.1210742. [DOI] [PubMed] [Google Scholar]
- 43.Jiang Y. Aquaporin-1 activity of plasma membrane affects HT20 colon cancer cell migration. IUBMB Life. 2009;61:1001–9. doi: 10.1002/iub.243. [DOI] [PubMed] [Google Scholar]
- 44.Zou H, Hu L, Li J, Zhan S, Cao K. Cloning and characterization of a novel small monomeric GTPase, RasL10B, with tumor suppressor potential. Biotechnol Lett. 2006;28:1901–8. doi: 10.1007/s10529-006-9176-6. [DOI] [PubMed] [Google Scholar]
- 45.Køadny J, Suchy J, Køujszo-Grabowska E, Kacperski T, Scott RJ, Kurzawski G, et al. Clinical characteristics of tumors derived from colorectal cancer patients who harbor the tumor necrosis factor alpha-1031T/T and NOD2 3020insC polymorphism. Cancer Epidemiol. 2009;33:161–3. doi: 10.1016/j.canep.2009.06.004. [DOI] [PubMed] [Google Scholar]
- 46.Deltour S, Pinte S, Guérardel C, Leprince D. Characterization of HRG22, a human homologue of the putative tumor suppressor gene HIC1. Biochem Biophys Res Commun. 2001;287:427–34. doi: 10.1006/bbrc.2001.5624. [DOI] [PubMed] [Google Scholar]
- 47.Fleuriel C, Touka M, Boulay G, Guérardel C, Rood BR, Leprince D. HIC1 (Hypermethylated in Cancer 1) epigenetic silencing in tumors. Int J Biochem Cell Biol. 2009;41:26–33. doi: 10.1016/j.biocel.2008.05.028. [DOI] [PMC free article] [PubMed] [Google Scholar]
- 48.Makos M, Nelkin BD, Lerman MI, Latif F, Zbar B, Baylin SB. Distinct hypermethylation patterns occur at altered chromosome loci in human lung and colon cancer. Proc Natl Acad Sci U S A. 1992;89:1929–33. doi: 10.1073/pnas.89.5.1929. [DOI] [PMC free article] [PubMed] [Google Scholar]
- 49.Tsou AP, Chuang YC, Su JY, Yang CW, Liao YL, Liu WK, et al. Overexpression of a novel imprinted gene, PEG10, in human hepatocellular carcinoma and in regenerating mouse livers. J Biomed Sci. 2003;10:625–35. doi: 10.1159/000073528. [DOI] [PubMed] [Google Scholar]
- 50.Jie X, Lang C, Jian Q, Chaoqun L, Dehua Y, Yi S, et al. Androgen activates PEG10 to promote carcinogenesis in hepatic cancer cells. Oncogene. 2007;26:5741–51. doi: 10.1038/sj.onc.1210362. [DOI] [PubMed] [Google Scholar]
- 51.Pino MS, Chung DC. The chromosomal instability pathway in colon cancer. Gastroenterology. 2010;138:2059–72. doi: 10.1053/j.gastro.2009.12.065. [DOI] [PMC free article] [PubMed] [Google Scholar]
Associated Data
This section collects any data citations, data availability statements, or supplementary materials included in this article.