

Abstract
The clinicopathological and biological characteristics of squamous cell/adenosquamous carcinoma (SC/ASC) of gallbladder have not been well documented because it is a rare subtype of gallbladder cancer. In this study, the protein expression of Nectin-2 and DDX3 in 46 SC/ASCs and 80 adenocarcinomas was measured using immunohistochemistry. We demonstrated that positive Nectin-2 and DDX3 expression was significantly associated with large tumor size, high TNM stage, and lymph node metastasis of SC/ASC and AC. Positive Nectin-2 and DDX3 expression was significantly associated with invasion and surgical curability of AC. Univariate Kaplan-Meier analysis showed that positive Nectin-2 and DDX3 expression, degree of differentiation, tumor size, TNM stage, invasion, lymph node metastasis, and surgical curability were significantly associated with post-operative survival in both SC/ASC and AC patients. Multivariate Cox regression analysis showed that positive Nectin-2 and DDX3 expression, degree of differentiation, tumor size, TNM stage, invasion, lymph node metastasis, and no surgical curability are independent poor-prognostic factors in both SC/ASC and AC patients. Our study suggested that positive Nectin-2 and DDx3 expression is closely correlated with clinical, pathological, and biological behaviors as well as poor-prognosis of gallbladder cancer.
Keywords: Gallbladder cancer, adenocarcinoma, squamous cell carcinoma, adenosquamous carcinoma, Nectin-2, DDX3, prognosis, metastasis
Introduction
Gallbladder cancers (GBCs) are the fifth most common gastrointestinal cancer and the most common biliary tract malignancy in the USA [1,2]. The prognosis of GBCs is extremely poor with high mortality. Early diagnosis is generally impossible because of the lack of specific signs or symptoms [3]. Over 90% of GBC patients are diagnosed at an inoperable stage with serious invasion and metastasis to other organs [4]. The majority of GBCs are adenocarcinomas (AC, >90%) [5]; in contrast, other histopathologic subtypes such as mucinous, papillary, and squamous subtypes are rarely observed [2]. Squamous cell/adenosquamous carcinoma (SC/ASC) represents 1% to 12% of various gallbladder cancers [2,6]. The clinicopathological characteristics of SC/ASC have not been well documented because most available reports are individual case reports or analysis of small case series. Therapeutic interventions for SC/ASC have not yet been established [7]. Although biomarkers for predicting prognosis of AC are currently under investigation, none of the proposed markers have reached clinical application [8]. Importantly, no biomarkers relating to the progression and prognosis of SC/ASC have been reported. It is therefore significant to document both the clinicopathological and biological characteristics of SC/ASC.
Metastasis is a hallmark of poor prognosis for various cancers [9]. However, metastasis is a rather complex process. During early stages, loss of cell adhesion allows malignant cells to detach and to escape from the primary mass [10]. At a later stage, tumor cells must be arrested by local endothelial cells through adhesive interactions to establish metastatic foci at the secondary site [11]. These processes strongly depend on adhesion molecules on the surface of tumor cells [12]. Nectins are immunoglobulin-like cell adhesion molecules that have been recently demonstrated to play key roles in cell-cell adhesions and cell activities, including cell polarization, differentiation, movement, proliferation and survival [13,14]. The Nectin family of cell adhesion molecules is comprised of four members, Nectin-1, -2, -3, and -4, all of which are expressed ubiquitously in epithelial and endothelial cells of various organs as well as their tumors [15]. Recent studies observed abnormal expression of Nectins in tumor cells and tissues. For example, reduction of Nectin-1alpha at cell-cell adherens junctions was observed in invasive squamous cell tumors [16]. In addition, strong Nectin-1 expression was observed in normal squamous mucosa, dysplasia, and invasive carcinomas of the human uterine cervix, but its expression is reduced or absent in the advancing edge of invasive tumors [17]. These findings suggest that down-regulation of Nectin-1 may be associated with the loss of cell-to-cell adhesion at the advancing edge of invasion. In contrast, increased cell surface Nectin-1 availability was also observed in migratory and invasive carcinoma [18]. Similarly, Nectin-2 was found to be less frequently expressed in lymphoblastic leukemias [19], but high expression of Nectin-2 was found in leukemic blasts and myeloma tissues [20,21].
DEAD box RNA helicases participate in disparate cellular functions through regulating RNA metabolism, which participates in the progression of cancer [22,23]. Human DDX3 is a member of the DEAD-box family of RNA helicases, and recent reports indicate that DDX3 can participate in the transcriptional regulation of a diverse set of genes involved in apoptosis and cellular transformations that impact cancer progression [24]. Overexpression of DDX3 can lead to the down-regulation of E-cadherin expression in immortalized breast epithelial cells, which is a marker of an epithelial mesenchymal transition phenotype associated with cancer progression in several cancers [22]. High expression of DDX3 has been observed in a variety of tumor cells. For example, DDX3 has been shown to be upregulated in hepatocellular carcinoma tissues and was thought to contribute to hepatitis C virus-mediated carcinogenic processes [25]. DDX3 was recently reported to be an antiapoptotic protein, which impede TRAIL-R2-induced apoptosis in resistant cancer cells [26]. However, DDX3 has diverse functions in a variety of cell types and may harbor a growth-suppressive property in hepatocellular carcinoma [27].
The expression of Nectin-2, DDX3, and their functions in gallbladder cancers have not been identified. In this study, the expressions of Nectin-2 and DDX3 in surgically resected specimens, including AC and SC/ASC, were examined using immunohistochemistry. The correlations of Nectin-2 and DDX3 expressions with clinicopathological characteristics and prognosis of AC and SC/ASC were comparatively evaluated.
Materials and methods
Case selection
This study was pre-approved by The Ethics Committee for Human Research, Central South University. A total of 46 squamous cell/adenosquamous carcinoma (SC/ASC) samples that underwent surgical resection or biopsy was diagnosed from a total of 1060 gallbladder cancer samples collected from January 1995 to December 2009 from 7 hospitals. Among the 1060 gallbladder cancers, 80 adenocarcinoma (AC) samples with available survival information were randomly selected for comparison in this study. Among the 46 SC/ASC patients, 27 patients were female and 19 were male (F/M = 1.42) with an age variation from 35 to 82 (55.8 ± 9.6) years. According to the TNM staging system, 5 cases of the 46 SC/ASCs were stage I, 7 were stage II, 17 were stage III, and 14 were stage IV tumors. Among the 80 AC patients, 54 patients were female and 26 patients were male (F/M = 2.08) with an age variation from 33 to 80 (53.8 ± 9.9) years. Surgery included radical resection for 14 SC/ASCs and 26 ACs, palliative surgery for 18 SC/ASCs and 28 ACs, and no operation for 14 SC/ASCs and 26 ACs with only biopsy. Among the 80 ACs, 8 cases were stage I, 13 were stage II, 38 were stage III, and 21 were stage IV tumors. Gallstones were found in 28 SC/ASC and 38 AC patients. Survival information of all 46 SC/ASC and 80 AC patients was obtained through letters and phone calls. The follow-up time was 2 years. Cases that survived longer than 2 years were included in the analysis as censored cases.
Immunohistochemistry staining
The rabbit anti-CD112 (Nectin-2) and rabbit anti-DDX3 antibodies were purchased from Abgent Company (California, USA). Staining was conducted with the peroxidase-based EnVision™ Detection kit (Dako Laboratories, CA, USA) by following the user manual. Briefly, 4 μM sections were cut from routinely paraffin-embedded tissues of AC and SC/ASC. After the sections were deparaffinized and incubated with 3% H2O2 for 15 minutes, they were soaked with phosphate buffered saline (PBS) for 3 x 5 minutes and then incubated with rabbit anti-CD112 (1:100 dilution) or rabbit anti-DDX3 (1:100 dilution) antibody for 1 hr at room temperature. After rinsing sections with PBS for 3 times, solution A (containing HRP-conjugated second antibody) was added, and incubated for 30 minutes. The substrate DAB was added followed by hematoxylin counter-staining. After dehydration, the slides were soaked in xylene for 3 x 5 minutes. The positive control was the positive sections purchased from Beijing Zhongshan Biotechnology Company (Beijing, China) while the negative control was designed by replacing the primary antibody with 5% fetal bovine serum. The percentage of positive cells was calculated from 500 cells in 10 random fields. Cases with positive cells ≥ 25% were considered positive, while cases with positive cells < 25% were considered negative.
Statistical analysis
Data was analyzed using the statistical package for the Social Sciences Version 14.0 (SPSS 14.0). The inter-relationship of Nectin-2 or DDX3 expression with histological or clinical factors was analyzed using x2 or Fisher’s exact test. Kaplan-Meier and time series test were used for univariate survival analysis. Cox proportional hazards model was used for multivariate analysis and to determine the 95% confidence interval.
Results
Comparison of clinicopathological characteristics and Nectin-2 and DDX3 expression between SC/ASC and AC
The percentage of SC/ASC in total GBCs (46/1060) is 4.34%. The percentage of cases with age older than 45 years and tumor mass > 3cm was significantly higher in SC/ASCs than in ACs while the percentage of cases with poorly-differentiated tumors was significantly lower in SC/ASCs than in ACs (Table 1, p < 0.05). No significant differences in other clinicopathological characteristics as well as the percentage of positive Nectin-2 and DDX3 expression were observed between SC/ASC and AC patients. EnVision immunohistochemistry revealed that Nectin-2 and DDX3 positive reactions were mainly localized in the cytoplasm of SC/ASC (Figure 1) and AC (Figure 2).
Table 1.
Comparison of clinicopathological characteristics, Nectin-2, and DDX3 expression between SC/ASC and AC
| Clinicopathological characteristics | SC/ASC (n=46) | AC (n=80) | X2 | P value |
|---|---|---|---|---|
| Sex | ||||
| male | 19(41.3) | 26(32.5) | 0.986 | 0.352 |
| female | 27(58.7) | 54(67.5) | ||
| Age (years) | ||||
| ≤45 | 3(6.5) | 16(20.0) | 4.143 | 0.042* |
| >45 | 43(93.5) | 64(80.0) | ||
| Differentiation | ||||
| well | 16(34.8) | 27(33.8) | 8.515 | 0.014* |
| moderately | 24(52.2) | 25(31.3) | ||
| poorly | 6(13.0) | 28(35.0) | ||
| Tumor mass size | ||||
| ≤3cm | 20(43.5) | 50(62.5) | 4.280 | 0.039* |
| >3cm | 26(56.5) | 30(37.5) | ||
| Gallstones | ||||
| no | 18(39.1) | 42(52.5) | 2.093 | 0.148 |
| yes | 28(60.9) | 38(47.5) | ||
| TNM stage | ||||
| I+II | 12(26.1) | 21(26.3) | 0.287 | 0.866 |
| III | 20(33.5) | 38(47.5) | ||
| IV | 14(30.4) | 21(26.3) | ||
| Lymph node metastasis | ||||
| no | 17(37.0) | 30(37.5) | 0.004 | 0.952 |
| yes | 29(63.0) | 50(62.5) | ||
| Invasion | ||||
| no | 16(34.8) | 31(38.8) | 0.197 | 0.658 |
| yes | 30(62.5) | 49(61.3) | ||
| Operative procedure | ||||
| radical | 14(30.4) | 26(32.5) | 0.215 | 0.898 |
| palliative | 18(39.1) | 28(35.0) | ||
| biopsy | 14(30.4) | 26(32.5) | ||
| Survival time | 10.07(4-25) | 10.34(3-27) | 0.014 | 0.906 |
| Nectin-2 | ||||
| - | 18(39.1) | 31(38.7) | 0.002 | 0.966 |
| + | 28(60.9) | 49(61.3) | ||
| DDX3 | ||||
| - | 21(45.7) | 36(45.0) | 0.005 | 0.944 |
| + | 25(54.3) | 44(55.0) |
p<0.05.
Figure 1.
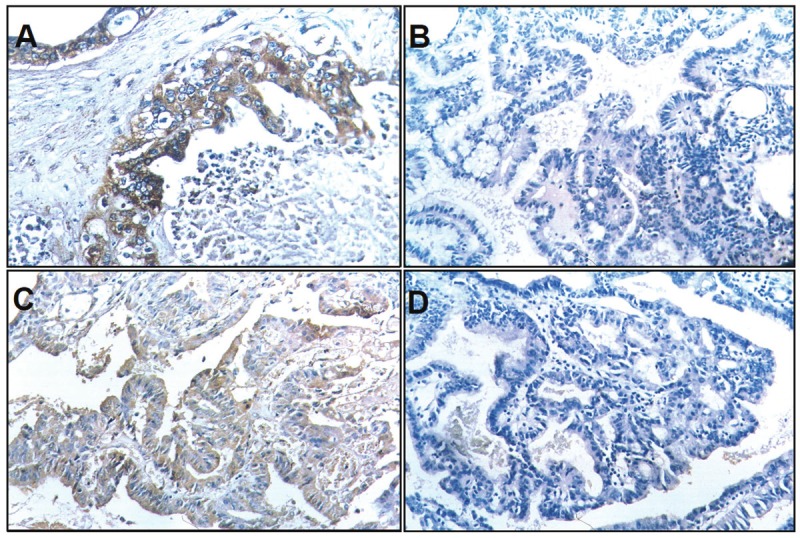
Nectin-2 and DDX3 expression in SC/ASC. EnVision immunohistochemistry, original magnification x200. Nectin-2 and DDX3 positive reaction was mainly localized in the cytoplasm. A: Positive Nectin-2 expression in moderately differentiated SC/ASC. B: Negative Nectin-2 expression in well differentiated SC/ASC. C: Positive DDX3 expression in moderately differentiated SC/ASC. D: Negative DDX3 expression in well differentiated SC/ASC.
Figure 2.
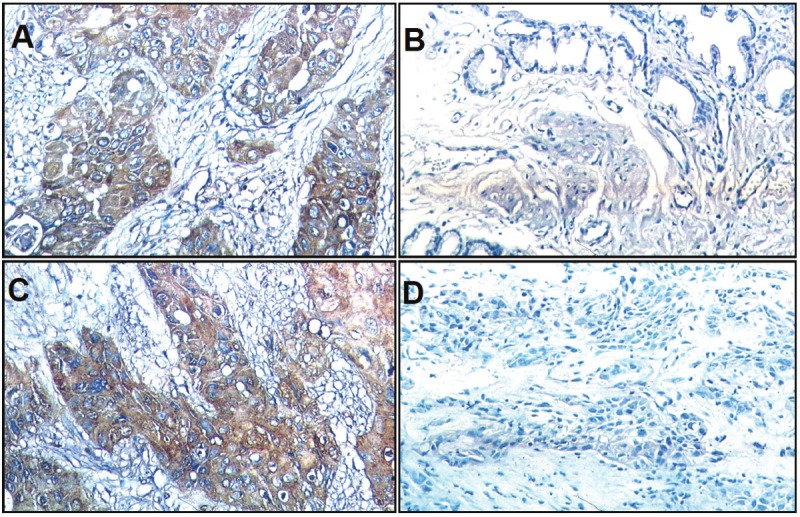
Nectin-2 and DDX3 expression in AC. EnVision immunohistochemistry, original magnification x200. Nectin-2 and DDX3 positive reaction was mainly localized in the cytoplasm. A: Positive Nectin-2 expression in moderatelydifferentiated AC. B: Negative Nectin-2 expression in well differentiated AC. C: Positive DDX3 expression inmoderately differentiated AC. D: Negative DDX3 expression in well differentiated AC.
The association of Nectin-2 and DDX3 expression with clinicopathological characteristics of patients with SC/ASC and AC
As shown in Table 2, the percentage of positive Nectin-2 and DDX3 expression was significantly higher in SC/ASC with large tumor size, high TNM stage, and lymph node metastasis compared to the cases with small tumor size, low TNM stage, and no lymph metastasis (p < 0.05). Both Nectin-2 and DDX3 were not associated with sex, age, degree of differentiation, gallstones, invasion, and surgical curability in SC/ASC.
Table 2.
The association of Nectin-2 and DDX3 expression with the clinicopathological characteristics of SC/ASC
| Clinicopathological characteristics | Total No: | Nectin-2 | DDX3 | ||||
|---|---|---|---|---|---|---|---|
|
| |||||||
| Pos No: (%) | X2 | P | Pos No: (%) | X2 | P | ||
| Sex | |||||||
| male | 19 | 11(57.9) | 0.120 | 0.729 | 10(52.6) | 0.038 | 0.845 |
| female | 27 | 17(63.0) | 15(55.6) | ||||
| Age (years) | |||||||
| ≤45 | 3 | 2(66.7) | 0.045 | 0.831 | 1(33.3) | 0.571 | 0.450 |
| >45 | 43 | 26(60.5) | 24(55.8) | ||||
| Pathological type | |||||||
| SC | 26 | 19(73.1) | 3.741 | 0.053 | 16(61.5) | 1.246 | 0.264 |
| ASC | 20 | 9(45.0) | 9(45.0) | ||||
| Differentiationa | |||||||
| well | 16 | 9(56.3) | 4.453 | 0.108 | 8(50.0) | 2.337 | 0.311 |
| moderately | 24 | 13(54.2) | 12(50.0) | ||||
| poorly | 6 | 6(100.0) | 5(83.3) | ||||
| Tumor mass size | |||||||
| ≤3cm | 20 | 8(40.0) | 6.470 | 0.012 | 7(35.0) | 5.338 | 0.022* |
| >3cm | 26 | 20(76.9) | 18(69.2) | ||||
| Gallstones | |||||||
| no | 18 | 14(77.8) | 3.549 | 0.060 | 9(50.0) | 0.225 | 0.635 |
| yes | 28 | 14(50.0) | 16(57.1) | ||||
| TNM stage | |||||||
| I+II | 12 | 4(33.3) | 7.452 | 0.024 | 4(33.3) | 8.392 | 0.015* |
| III | 20 | 12(60.0) | 9(45.0) | ||||
| IV | 14 | 12(85.7) | 12(85.7) | ||||
| Lymph metastasis | |||||||
| no | 17 | 7(41.2) | 4.391 | 0.036 | 6(35.3) | 3.946 | 0.046* |
| yes | 29 | 21(72.4) | 19(65.5) | ||||
| Invasion | |||||||
| no | 16 | 6(37.5) | 5.625 | 0.019 | 6(37.5) | 2.807 | 0.094 |
| yes | 30 | 22(73.3) | 19(63.3) | ||||
| Surgery | |||||||
| radical | 14 | 6(42.9) | 3.749 | 0.182 | 7(50.0) | 2.464 | 0.292 |
| palliative | 18 | 11(61.1) | 8(44.4) | ||||
| biopsy | 14 | 11(78.6) | 10(71.4) | ||||
aComparison between well differentiated and poorly differentiated SC/ASC: PNectin-2=0.121; PDDX3 =0.333, aComparison between moderately differentiated and poorly differentiated SC/ASC: PNectin-2=0.061; PDDX3 =0.196,
p<0.05.
Pos No.: positive number.
As shown in Table 3, the percentage of positive Nectin-2 and DDX3 expression in AC tumors was significantly higher in the cases with poor differentiation, large tumor mass size, high TNM stage, invasion, and lymph node metastasis as well as no surgical curability compared to the cases with well differentiated tumor, small tumor size, low TNM stage, no invasion, no lymph node metastasis, and having surgical curability (p < 0.05, p < 0.01, or p < 0.001). Significant differences in Nectin-2 and DDX3 expression were observed between well and poorly differentiated SC/ASCs. Only significant difference in Nectin-2 expression was observed between well and poorly differentiated AC.
Table 3.
The association of Nectin-2 and DDX3 expression with the clinicopathological characteristics of AC
| Clinicopathological characteristics | Total No. | Nectin-2 | DDX3 | ||||
|---|---|---|---|---|---|---|---|
|
| |||||||
| Pos No: (%) | X2 | P | Pos No: (%) | X2 | P | ||
| Sex | |||||||
| male | 26 | 19(73.1) | 2.270 | 0.747 | 17(65.4) | 1.678 | 0.195 |
| female | 54 | 30(55.6) | 27(50.0) | ||||
| Age (years) | |||||||
| ≤45 | 16 | 10(62.5) | 0.013 | 0.909 | 7(43.8) | 1.023 | 0.312 |
| >45 | 64 | 39(60.9) | 37(57.8) | ||||
| Differentiationa | |||||||
| well | 27 | 13(48.1) | 8.004 | 0.018 | 10(37.0) | 8.136 | 0.017* |
| moderately | 25 | 13(52.0) | 13(52.0) | ||||
| poorly | 28 | 23(82.1) | 21(75.0) | ||||
| Tumor mass size | |||||||
| ≤3cm | 50 | 25(50.0) | 7.110 | 0.008 | 21(42.0) | 9.104 | 0.003** |
| >3cm | 30 | 24(80.0) | 23(76.7) | ||||
| Gallstones | |||||||
| no | 42 | 25(59.5) | 0.111 | 0.739. | 24(57.1) | 0.164 | 0.685 |
| yes | 38 | 24(63.2) | 20(52.6) | ||||
| TNM stage | |||||||
| I+II | 21 | 8(38.1) | 10.048 | 0.007 | 5(23.8) | 16.256 | <.001 |
| III | 38 | 23(60.5) | 21(55.3) | ||||
| IV | 21 | 18(85.7) | 18(85.7) | ||||
| Lymph metastasis | |||||||
| no | 30 | 14(50.0) | 4.301 | 0.037 | 10(33.3) | 9.104 | 0.003** |
| yes | 50 | 35(68.0) | 34(68.0) | ||||
| Invasion | |||||||
| no | 31 | 13(41.9) | 7.955 | 0.005 | 10(32.3) | 10.576 | 0.001** |
| yes | 49 | 36(73.5) | 34(69.4) | ||||
| Surgery | |||||||
| radical | 26 | 11(42.3) | 8.104 | 0.017 | 9(34.6) | 11.611 | 0.003** |
| palliative | 28 | 17(60.7) | 14(50.0) | ||||
| biopsy | 26 | 21(80.8) | 21(80.8) | ||||
aComparison between well differentiated and poorly differentiated AC: PNectin-2=0.008; PDDX3=0.005, aComparison between moderately differentiated and poorly differentiated AC: PNectin-2=0.019; PDDX3=0.081, Pos No.: positive number.
p<0.05,
p<0.01.
The correlation between Nectin-2 or DDX3 expression with survival in patients with SC/ASC and AC
The survival information was collected for a period of 2 years. Among the 46 SC/ASC patients, 33 patients survived shorter than 1 year and 13 patients survived longer than 1 year (4 cases survived longer than 2 years) with an average survival time of 10.07 ± 0.78 months. Among the 80 Ac patients, 57 patients survived shorter than 1 year. and 23 patients survived longer than 1 year (9 cases survived longer than 2 years) with an average survival time of 10.34 ± 0.63 months. There was no significant difference in post-operative survival time between SC/ASC and AC patients.
The Kaplan-Meier survival analysis in SC/ASC patients revealed that differentiation, tumor size, TNM stage, lymph node metastasis, invasion and surgical curability were also significantly associated with the average survival time (p < 0.001) (Table 4). The average survival time in Nectin-2 and DDX3 positive patients was significantly shorter than patients having negative Nectin-2 (p < 0.001) and DDX3 expression (p = 0.003) (Table 4, Figure 3). Cox multivariate analysis showed that the Nectin-2- and DDX3-positive expression, degree of differentiation, tumor size (≥ 3cm), TNM stage, invasion, and no surgical curability were negatively correlated with overall survival, suggesting that they are independent risk factors of SC/ASC patients (Table 5).
Table 4.
Relationship between Nectin-2 and DDX3 expression, clinicopathological characteristics and average survival of SC/ASC patients
| C.P Characteristics | Samples(n) | Average survival (month) | Chi-square | P value |
|---|---|---|---|---|
| Sex | ||||
| male | 19 | 10.74(6-24) | 0.767 | 0.381 |
| female | 27 | 9.85(4-24) | ||
| Age (years) | ||||
| ≤45 | 3 | 15.67(8-24) | 2.023 | 0.155 |
| >45 | 43 | 9.84(4-25) | ||
| Pathological type | ||||
| SC | 26 | 10.19(4-24) | 0.223 | 0.637 |
| ASC | 20 | 10.25(4-24) | ||
| Differentiation | ||||
| well | 16 | 13.81(5-24) | 19.125 | <.001 |
| moderately | 24 | 8.92(4-18) | ||
| poorly | 6 | 5.83(4-9) | ||
| Tumor mass size | ||||
| ≤3cm | 20 | 14.35(7-24) | 31.337 | <.001 |
| >3cm | 26 | 7.04(4-11) | ||
| Gallstones | ||||
| no | 18 | 8.22(4-12) | 3.730 | 0.053 |
| yes | 28 | 11.50(4-24) | ||
| TNM stage | ||||
| I+II | 12 | 17.00(9-24) | 51.139 | <.001 |
| III | 20 | 9.20(7-15) | ||
| IV | 14 | 5.86(4-8) | ||
| Lymph node metastasis | ||||
| no | 17 | 14.24(4-24) | 16.219 | <.001 |
| yes | 29 | 7.86(4-15) | ||
| Invasion | ||||
| no | 16 | 15.75(9-24) | 32.271 | <.001 |
| yes | 30 | 7.27(4-12) | ||
| Operative procedure | ||||
| radical | 14 | 16.64(10-24) | 50.165 | <.001 |
| palliative | 18 | 8.50(6-12) | ||
| biopsy | 14 | 6.00(4-8) | ||
| Nectin-2 | ||||
| - | 18 | 14.06(7-24) | 15.202 | <.001 |
| + | 28 | 7.75(4-15) | ||
| DDX3 | ||||
| - | 21 | 12.86(5-24) | 9.108 | 0.003** |
| + | 25 | 8.00(4-15) |
C.P: clinicopathological.
p<0.01.
Figure 3.
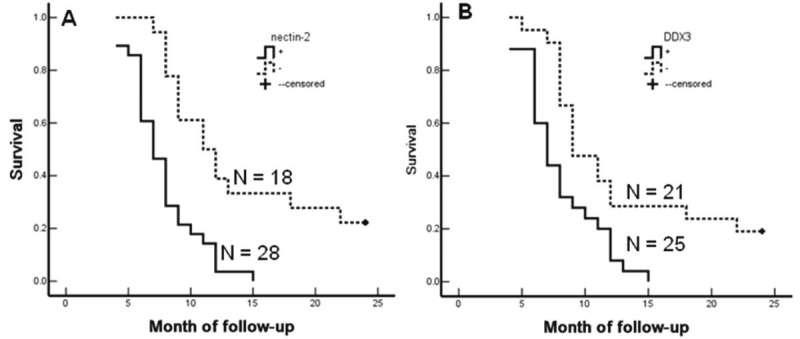
Nectin-2 and DDX3 expression and survival in patients with SC/ASC of gallbladder. A: Kaplan-Meier plots of overall survival in patients with SC/ASC and with Nectin-2 positive and negative expression. B: Kaplan-Meier plots of overall survival in patients with SC/ASC and with DDX3 positive and negative expression.
Table 5.
Multivariate Cox regression analysis of survival rate in SC/ASC patients
| Groups | factors | RC | SE | wald | P | RR | 95% CI | |
|---|---|---|---|---|---|---|---|---|
|
| ||||||||
| Lower | Upper | |||||||
| Pathological types | SC/ASC | .229 | .352 | .423 | .515 | 1.257 | .631 | 2.507 |
| Differentiation | well/moderately/poorly | .891 | .366 | 5.926 | .015* | 2.438 | 1.190 | 4.995 |
| Tumor mass size | ≤3cm/>3cm | 2.617 | .771 | 11.521 | .001** | 13.695 | 3.022 | 62.064 |
| Gallstones | no/yes | .725 | .487 | 2.216 | .137 | 2.065 | .795 | 5.363 |
| TNM stage | I+II/III/IV | 1.186 | .446 | 7.071 | .008** | 3.274 | 1.366 | 7.847 |
| Lymph | metastasis no/yes | 1.250 | .530 | 5.562 | .018 | 3.490 | 1.235 | 9.863 |
| Invasion | no/yes | 2.775 | .861 | 10.388 | .001** | 16.039 | 2.967 | 86.709 |
| Surgery | radical/palliative/biopsy | 1.140 | .545 | 4.375 | .036* | 3.127 | 1.074 | 9.099 |
| Nectin-2 | -/+ | 1.104 | .484 | 5.203 | .023* | 3.016 | 1.168 | 7.788 |
| DDX3 | -/+ | 1.091 | .518 | 4.436 | .035* | 2.977 | 1.079 | 8.218 |
RC: Regression coefficients; SE: standard error; RR: Relative risk; CI: confidence interval.
p<0.05,
p<0.01.
The Kaplan-Meier survival analysis and Cox multivariate analysis in AC patients revealed similar results as SC/ASC patients (Table 6). The average survival time of Nectin-2 or DDX3 positive AC patients was significantly lower than patients with negative Nectin-2 or DDX3 expression (p < 0.001) (Table 6, Figure 4). Nectin-2- and DDX3-positive expression, degree of differentiation, tumor size (≥ 3cm), TNM stage, invasion, and no surgical curability were negatively correlated with survival, suggesting that they are independent risk factors of AC patients (Table 7).
Table 6.
Relationship between Nectin-2 and DDX3 expression, clinicopathological characteristics and average survival of AC patients
| C.P characteristics | Samples(n) | Average survival (month) | Chi-square | P value |
|---|---|---|---|---|
| Sex | ||||
| male | 26 | 9.58(3-24) | 2.567 | 0.109 |
| female | 54 | 11.30(3-24) | ||
| Age (years) | ||||
| ≤45 | 16 | 10.81(4-24) | 0.003 | 0.956 |
| >45 | 64 | 10.72(3-24) | ||
| Differentiation | ||||
| well | 27 | 15.07(5-24) | 32.501 | <.001 |
| moderately | 25 | 10.60(4-24) | ||
| poorly | 28 | 6.68(3-14) | ||
| Tumor mass size | ||||
| ≤3cm | 50 | 13.70(6-24) | 68.283 | <.001 |
| >3cm | 30 | 5.80(3-10) | ||
| Gallstones | ||||
| no | 42 | 10.19(3-24) | 0.246 | 0.620 |
| yes | 38 | 11.34(4-24) | ||
| TNM stage | ||||
| I+II | 21 | 18.96(5-24) | 105.825 | <.001 |
| III | 38 | 9.29(6-15) | ||
| IV | 21 | 5.14(3-7) | ||
| Lymph node metastasis | ||||
| no | 30 | 16.27(4-24) | 42.372 | <.001 |
| yes | 50 | 7.42(3-14) | ||
| Invasion | ||||
| no | 31 | 16.68(7-24) | 55.535 | <.001 |
| yes | 49 | 6.98(3-11) | ||
| Operative procedure | ||||
| radical | 26 | 18.31(10-24) | 113.141 | <.001 |
| palliative | 28 | 8.64(6-11) | ||
| biopsy | 26 | 5.42(3-9) | ||
| Nectin-2 | ||||
| - | 31 | 14.32(6-24) | 16.673 | <.001 |
| + | 49 | 8.47(3-24) | ||
| DDX3 | ||||
| - | 36 | 14.72(5-24) | 32.253 | <.001 |
| + | 44 | 7.48(3-19) |
C.P: clinicopathological.
Figure 4.
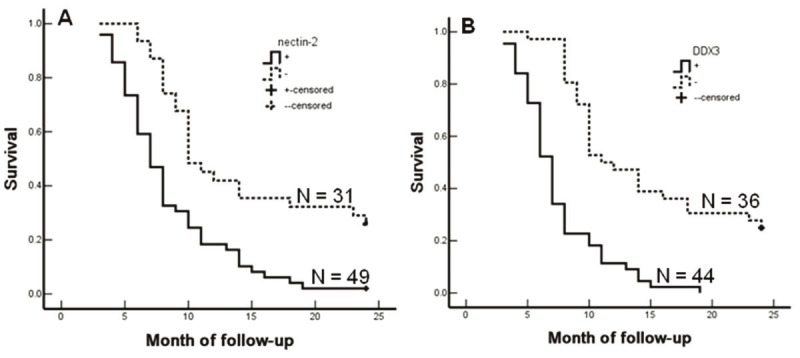
Nectin-2 and DDX3 expression and survival in patients with AC of gallbladder. A: Kaplan-Meier plots of overall survival in patients with AC and with Nectin-2 positive and negative expression. B: Kaplan-Meier plots of overall survival in patients with AC and with DDX3 positive and negative expression.
Table 7.
Multivariate Cox regression analysis of survival rate in AC patients
| Groups | factors | RC | SE | wald | P | RR | 95% CI | |
|---|---|---|---|---|---|---|---|---|
|
| ||||||||
| Lower | Upper | |||||||
| Differentiation | well/moderately/poorly | 1.010 | .457 | 4.884 | .027* | 2.746 | 1.121 | 6.724 |
| Tumor mass size | ≤3cm/>3cm | 1.082 | .412 | 6.897 | .009** | 2.951 | 1.316 | 6.616 |
| Gallstone | no/yes | .148 | .246 | .362 | .547 | 1.160 | .716 | 1.878 |
| TNM stage | I+II/III/IV | 1.268 | .413 | 9.426 | .002 | 3.554 | 1.582 | 7.984 |
| Lymph metastasis | no/yes | 1.187 | .492 | 5.821 | .016* | 3.277 | 1.249 | 8.596 |
| Invasion | no/yes | 1.369 | .520 | 6.931 | .008** | 3.931 | 1.419 | 10.894 |
| Surgery | radical/palliative/biopsy | 1.635 | .417 | 15.373 | <.001 | 5.129 | 2.265 | 11.615 |
| Nectin-2 | -/+ | .980 | .320 | 9.379 | .002** | 2.664 | 1.423 | 4.989 |
| DDX3 | -/+ | .838 | .360 | 5.419 | .020* | 2.312 | 1.142 | 4.681 |
RC: Regression coefficients; SE: standard error; RR: Relative risk; CI: confidence interval.
Discussion
In this study, the clinicopathological characteristics of AC and SC/ASC were comparatively analyzed with an extensive collection of SC/ASC samples. Inconsistent with previous reports, different conclusions on the aggressiveness, metastasis, and prognosis of SC/ASC were obtained. The expression of Nectin-2 and DDX3 were measured and their associations with the prognosis and clinicopathological characteristics were analyzed. The roles of Nectin-2 and DDX3 as biomarkers for invasion, metastasis, and prognosis of AC and SC/ASC were highlighted.
It is well known that many cell adhesion molecules function as tumor suppressors mainly through cell-adhesion-mediated contact inhibition and the inhibition of cell motility. However, there is emerging evidence currently that supports the contradictory roles of cell adhesion molecules that both inhibit cell growth and promote cell motility. For example, cell adhesion molecules belonging to the immunoglobulin superfamily are implicated to function as tumor suppressors and metastasis promoters [10]. Nectins are immunoglobulin-like cell adhesion molecules that have recently been demonstrated to play key roles in cell-cell adhesions [13]. However, Nectins also exhibit functions in tumor cell differentiation, movement, proliferation and survival [14]. In this study, positive Nectin-2 expression was significantly increased in AC and SC/ASC patients with invasion and metastasis. It seems that loss of cell adhesion is necessary for tumor cells to acquire their invasive abilities while expression of adhesion molecules on the surface of tumor cells is required to establish metastatic foci at the secondary site [10-12]. Therefore, the role of Nectin-2 in invasion and metastasis of AC and SC/ASC cannot be fully explained by its role as an adhesion molecule. The significant association between positive Nectin-2 expression and large tumor size and high TNM stage in AC and SC/ASC suggested that Nectin-2 plays roles in tumor cell proliferation and/or apoptosis in these tumors. Nectin-2 expression was also significantly associated with poor differentiation in AC, but not SC/ASC. Importantly, high Nectin-2 expression significantly correlated with shorter patient survival. Thus, in AC and SC/ASC, Nectin-2 may mainly function as a proliferative and survival factor, contributing to tumor cell invasion, metastasis, and prognosis.
Recent reports indicate that overexpression of DDX3 down-regulates E-cadherin expression and enhances epithelial mesenchymal transition [22]. In this study, the percentage of DDX3 positive expression was significantly higher in AC and SC/ASC patients with metastasis and in AC patients with invasion than in patients without metastasis or invasion. This observation suggests that DDX3 increased epithelial mesenchymal transition in AC/ASC. DDX3 has also been revealed to contribute to cancer progression through regulation of a diverse set of genes involved in apoptosis and cellular transformation [24]. Our study demonstrated that positive DDX3 expression was significantly associated with large tumor size and high TNM stage, suggesting that DDX3 may function as an anti-apoptotic protein and/or a promoter of cellular transformation. The association of high DDX3 expression with shorter survival time in AC and SC/ASC patients suggests that DDX3 contributed to the cancer progression. DDX3 expression was also significantly associated with poor differentiation in AC, but not in SC/ASC. Thus, in AC and SC/ASC, DDX3 may mainly function as an inhibitor of adhesion molecules to promote cell motility as well as an enhancer of tumor cell proliferation and survival. Although both Nectin-2 and DDX3 expression were only significantly associated with differentiation in AC, they exhibited highly similar correlations with other clinicopathological characteristics between AC and SC/ASC. This suggests that AC and SC/ASC may have similar biological characteristics.
Previous studies suggested that squamous carcinoma proliferates at a higher rate than adenocarcinoma, but squamous tumors are less frequently present with lymph node metastasis [28,29]. Our observation revealed no differences in invasion or lymph node metastasis between AC and SC/ASC although more SC/ASC patients had large tumor size. Also, there were no significant differences in differentiation, TNM stage, surgical curability, and postoperative survival time between AC (10.34 ± 0.63 months) and SC/ASC (10.07 ± 0.78 months) patients. These observations implicated that squamous differentiation is no more aggressive than glandular differentiation in the gallbladder. We also observed that radical resection is a good prognosis factor in patients with AC and SC/ASC. However, 86% of SC/ASC and 74% of AC patients were diagnosed at an inoperable stage. Inconsistent with previous report that SC/ASC occurs predominantly in females (F/M = 3.8) [6], our observations demonstrated that SC/ASC occurred with no significant difference between females and males (F/M ratio is only 1.4), but SC/ASC did occur significantly more in older patients than AC. Consistent with previous reports [2,6], we observed a percentage of 4.34% SC/ASC in GBCs. These observations suggested that the clinicopathological presentation of SC/ASC did not seem to be significantly different from the ordinary AC. The current knowledge on the clinicopathological characteristics of SC/ASC is mainly gained from individual case reports or analysis of small case series. Our study therefore provides more accurate information on the differences between the rare SC/ASC subtype and typical adenocarcinomas.
Our study demonstrated that high Nectin-2 and DDX3 expression is associated with the aggressiveness and poor prognosis of AC and SC/ASC. This suggested that either Nectin-2 or DDX3 could be diagnostic or prognostic markers for AC and SC/ASC as well as targets for the gene therapy of AC and SC/ASC.
Conflict of interest statement
All authors declared no conflict of interest.
References
- 1.Jemal A, Siegel R, Ward E, Hao Y, Xu J, Murray T, Thun MJ. Cancer statistics 2008. CA Cancer J Clin. 2008;58:71–96. doi: 10.3322/CA.2007.0010. [DOI] [PubMed] [Google Scholar]
- 2.Jayaraman S, Jarnagin WR. Management of gallbladder cancer. Gastroenterol Clin North Am. 2010;39:331–342. doi: 10.1016/j.gtc.2010.02.006. [DOI] [PubMed] [Google Scholar]
- 3.Reid KM, Ramos-De la Medina A, Donohue JH. Diagnosis and surgical management of gallbladder cancer: a review. J Gastrointest Surg. 2007;11:671–81. doi: 10.1007/s11605-006-0075-x. [DOI] [PubMed] [Google Scholar]
- 4.Hawkins WG, DeMatteo RP, Jarnagin WR, Ben-Porat L, Blumgart LH, Fong Y. Jaundice predicts advanced disease and early mortality in patients with gallbladder cancer. Ann Surg Oncol. 2004;11:310–315. doi: 10.1245/aso.2004.03.011. [DOI] [PubMed] [Google Scholar]
- 5.Ootani T, Shirai Y, Tsukada K, Muto T. Relationship between gallbladder carcinoma and the segmental type of adenomyomatosis of the gallbladder. Cancer. 1992;69:2647–52. doi: 10.1002/1097-0142(19920601)69:11<2647::aid-cncr2820691105>3.0.co;2-0. [DOI] [PubMed] [Google Scholar]
- 6.Roa JC, Tapia O, Cakir A, Basturk O, Dursun N, Akdemir D, Saka B, Losada H, Bagci P, Adsay NV. Squamous cell and adenosquamous carcinomas of the gallbladder: clinicopathological analysis of 34 cases identified in 606 carcinomas. Mod Pathol. 2011;24:1069–78. doi: 10.1038/modpathol.2011.68. [DOI] [PubMed] [Google Scholar]
- 7.Park SB, Kim YH, Rho HL, Chae GB, Hong SK. Primary carcinosarcoma of the gallbladder. J Korean Surg Soc. 2012;82:54–8. doi: 10.4174/jkss.2012.82.1.54. [DOI] [PMC free article] [PubMed] [Google Scholar]
- 8.Liu DC, Yang ZL. MTDH and EphA7 are markers for metastasis and poor prognosis of gallbladder adenocarcinoma. Diagn Cytopathol. 2011 Sep 30; doi: 10.1002/dc.21821. doi: 10.1002/dc.21821. [DOI] [PubMed] [Google Scholar]
- 9.Iiizumi M, Liu W, Pai SK, Furuta E, Watabe K. Drug development against metastasis-related genes and their pathways: a rationale for cancer therapy. Biochim Biophys Acta. 2008;1786:87–104. doi: 10.1016/j.bbcan.2008.07.002. [DOI] [PMC free article] [PubMed] [Google Scholar]
- 10.Moh MC, Shen S. The roles of cell adhesion molecules in tumor suppression and cell migration: a new paradox. Cell Adh Migr. 2009;3:334–6. doi: 10.4161/cam.3.4.9246. [DOI] [PMC free article] [PubMed] [Google Scholar]
- 11.Chambers AF, Groom AC, MacDonald IC. Dissemination and growth of cancer cells in metastatic sites. Nat Rev Cancer. 2002;2:563–572. doi: 10.1038/nrc865. [DOI] [PubMed] [Google Scholar]
- 12.Brown DM, Ruoslahti E. Metadherin, a cell surface protein in breast tumors that mediates lung metastasis. Cancer Cell. 2004;5:365–374. doi: 10.1016/s1535-6108(04)00079-0. [DOI] [PubMed] [Google Scholar]
- 13.Miyoshi J, Takai Y. Nectin and nectin-like molecules: biology and pathology. Am J Nephrol. 2007;27:590–604. doi: 10.1159/000108103. [DOI] [PubMed] [Google Scholar]
- 14.Takai Y, Miyoshi J, Ikeda W, Ogita H. Nectins and nectin-like molecules: roles in contact inhibition of cell movement and proliferation. Nat Rev Mol Cell Biol. 2008;9:603–15. doi: 10.1038/nrm2457. [DOI] [PubMed] [Google Scholar]
- 15.Sakisaka T, Takai Y. Biology and pathology of nectins and nectin-like molecules. Curr Opin Cell Biol. 2004;16:513–21. doi: 10.1016/j.ceb.2004.07.007. [DOI] [PubMed] [Google Scholar]
- 16.Matsushima H, Utani A, Endo H, Matsuura H, Kakuta M, Nakamura Y, Matsuyoshi N, Matsui C, Nakanishi H, Takai Y, Shinkai H. The expression of nectin-1alpha in normal human skin and various skin tumours. Br J Dermatol. 2003;148:755–62. doi: 10.1046/j.1365-2133.2003.05225.x. [DOI] [PubMed] [Google Scholar]
- 17.Guzman G, Oh S, Shukla D, Valyi-Nagy T. Nectin-1 expression in the normal and neoplastic human uterine cervix. Arch Pathol Lab Med. 2006;130:1193–5. doi: 10.5858/2006-130-1193-NEITNA. [DOI] [PubMed] [Google Scholar]
- 18.Yu Z, Chan MK, O-charoenrat P, Eisenberg DP, Shah JP, Singh B, Fong Y, Wong RJ. Enhanced nectin-1 expression and herpes oncolytic sensitivity in highly migratory and invasive carcinoma. Clin Cancer Res. 2005;11:4889–97. doi: 10.1158/1078-0432.CCR-05-0309. [DOI] [PubMed] [Google Scholar]
- 19.Pende D, Spaggiari GM, Marcenaro S, Martini S, Rivera P, Capobianco A, Falco M, Lanino E, Pierri I, Zambello R, Bacigalupo A, Mingari MC, Moretta A, Moretta L. Analysis of the receptor-ligand interactions in the natural killer-mediated lysis of freshly isolated myeloid or lymphoblastic leukemias: evidence for the involvement of the Poliovirus receptor (CD155) and Nectin-2 (CD112) Blood. 2005;105:2066–73. doi: 10.1182/blood-2004-09-3548. [DOI] [PubMed] [Google Scholar]
- 20.Sanchez-Correa B, Gayoso I, Bergua JM, Casado JG, Morgado S, Solana R, Tarazona R. Decreased expression of DNAM-1 on NK cells from acute myeloid leukemia patients. Immunol Cell Biol. 2012;90:109–15. doi: 10.1038/icb.2011.15. [DOI] [PubMed] [Google Scholar]
- 21.El-Sherbiny YM, Meade JL, Holmes TD, McGonagle D, Mackie SL, Morgan AW, Cook G, Feyler S, Richards SJ, Davies FE, Morgan GJ, Cook GP. The requirement for DNAM-1, NKG2D, and NKp46 in the natural killer cell-mediated killing of myeloma cells. Cancer Res. 2007;67:8444–9. doi: 10.1158/0008-5472.CAN-06-4230. [DOI] [PubMed] [Google Scholar]
- 22.Botlagunta M, Krishnamachary B, Vesuna F, Winnard PT Jr, Bol GM, Patel AH, Raman V. Expression of DDX3 is directly modulated by hypoxia inducible factor-1 alpha in breast epithelial cells. PLoS One. 2011;6:e17563. doi: 10.1371/journal.pone.0017563. [DOI] [PMC free article] [PubMed] [Google Scholar]
- 23.Botlagunta M, Vesuna F, Mironchik Y, Raman A, Lisok A, Winnard P Jr, Mukadam S, Van Diest P, Chen JH, Farabaugh P, Patel AH, Raman V. Oncogenic role of DDX3 in breast cancer biogenesis. Oncogene. 2008;27:3912–22. doi: 10.1038/onc.2008.33. [DOI] [PMC free article] [PubMed] [Google Scholar]
- 24.Schroder M. Human DEAD-box protein 3 has multiple functions in gene regulation and cell cycle control and is a prime target for viral manipulation. Biochem Pharmacol. 2010;79:297–306. doi: 10.1016/j.bcp.2009.08.032. [DOI] [PubMed] [Google Scholar]
- 25.Huang JS, Chao CC, Su TL, Yeh SH, Chen DS, Chen CT, Chen PJ, Jou YS. Diverse cellular transformation capability of overexpressed genes in human hepatocellular carcinoma. Biochem Biophys Res Commun. 2004;315:950–958. doi: 10.1016/j.bbrc.2004.01.151. [DOI] [PubMed] [Google Scholar]
- 26.Sun M, Song L, Li Y, Zhou T, Jope RS. Identification of an antiapoptotic protein complex at death receptors. Cell Death Differ. 2008;15:1887–900. doi: 10.1038/cdd.2008.124. [DOI] [PMC free article] [PubMed] [Google Scholar]
- 27.Chang PC, Chi CW, Chau GY, Li FY, Tsai YH, Wu JC, Wu Lee YH. DDX3, a DEAD box RNA helicase, is deregulated in hepatitis virus-associated hepatocellular carcinoma and is involved in cell growth control. Oncogene. 2006;25:1991–2003. doi: 10.1038/sj.onc.1209239. [DOI] [PubMed] [Google Scholar]
- 28.Nishihara K, Nagai E, Izumi Y, Yamaguchi K, Tsuneyoshi M. Adenosquamous carcinoma of the gallbladder: a clinicopathological, immunohistochemical and flow-cytometric study of twenty cases. Jpn J Cancer Res. 1994;85:389–399. doi: 10.1111/j.1349-7006.1994.tb02372.x. [DOI] [PMC free article] [PubMed] [Google Scholar]
- 29.Kondo M, Dono K, Sakon M, Shimizu J, Nagano H, Nakamori S, Umeshita K, Wakasa K, Monden M. Adenosquamous carcinoma of the gallbladder. Hepatogastroenterology. 2002;49:1230–1234. [PubMed] [Google Scholar]