

Abstract
Objective
This study addressed two questions: (1) What fraction of individuals maintain a sustained high HIV-1 RNA load after the acute HIV-1C infection peak? and (2) How long is a high HIV-1 RNA load maintained after acute HIV-1C infection in this subpopulation?
Design/Methods
Plasma HIV-1 RNA dynamics were studied in 77 subjects with primary HIV-1C infection from African cohorts in Gaborone, Botswana, and Durban, South Africa. HIV-infected individuals who maintained mean viral load of ≥ 100,000 (5.0 log10) copies/ml after 100 days post-seroconversion (p/s) were termed Extended High Viremics. Individuals were followed longitudinally for a median (IQR) of 573 (226;986) days p/s.
Results
The proportion of Extended High Viremics was 34% (95% CI: 23%–44%) during the period 100 to 300 days p/s and 19% (95% CI: 9%–29%) over the period of 200 to 400 days p/s. The median (IQR) duration of HIV-1 RNA load ≥ 100,000 copies/ml among Extended High Viremics was 271 (188;340) days p/s. For the subset with average viral load ≥ 100,000 copies/ml during 200–400 days p/s, the median (IQR) duration was 318 (282;459) days. The Extended High Viremics had a significantly shorter time to CD4 decline to 350 cells/μl (median: 88 vs. 691 days p/s for those not designated as Extended High Viremics; p<0.0001, Gehan-Wilcoxon test).
Conclusions
A high proportion of Extended High Viremics – individuals maintaining high plasma HIV-1 RNA load after acute infection – has been identified during primary HIV-1 subtype C infection. These Extended High Viremics likely contribute disproportionately to HIV-1 incidence.
Keywords: HIV-1 subtype C, primary infection, viral HIV-1 RNA load, Southern Africa, HIV-1 transmission
Introduction
Previous studies on viral dynamics during primary HIV-1 subtype B infection [1-9], showed that soon after infection peak HIV-1 RNA levels reach 105 to 108 copies/ml [6, 10, 11], last approximately two to three weeks [2, 3, 12], and then drop to a median of around 30,000 copies/ml within four to six months after infection [1, 5, 7, 8]. The rate of decline [3] and levels [5] of HIV-1 RNA in plasma vary substantially among HIV-infected individuals, and initial clearance of HIV-1 RNA can affect disease progression [9, 13]. HIV-1 dynamics in the early phase of non-B subtype infections are generally similar to the patterns observed during primary HIV-1 subtype B infection, although some subtype-specific differences were reported [14-17]. HIV-1 subtype C isolates were shown to have transmission efficiency similar to that of other group M HIV-1 viruses, but reduced pathogenic fitness following initial infection [18, 19].
The risk of HIV-1 transmission is associated with levels of HIV-1 RNA load in plasma and semen [16, 20-26]. Two reports described incremental increases for HIV-1 RNA load level linked to increased viral transmission. In one study [27] a 0.5 log10 increase in viral load correlated with a 40% increase in transmission. In the other study [22], a 0.74 log10 increase correlated with a 50% greater risk of viral transmission. Recently we proposed that HIV-1-infected individuals who maintain high levels of HIV-1 RNA load after seroconversion may be an important target for public health interventions for reducing viral transmission in communities [28].
The current study addressed two questions: (1) What is the fraction of individuals with sustained high HIV-1 RNA load during primary HIV-1 infection after the viremia peak? and (2) How long is the high HIV-1 RNA load maintained during primary HIV-1 infection? Because the highest rates of HIV infection are for subtype C in southern Africa, we chose to study HIV-1 RNA dynamics in 77 subjects with primary HIV-1 infection in Gaborone, Botswana (n= 42), and Durban, South Africa (n=35).
Methods
Study subjects
Data from two southern African cohorts were analyzed in this study, from the HIV Pathogenesis Programme Acute Infection Study in Durban, KwaZulu-Natal, South Africa (Durban cohort; n=35) [29], and the Tshedimoso Study in Gaborone, Botswana (Botswana cohort; n=42) [17, 30]. In both cohorts, individuals seeking voluntarily testing and counseling for HIV infection were targeted. Written informed consent was obtained from each participant. The time of seroconversion was estimated based on the laboratory results of HIV-1 RNA test, ELISA test for HIV antibodies, and Western blot test, either as the midpoint between the last ELISA-negative and the first ELISA-positive test (n=35), or according to Fiebig staging [4] (n= 42; see details on Fiebig stage assignment in [31]). The uncertainty in the estimated time of seroconversion may affect the analysis of viral load and CD4 dynamics. The cumulative 95% CI of Fiebig stages II–IV spans from 7 to 8 days per stage, which provides relatively tight and accurate estimation. In contrast, the cumulative 95% CI for Fiebig stage V is expanded to 83 days, leaving more uncertainty in synchronization of individuals identified within this stage, which is a limitation of the study. A total of 77 study participants with estimated time of seroconversion and measurements of HIV-1 RNA load between 100 and 300 days post-seroconversion (p/s) were included in the analysis, including 35 acutely (27 from the Durban cohort and 8 from the Botswana cohort) and 42 recently (8 from the Durban cohort and 34 from the Botswana cohort) infected individuals. Plasma HIV-1 RNA load was quantified by the COBAS Taqman or the COBAS Ampli-Prep/COBAS AMPLICOR HIV-1 Monitor Test, version 1.5, for participants in the Durban and Botswana cohorts, respectively, according to the manufacturer's instructions. Individual curves of HIV-1 RNA load are presented as Supplemental Digital Content 1 (Figures S1–S2). CD4 count measurements were obtained by flow cytometry in both cohorts. Individual curves of CD4 trajectories are presented as Supplemental Digital Content 2 (Figures S3–S4). Only pre-HAART HIV-1 RNA load and CD4 data were used in the analysis. Participants in both the Durban and Botswana cohorts demonstrated comparable values of pre-HAART HIV-1 RNA load and CD4 counts. Individuals in combined cohorts were followed longitudinally for a median (IQR) of 573 (226; 986) days p/s (pre-HAART data). All study subjects were infected by HIV-1 subtype C [17, 29, 32].
Statistical analysis
Descriptive statistics (mean and accompanying 95% confidence intervals, median and corresponding inter-quartile range) were presented. Comparisons of continuous outcomes between two groups were based on the Mann-Whitney Rank Sum test. Comparisons of time-to-event outcomes between two groups were based on the Gehan-Wilcoxon test. The normality of distribution of HIV-1 RNA load was tested by the Shapiro-Wilk test.
For the purpose of analysis in this study we coined the term Extended High Viremics to refer to HIV-infected individuals maintaining mean viral load ≥ 100,000 (5.0 log10) copies/ml during 100–300 days p/s. HIV-infected individuals with mean viral load < 100,000 (5.0 log10) copies/ml during 100–300 days were referred to as “others”. For Extended High Viremics, we estimated the duration of high viral load in the absence of ART using cubic smoothing splines for those with more than 5 data points, and ordinary least squares regression for those with fewer data points. For individuals with increasing HIV-1 RNA levels, the duration of high viral load was imputed as the time from seroconversion to the last observation prior to ART initiation. Selection biases cannot be completely excluded, although a relatively large number of screened individuals (cumulative total is more than 10,000) implies that selection bias is unlikely to be a major issue.
To describe the procedure for estimating the probability of viral load higher than a threshold over time, we introduce some notation: Let T denote the time since seroconversion (in days), Y(t) (log10, copies/ml) denote viral load value at time T=t, and s denote a threshold. We assume that Y(t) follows a normal distribution with mean μ(t) and variance σ2. Under this assumption, the probability of viral load higher than a threshold s at time t, Pr(Y(t)≥s|t), is equal to Φ{[μ(t)-s]/ σ}, where Φ(·) is the cumulative distribution function for the standard normal random variable. We estimate μ(t) and σ using local regression models. Confidence intervals for Pr(Y(t)≥s|t) were derived using the bootstrap method. All reported p-values are 2-sided and not adjusted for multiple comparisons.
Results
Extended High Viremics: Individuals with sustained high HIV-1 RNA load
The cumulative HIV-1 RNA load data are presented in Figure 1. The fraction of Extended High Viremics, HIV-infected individuals who maintained mean viral load of ≥ 100,000 (5.0 log10) copies/ml after 100 days p/s, in the cohorts was calculated over two overlapping time periods, 100–300 and 200–400 days p/s. The median (IQR) number of viral load measurements per individual was 4 (2; 6) for both time intervals.
Figure 1.
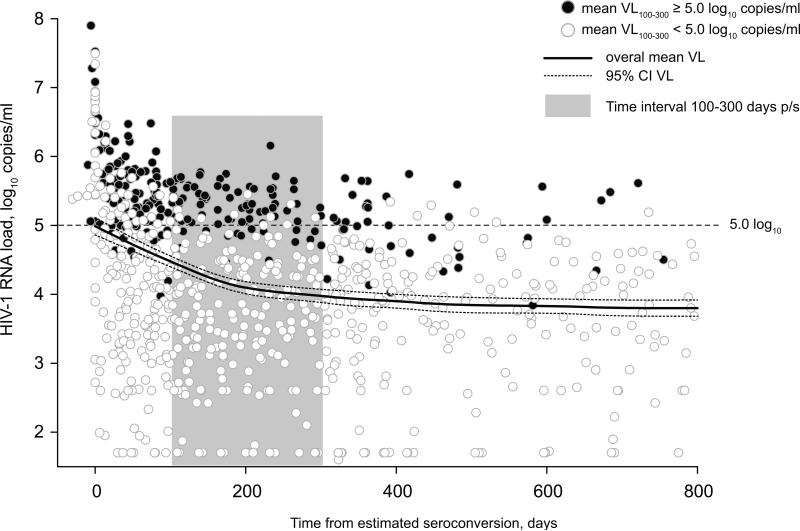
Dynamics of HIV-1 RNA load in primary HIV-1 subtype C infection, n=75, pre-HAART data. Time from estimated seroconversion is shown on the x axis. HIV-1 RNA load is shown on the y axis, and the 100,000 (5.0 log10) copies/ml level highlighted by the dashed line. Individuals with mean HIV-1 RNA load ≥ 100,000 (5.0 log10) copies/ml during the period 100–300 days p/s (shaded by gray) were termed Extended High Viremics. The HIV-1 RNA measurements of Extended High Viremics are denoted by shaded circles. The HIV-1 RNA measurements of others are denoted by open circles. Viral load dynamics in primary HIV-1 subtype C infection are indicated by the overall mean HIV-1 RNA load (solid curve) with 95% confidence intervals (dashed curves).
The distribution of HIV-1 RNA load in the analyzed cohorts during the two time intervals was not normal (Figure 2). The normality test (Shapiro-Wilk) failed for both time intervals 100–300 and 200–400 days p/s (p<0.001 and p=0.034, respectively) indicating that the viral load data deviated from the pattern expected from a normal distribution. A disproportionately large fraction of Extended High Viremics was the most likely reason contributing to the non-normal distribution of HIV-1 RNA load data. Despite individual fluctuations, HIV-1 RNA load in Extended High Viremics was relatively consistent over time (Figure 3). This was evident from the predominantly horizontal shape of viral load curves in Extended High Viremics (dark lines in Figure 3), providing information on the evolution and variance of viral load trajectories during the first year of HIV-1 subtype C infection including the selected time intervals. The cumulative proportion of Extended High Viremics was 34% (95% CI: 23–44%) during the period 100–300 days p/s and 19% (95% CI: 9–29%) over the period 200–400 days p/s. The overall estimates were consistent with proportions of Extended High Viremics within each cohort: 34% (95% CI: 19–50%) in the Durban cohort and 33% (95% CI: 19–48%) in the Botswana cohort during the period 100–300 days p/s.
Figure 2.
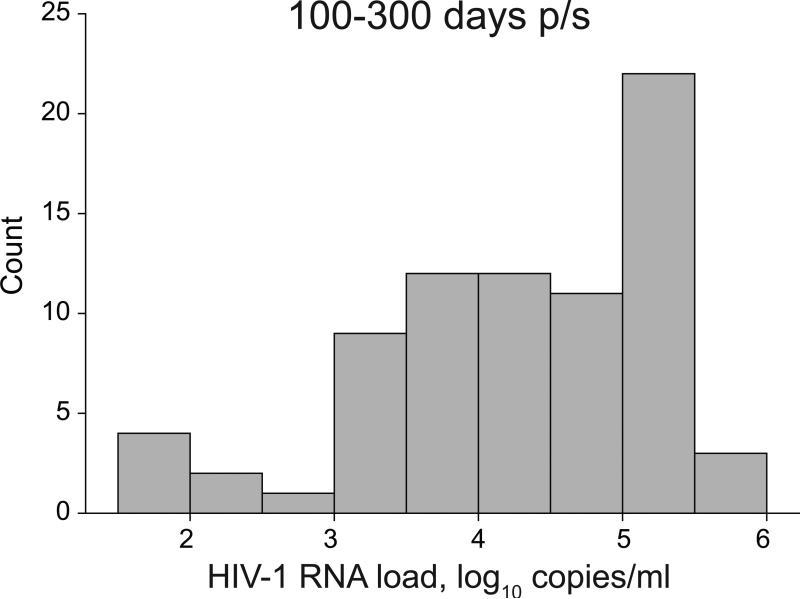
Distribution of HIV-1 RNA load in primary HIV-1 subtype C infection during time interval 100–300 days p/s.
Figure 3.
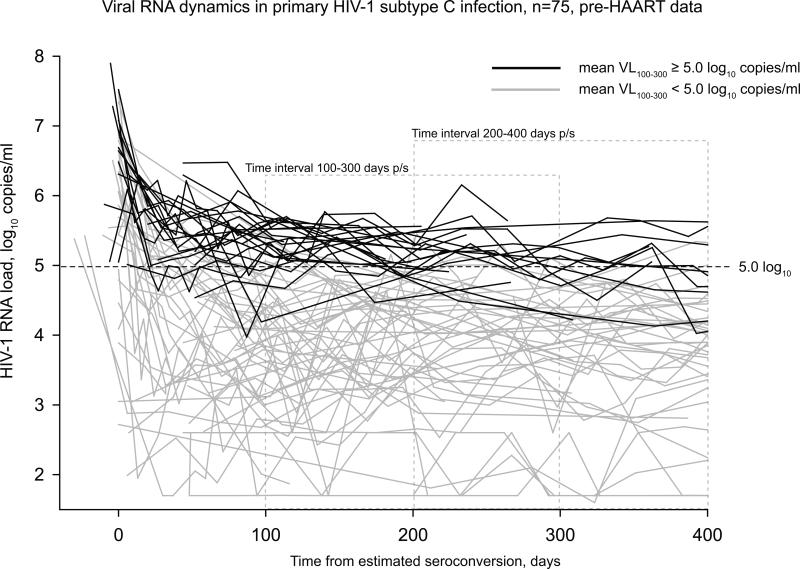
Individual curves of HIV-1 RNA load during the period 0–400 days p/s in primary HIV-1 subtype C infection. Curves representing Extended High Viremics are denoted by black lines. Curves from others are shown by gray lines. Two time intervals, 100–300 days p/s and 200–400 days p/s, are denoted by dashed gray lines.
Duration of the Extended High Viremia state
In HIV-1 infection, after the initial peak of viremia, HIV-1 RNA load is expected to decline to a steady-state level. To address how long high HIV-1 RNA load is maintained during primary HIV-1 infection, the time individuals maintain HIV-1 RNA load ≥ 100,000 (5.0 log10) copies/ml was quantified among Extended High Viremics (≥ 100 days p/s). In addition, the time was computed for a subset of individuals who maintained HIV-1 RNA load ≥ 100,000 (5.0 log10) copies/ml for more than 200 days p/s. The pre-HAART median (IQR) duration of maintaining HIV-1 RNA load ≥ 100,000 (5.0 log10) copies/ml among Extended High Viremics was 271 (188; 340) days p/s. For the subset with average viral load ≥ 100,000 (5.0 log10) copies/ml during the period 200–400 days p/s, the median (IQR) duration was 318 (282; 459) days.
Rapid decline of CD4 in Extended High Viremics
HIV-1-infected individuals maintaining viral load ≥ 100,000 (5.0 log10) copies/ml are likely to experience faster depletion of their CD4+ T cells. Based on the trajectories of CD4 decline among Extended High Viremics, the time of CD4 decline to 250 and 350 was measured in two groups, Extended High Viremics and others. The CD4 decline to 250 matched the current threshold criteria for eligibility of HIV-infected individuals for initiation of antiretroviral treatment in Botswana and South Africa. The second threshold of CD4 decline to 350 was chosen because current treatment guidelines generally recommend that HIV-infected patients with a CD4 cell count less than 350 cells/μl should initiate HAART [33, 34]. The Extended High Viremics had a significantly shorter time to CD4 decline to 350 (median time: 88 vs. 691 days p/s; p<0.0001, Gehan-Wilcoxon test) and a significantly shorter time to CD4 decline to 250 (median time: 363 vs. 1,213 days p/s; p<0.0001, Gehan-Wilcoxon test). The differences in CD4 decline between groups were also supported by the survival Kaplan-Meier analysis (Figure 4), indicating a dramatic drop in CD4 counts during the period 200–300 days p/s in Extended High Viremics.
Figure 4.
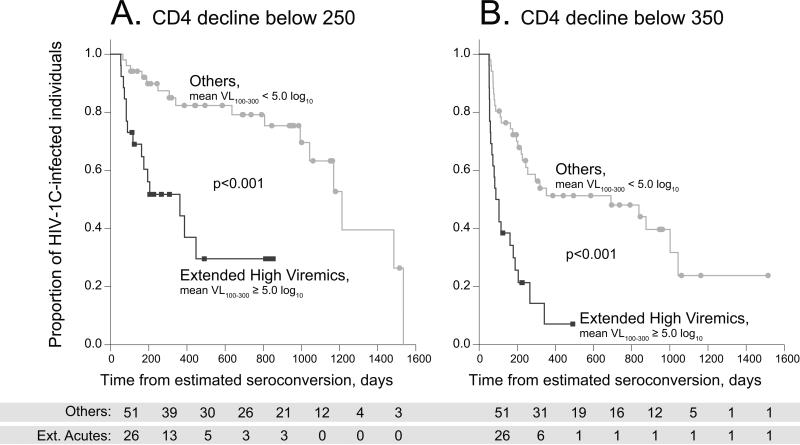
Kaplan-Meier survival analysis of time to CD4 decline below 250 and 350 cell counts in two groups, Extended High Viremics (mean VL100–300 ≥ 5.0 log10 copies/ml) vs. Others (mean VL100–300 < 5.0 log10 copies/ml). Data from both Durban and Botswana cohorts are presented. The significance was determined by the Gehan-Wilcoxon test. A: CD4 decline below 250 cell count. B: CD4 decline below 350 cell count.
Probability of high viral RNA load in primary HIV-1 subtype C infection
Assuming that the clinically meaningful threshold of viral load affecting HIV transmission is likely to be a continuum between 10,000 copies/ml and 100,000 copies/ml, we estimated the probability of viral RNA load higher than a threshold in primary HIV-1 subtype C infection over time. In Figure 5, we plotted the estimated probabilities and associated 95% confidence intervals for three thresholds: 10,000 (4.0 log10), 50,000 (4.7 log10), and 100,000 (5.0 log10) copies/ml. At six months p/s, the probability of viral RNA load higher than 10,000, 50,000, or 100,000 copies/ml was estimated to be 52% (95% CI: 47–57%), 27% (95% CI: 23–32%), or 19% (95% CI: 16–22%), respectively. At one year p/s, the probability of viral RNA load higher than 10,000, 50,000, or 100,000 copies/ml was 46% (95% CI: 41–51%), 23% (95% CI: 19–27%), or 16% (95% CI: 13–19%), respectively.
Figure 5.
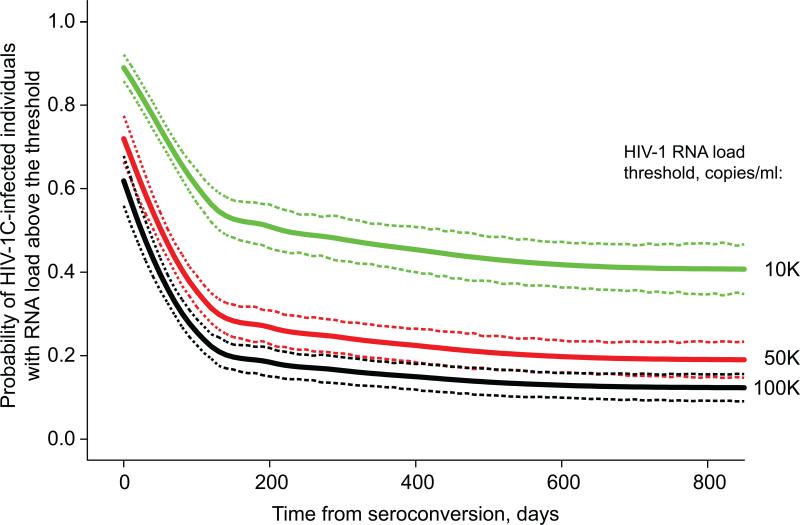
Probability of high viral RNA load at the specified threshold during primary HIV-1 subtype C infection. Time from seroconversion (up to 800 days p/s) is shown on the x axis. Probability of HIV-infected individuals presenting with HIV-1 RNA load at or above specified threshold is denoted on the y axis. A: HIV-1 RNA threshold of 10,000 (4.0 log10) copies/ml. B: HIV-1 RNA threshold of 50,000 (4.7 log10) copies/ml. C: HIV-1 RNA threshold of 100,000 (5.0 log10) copies/ml.
Discussion
A subset of HIV-1 subtype C-infected individuals – Extended High Viremics – maintains high plasma HIV-1 RNA levels for an extended period of time, and was a primary focus of the current study. While the fact that few individuals may have high levels of HIV-1 RNA load for a long period of time has been well recognized, the actual proportion of Extended High Viremics (individuals with HIV-1 RNA load ≥ 100,000 (5.0 log10) copies/ml over 100 days p/s) in primary HIV-1 subtype C infection has hardly been anticipated. The main finding of this study is that one third of HIV-1 subtype C-infected individuals have HIV-1 RNA load 100,000 (5.0 log10) copies/ml and higher during the period 100–300 days p/s, and 19% of individuals maintain high levels of HIV-1 RNA load during the period 200–400 days p/s.
The current analysis was based on cumulative data from two primary HIV-1 subtype C infection cohorts from southern Africa where the epidemic is most severe. Despite a few predictable differences, the two analyzed cohorts demonstrated remarkable similarity in evolution of HIV-1 RNA load and CD4+ T cell counts over time. Merging data from the two cohorts solidified the results due to the increased sample size. A relatively large proportion of Extended High Viremics was not likely due to over-representation of symptomatic patients because identification and enrollment of study subjects were not based on symptoms in both cohorts. A comparative analysis of the two cohorts provided evidence that the observed pattern of Extended High Viremics is common in primary HIV-1 subtype C infection. A high proportion of HIV-1 subtype C-infected individuals with high levels of viral RNA load for extended periods of time could contribute disproportionately to the high prevalence of HIV infection in southern Africa. Such Extended High Viremics seem particularly appropriate for emphasis using interventions described as Treatment-for-Prevention.
The trajectories of CD4 decline among Extended High Viremics provide evidence that the majority of individuals with long-lasting high HIV-1 RNA load are likely to be fast progressors. As is evident from Figure 4, a dramatic decline of CD4+ cells occurred in Extended High Viremics during the first year of HIV-1 subtype C infection. Such a predictable CD4 drop provides a rationale for initiation of early HAART in Extended High Viremics, and leaves little reason for waiting when individuals with high viral HIV-1 RNA load reach the threshold of CD4. The six-month interval of CD4 testing, which is common practice in many countries, may be inadequate for Extended High Viremics due to the fast decline of their CD4+ cell counts, potentially compromising their immune systems substantially. Therefore, public health strategies for initiation of HAART might differ between Extended High Viremics (e.g., the HIV-1 RNA load-based approach) and others (e.g., the currently used approach focusing on CD4 decline).
Although the reasons for maintenance of high viral load in the subset of studied populations are still unidentified, it is likely that viral replicative fitness upon transmission is the major factor contributing to the existence of Extended High Viremics. For example, HIV-1 transmission between genetically similar hosts might provide a favorable environment for advanced replication of the virus adapted to the previous host, which could result in high HIV-1 RNA levels for an extended period of time. To address this important issue, further dedicated studies are warranted.
A comprehensive analysis of immune responses in the context of host genetics and evolution of viral quasispecies may shed light on potential reason(s) for the existence of Extended High Viremics, and is likely to reveal the underlying mechanisms. To keep the study focused on Extended High Viremics, immunological analysis was not included in the scope of the current study, which is one of the study limitations.
It would be tempting to compare the Extended High Viremics infected with HIV-1 subtype C with the well-documented patterns during the early phase of HIV-1 subtype B infection. However, we prefer to avoid a direct comparison due to a lack of comparable data between the epidemics caused by subtypes B and C, which to some extent limits generalization of our findings, at least until similar analyses are performed by others. First, there are important differences between the modes of viral transmission (e.g., heterosexual adults vs. MSM). Second, there is a substantial diversity between the genetics of targeted populations that has been made even more apparent by recent GWAS studies. Third, HIV-1 subtype differences and viral evolution on the population level should be adequately adjusted by relevant host immune responses. It would be important to (re-)analyze the existing data from the early HIV-1 subtype B studies in the context of Extended High Viremics. In this study, we tried to avoid a simplified comparison between HIV-1 subtypes that could be misleading and/or erroneous without a bold and sophisticated approach.
Due to the nature of the analyzed cohorts, information regarding source partners was not available, creating another study limitation. It would be important to track the changes in viral replicative capacity upon transmission to a new host, and to address potential associations between viral replicative capacity and maintenance of high plasma HIV-1 RNA load for an extended period of time in future studies. The relatively short time of follow-up limited the study's ability to track the rate of disease outcomes.
The role of Extended High Viremics in viral transmission is likely to be large, although the current study was not powered to address this question. Extended High Viremics may fuel the HIV/AIDS epidemic. A strong association between levels of HIV-1 RNA load and viral transmission is evident from previous studies [16, 20-25, 27, 35]. Maintaining high viral load for an extended period of time increases the probability of HIV-1 transmission. Extended High Viremics with unknown HIV status might represent the highest-risk group for viral transmission. Therefore, a public health strategy aiming at proactive HIV testing and identification of Extended High Viremics could be a critical part of successful management of the HIV/AIDS epidemic. Introduction of routine plasma HIV-1 RNA testing can help to identify not only individuals with high viremia, but also can improve identification of HIV-infected subjects before seroconversion. The cost-effectiveness and logistical issues related to feasibility of routine viral load testing constitute critical topics that need to be resolved by modeling and translational research in future studies.
Extended High Viremics might represent an appropriate target for studying interventions for developing preventive strategies aiming at control of the HIV/AIDS epidemic in communities. Assuming the disproportionate contribution of Extended High Viremics to new HIV-1 transmissions, successful management of Extended High Viremics could provide for a valid assessment of efficacy of a variety of behavioral and biomedical intervention studies. Focusing on a subset of Extended High Viremics could help to modify the “Treatment-for-Prevention” approach, and make it more feasible for mitigating the HIV epidemic in appropriate communities [28].
Supplementary Material
Figure S1. Pre-HAART HIV-1 RNA load dynamics in Durban cohort. Axis x (time from estimated seroconversion in days) and y (HIV-1 RNA load, log10 copies/ml) are uniform throughout individual graphs. The patient code is shown at the upper left corner of each graph. The threshold of 100,000 (5.0 log10) copies/ml is denoted by dashed line in each graph. Six subjects in the Durban cohort did not have viral load measurements during the period 100–300 days p/s, and therefore were not included in the analysis: AS2-0973, AS2-1630, AS3-0942, AS5-0968, AS8-0292, and AS8-0443.
Figure S2. Pre-HAART HIV-1 RNA load dynamics in Botswana cohort. Axis x (time from estimated seroconversion in days) and y (HIV-1 RNA load, log10 copies/ml) are uniform throughout individual graphs. The patient code is shown at the upper left corner of each graph. The threshold of 100,000 (5.0 log10) copies/ml is denoted by dashed line in each graph.
Figure S3. Pre-HAART CD4+ cell counts in Durban cohort. Axis x (time from estimated seroconversion in days) is uniform throughout individual graphs. Axis y (CD4 cell count) is shown in the range 0–800 cells unless the y axis is shown with breaks and individual CD4 scale. The patient code is shown at the upper left corner of each graph. Six subjects in the Durban cohort did not have viral load measurements during the period 100–300 days p/s, and therefore were not included in the analysis: AS2-0973, AS2-1630, AS3-0942, AS5-0968, AS8-0292, and AS8-0443.
Figure S4. Pre-HAART CD4+ cell counts in Botswana cohort. Axis x (time from estimated seroconversion in days) is uniform throughout individual graphs. Axis y (CD4 cell count) is shown in the range 0– 800 cells unless the y axis is shown with breaks and individual CD4 scale. The patient code is shown at the upper left corner of each graph.
Acknowledgements
The study in Durban was supported in part by the US National Institute of Allergy and Infectious Diseases (R01 AI067073) and a gift from the Mark and Lisa Schwartz Foundation (BDW). The study in Botswana was funded by the US National Institute of Allergy and Infectious Diseases (R01 AI057027). The analysis was supported by the US National Institute of Allergy and Infectious Disease (R01 AI51164). We are grateful to all participants in the research studies in Durban, South Africa, and Gaborone, Botswana. We thank the teams at the study sites for work on data and sample collection, and management's support in communication with IRBs. Finally, we thank Lendsey Melton for excellent editorial assistance.
Footnotes
Author Contributions
Conceived and designed the study: VN, ME. Provided clinical support & data: TN, HB, FC, JM. Analyzed the data: VN, RW, VDG. Wrote the paper: VN, TN, RW, VDG, BDW, ME. All authors have read and approved the text of the manuscript.
References
- 1.Kaufmann GR, Cunningham P, Kelleher AD, Zaunders J, Carr A, Vizzard J, et al. Patterns of viral dynamics during primary human immunodeficiency virus type 1 infection. The Sydney Primary HIV Infection Study Group. J Infect Dis. 1998;178:1812–1815. doi: 10.1086/314480. [DOI] [PubMed] [Google Scholar]
- 2.Kaufmann GR, Duncombe C, Zaunders J, Cunningham P, Cooper D. Primary HIV-1 infection: a review of clinical manifestations, immunologic and virologic changes. AIDS Patient Care STDS. 1998;12:759–767. doi: 10.1089/apc.1998.12.759. [DOI] [PubMed] [Google Scholar]
- 3.Little SJ, McLean AR, Spina CA, Richman DD, Havlir DV. Viral dynamics of acute HIV-1 infection. J Exp Med. 1999;190:841–850. doi: 10.1084/jem.190.6.841. [DOI] [PMC free article] [PubMed] [Google Scholar]
- 4.Fiebig EW, Wright DJ, Rawal BD, Garrett PE, Schumacher RT, Peddada L, et al. Dynamics of HIV viremia and antibody seroconversion in plasma donors: implications for diagnosis and staging of primary HIV infection. AIDS. 2003;17:1871–1879. doi: 10.1097/00002030-200309050-00005. [DOI] [PubMed] [Google Scholar]
- 5.Schacker TW, Hughes JP, Shea T, Coombs RW, Corey L. Biological and virologic characteristics of primary HIV infection. Ann Intern Med. 1998;128:613–620. doi: 10.7326/0003-4819-128-8-199804150-00001. [DOI] [PubMed] [Google Scholar]
- 6.Daar ES, Moudgil T, Meyer RD, Ho DD. Transient high levels of viremia in patients with primary human immunodeficiency virus type 1 infection. N Engl J Med. 1991;324:961–964. doi: 10.1056/NEJM199104043241405. [DOI] [PubMed] [Google Scholar]
- 7.Mellors JW, Rinaldo CR, Gupta P, White RM, Todd JA, Kingsley LA. Prognosis in HIV-1 infection predicted by the quantity of virus in plasma. Science. 1996;272:1167–1170. doi: 10.1126/science.272.5265.1167. [DOI] [PubMed] [Google Scholar]
- 8.Mellors JW, Kingsley LA, Rinaldo CRJ, Todd JA, Hoo BS, Kokka RP, Gupta P. Quantitation of HIV-1 RNA in plasma predicts outcome after seroconversion. Ann Intern Med. 1995;122:573–579. doi: 10.7326/0003-4819-122-8-199504150-00003. [DOI] [PubMed] [Google Scholar]
- 9.Mellors JW, Munoz A, Giorgi JV, Margolick JB, Tassoni CJ, Gupta P, et al. Plasma viral load and CD4+ lymphocytes as prognostic markers of HIV-1 infection. Ann Intern Med. 1997;126:946–954. doi: 10.7326/0003-4819-126-12-199706150-00003. [DOI] [PubMed] [Google Scholar]
- 10.Clark S, Saag M, Decker W, Campbell-Hill S, Roberson J, Veldkamp P, et al. High titers of cytopathic virus in plasma of patients with symptomatic primary HIV-1 infection. N Engl J Med. 1991;324:954–960. doi: 10.1056/NEJM199104043241404. [DOI] [PubMed] [Google Scholar]
- 11.Kassutto S, Maghsoudi K, Johnston MN, Robbins GK, Burgett NC, Sax PE, et al. Longitudinal analysis of clinical markers following antiretroviral therapy initiated during acute or early HIV type 1 infection. Clin Infect Dis. 2006;42:1024–1031. doi: 10.1086/500410. [DOI] [PubMed] [Google Scholar]
- 12.Kahn JO, Walker BD. Acute human immunodeficiency virus type 1 infection. N Engl J Med. 1998;339:33–39. doi: 10.1056/NEJM199807023390107. [DOI] [PubMed] [Google Scholar]
- 13.de Wolf F, Spijkerman I, Schellekens PT, Langendam M, Kuiken C, Bakker M, et al. AIDS prognosis based on HIV-1 RNA, CD4+ T-cell count and function: markers with reciprocal predictive value over time after seroconversion. AIDS. 1997;11:1799–1806. doi: 10.1097/00002030-199715000-00003. [DOI] [PubMed] [Google Scholar]
- 14.Lavreys L, Baeten JM, Overbaugh J, Panteleeff DD, Chohan BH, Richardson BA, et al. Virus load during primary Human Immunodeficiency Virus (HIV) type 1 infection is related to the severity of acute HIV illness in Kenyan women. Clin Infect Dis. 2002;35:77–81. doi: 10.1086/340862. [DOI] [PubMed] [Google Scholar]
- 15.Pilcher CD, Price MA, Hoffman IF, Galvin S, Martinson FE, Kazembe PN, et al. Frequent detection of acute primary HIV infection in men in Malawi. AIDS. 2004;18:517–524. doi: 10.1097/00002030-200402200-00019. [DOI] [PubMed] [Google Scholar]
- 16.Dyer JR, Kazembe P, Vernazza PL, Gilliam BL, Maida M, Zimba D, et al. High levels of human immunodeficiency virus type 1 in blood and semen of seropositive men in sub-Saharan Africa. J Infect Dis. 1998;177:1742–1746. doi: 10.1086/517436. [DOI] [PubMed] [Google Scholar]
- 17.Novitsky V, Woldegabriel E, Kebaabetswe L, Rossenkhan R, Mlotshwa B, Bonney C, et al. Viral Load and CD4+ T Cell Dynamics in Primary HIV-1 Subtype C Infection. J Acquir Immune Defic Syndr. 2009;50:65–76. doi: 10.1097/QAI.0b013e3181900141. [DOI] [PMC free article] [PubMed] [Google Scholar]
- 18.Ball SC, Abraha A, Collins KR, Marozsan AJ, Baird H, Quinones-Mateu ME, et al. Comparing the ex vivo fitness of CCR5-tropic human immunodeficiency virus type 1 isolates of subtypes B and C. J Virol. 2003;77:1021–1038. doi: 10.1128/JVI.77.2.1021-1038.2003. [DOI] [PMC free article] [PubMed] [Google Scholar]
- 19.Abraha A, Nankya IL, Gibson R, Demers K, Tebit DM, Johnston E, et al. CCR5- and CXCR4-tropic subtype C HIV-1 isolates have lower pathogenic fitness as compared to the other dominant group M subtypes: Implications for the epidemic. J Virol. 2009;83:5592–5605. doi: 10.1128/JVI.02051-08. [DOI] [PMC free article] [PubMed] [Google Scholar]
- 20.Fideli US, Allen SA, Musonda R, Trask S, Hahn BH, Weiss H, et al. Virologic and immunologic determinants of heterosexual transmission of human immunodeficiency virus type 1 in Africa. AIDS Res Hum Retroviruses. 2001;17:901–910. doi: 10.1089/088922201750290023. [DOI] [PMC free article] [PubMed] [Google Scholar]
- 21.Quinn TC, Wawer MJ, Sewankambo N, Serwadda D, Li C, Wabwire-Mangen F, et al. Viral load and heterosexual transmission of human immunodeficiency virus type 1. Rakai Project Study Group. N Engl J Med. 2000;342:921–929. doi: 10.1056/NEJM200003303421303. [DOI] [PubMed] [Google Scholar]
- 22.Lingappa JR, Hughes JP, Wang RS, Baeten JM, Celum C, Gray GE, et al. Estimating the impact of plasma HIV-1 RNA reductions on heterosexual HIV-1 transmission risk. PLoS One. 2010;5:e12598. doi: 10.1371/journal.pone.0012598. [DOI] [PMC free article] [PubMed] [Google Scholar]
- 23.Hisada M, O'Brien TR, Rosenberg PS, Goedert JJ. Virus load and risk of heterosexual transmission of human immunodeficiency virus and hepatitis C virus by men with hemophilia. The Multicenter Hemophilia Cohort Study. J Infect Dis. 2000;181:1475–1478. doi: 10.1086/315396. [DOI] [PubMed] [Google Scholar]
- 24.Tovanabutra S, Robison V, Wongtrakul J, Sennum S, Suriyanon V, Kingkeow D, et al. Male viral load and heterosexual transmission of HIV-1 subtype E in northern Thailand. J Acquir Immune Defic Syndr. 2002;29:275–283. doi: 10.1097/00126334-200203010-00008. [DOI] [PubMed] [Google Scholar]
- 25.Wawer MJ, Gray RH, Sewankambo NK, Serwadda D, Li X, Laeyendecker O, et al. Rates of HIV-1 transmission per coital act, by stage of HIV-1 infection, in Rakai, Uganda. J Infect Dis. 2005;191:1403–1409. doi: 10.1086/429411. [DOI] [PubMed] [Google Scholar]
- 26.Celum CL, Buchbinder SP, Donnell D, Douglas JM, Jr., Mayer K, Koblin B, et al. Early human immunodeficiency virus (HIV) infection in the HIV Network for Prevention Trials Vaccine Preparedness Cohort: risk behaviors, symptoms, and early plasma and genital tract virus load. J Infect Dis. 2001;183:23–35. doi: 10.1086/317658. [DOI] [PubMed] [Google Scholar]
- 27.Modjarrad K, Chamot E, Vermund SH. Impact of small reductions in plasma HIV RNA levels on the risk of heterosexual transmission and disease progression. AIDS. 2008;22:2179–2185. doi: 10.1097/QAD.0b013e328312c756. [DOI] [PMC free article] [PubMed] [Google Scholar]
- 28.Novitsky V, Wang R, Bussmann H, Lockman S, Baum M, Shapiro R, et al. HIV-1 subtype C-infected individuals maintaining high viral load as potential targets for the “test-and-treat” approach to reduce HIV transmission. PLoS One. 2010;5:e10148. doi: 10.1371/journal.pone.0010148. [DOI] [PMC free article] [PubMed] [Google Scholar]
- 29.Wright JK, Novitsky V, Brockman MA, Brumme ZL, Brumme CJ, Carlson JM, et al. Influence of Gag-protease-mediated replication capacity on disease progression in individuals recently infected with HIV-1 subtype C. J Virol. 2011 doi: 10.1128/JVI.02520-10. in press. Epub 2011 Feb 2. [DOI] [PMC free article] [PubMed] [Google Scholar]
- 30.Novitsky V, Woldegabriel E, Wester C, McDonald E, Rossenkhan R, Ketunuti M, et al. Identification of primary HIV-1C infection in Botswana. AIDS Care. 2008;20:806–811. doi: 10.1080/09540120701694055. [DOI] [PMC free article] [PubMed] [Google Scholar]
- 31.Novitsky V, Wang R, Kebaabetswe L, Greenwald J, Rossenkhan R, Moyo S, et al. Better control of early viral replication is associated with slower rate of elicited antiviral antibodies in the detuned enzyme immunoassay during primary HIV-1C infection. J Acquir Immune Defic Syndr. 2009;52:265–272. doi: 10.1097/QAI.0b013e3181ab6ef0. [DOI] [PMC free article] [PubMed] [Google Scholar]
- 32.Novitsky V, Lagakos S, Herzig M, Bonney C, Kebaabetswe L, Rossenkhan R, et al. Evolution of proviral gp120 over the first year of HIV-1 subtype C infection. Virology. 2009;383:47–59. doi: 10.1016/j.virol.2008.09.017. [DOI] [PMC free article] [PubMed] [Google Scholar]
- 33.Hammer SM, Eron JJ, Jr., Reiss P, Schooley RT, Thompson MA, Walmsley S, et al. Antiretroviral treatment of adult HIV infection: 2008 recommendations of the International AIDS Society-USA panel. JAMA. 2008;300:555–570. doi: 10.1001/jama.300.5.555. [DOI] [PubMed] [Google Scholar]
- 34.Panel on Antiretroviral Guidelines for Adults and Adolescents. Department of Health and Human Services; Dec 1, 2009. [1 November 2010]. Guidelines for the use of antiretroviral agents in HIV-1-infected adults and adolescents. pp. 1–161. Available at http://www.aidsinfo.nih.gov/ContentFiles/AdultandAdolescentGL.pdf. [Google Scholar]
- 35.Hollingsworth TD, Anderson RM, Fraser C. HIV-1 transmission, by stage of infection. J Infect Dis. 2008;198:687–693. doi: 10.1086/590501. [DOI] [PubMed] [Google Scholar]
Associated Data
This section collects any data citations, data availability statements, or supplementary materials included in this article.
Supplementary Materials
Figure S1. Pre-HAART HIV-1 RNA load dynamics in Durban cohort. Axis x (time from estimated seroconversion in days) and y (HIV-1 RNA load, log10 copies/ml) are uniform throughout individual graphs. The patient code is shown at the upper left corner of each graph. The threshold of 100,000 (5.0 log10) copies/ml is denoted by dashed line in each graph. Six subjects in the Durban cohort did not have viral load measurements during the period 100–300 days p/s, and therefore were not included in the analysis: AS2-0973, AS2-1630, AS3-0942, AS5-0968, AS8-0292, and AS8-0443.
Figure S2. Pre-HAART HIV-1 RNA load dynamics in Botswana cohort. Axis x (time from estimated seroconversion in days) and y (HIV-1 RNA load, log10 copies/ml) are uniform throughout individual graphs. The patient code is shown at the upper left corner of each graph. The threshold of 100,000 (5.0 log10) copies/ml is denoted by dashed line in each graph.
Figure S3. Pre-HAART CD4+ cell counts in Durban cohort. Axis x (time from estimated seroconversion in days) is uniform throughout individual graphs. Axis y (CD4 cell count) is shown in the range 0–800 cells unless the y axis is shown with breaks and individual CD4 scale. The patient code is shown at the upper left corner of each graph. Six subjects in the Durban cohort did not have viral load measurements during the period 100–300 days p/s, and therefore were not included in the analysis: AS2-0973, AS2-1630, AS3-0942, AS5-0968, AS8-0292, and AS8-0443.
Figure S4. Pre-HAART CD4+ cell counts in Botswana cohort. Axis x (time from estimated seroconversion in days) is uniform throughout individual graphs. Axis y (CD4 cell count) is shown in the range 0– 800 cells unless the y axis is shown with breaks and individual CD4 scale. The patient code is shown at the upper left corner of each graph.